Testing gravity at cosmic scales with clusters of
- Slides: 28
Testing gravity at cosmic scales with clusters of galaxies, the CMB and galaxy clustering David Rapetti DARK Fellow Dark Cosmology Centre, Niels Bohr Institute University of Copenhagen In collaboration with Chris Blake (Swinburne), Steve Allen (KIPAC) , Adam Mantz (KICP), David Parkinson (Queensland), Florian Beutler (ICRAR) July 5, 2012 Stockholm, MG 13
Outline: combined measurements of growth and expansion • Cluster abundance and scaling relations – Beyond CDM: Constraints on dark energy – Beyond CDM: Constraints on gravity at large scales • Galaxy clustering: redshift space distortions and the Alcock. Paczynski effect • Combined constraints on cosmic growth and expansion: breaking degeneracies July 5, 2012 Stockholm, MG 13
Cluster abundance and scaling relations e. g. Mantz et al 08, 10 a, 10 b; Vikhlinin et al 09; Rapetti et al. 09, 10; Schmidt et al 09 July 5, 2012 Stockholm, MG 13
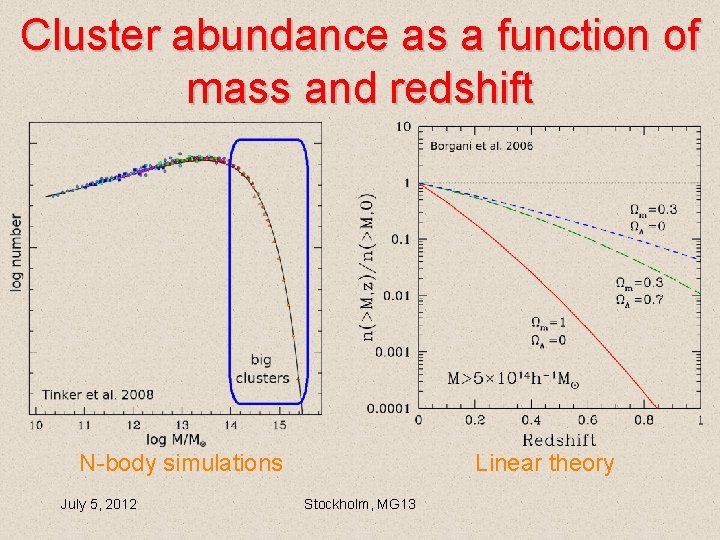
Cluster abundance as a function of mass and redshift N-body simulations July 5, 2012 Linear theory Stockholm, MG 13
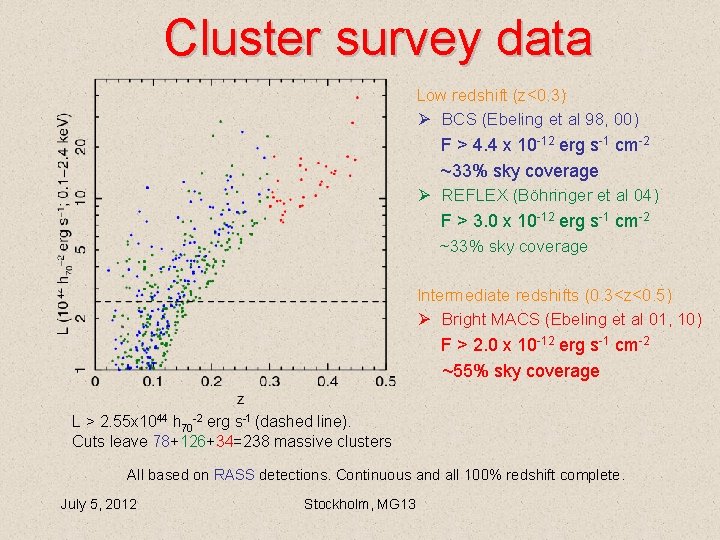
Cluster survey data Low redshift (z<0. 3) Ø BCS (Ebeling et al 98, 00) F > 4. 4 x 10 -12 erg s-1 cm-2 ~33% sky coverage Ø REFLEX (Böhringer et al 04) F > 3. 0 x 10 -12 erg s-1 cm-2 ~33% sky coverage Intermediate redshifts (0. 3<z<0. 5) Ø Bright MACS (Ebeling et al 01, 10) F > 2. 0 x 10 -12 erg s-1 cm-2 ~55% sky coverage L > 2. 55 x 1044 h 70 -2 erg s-1 (dashed line). Cuts leave 78+126+34=238 massive clusters All based on RASS detections. Continuous and all 100% redshift complete. July 5, 2012 Stockholm, MG 13
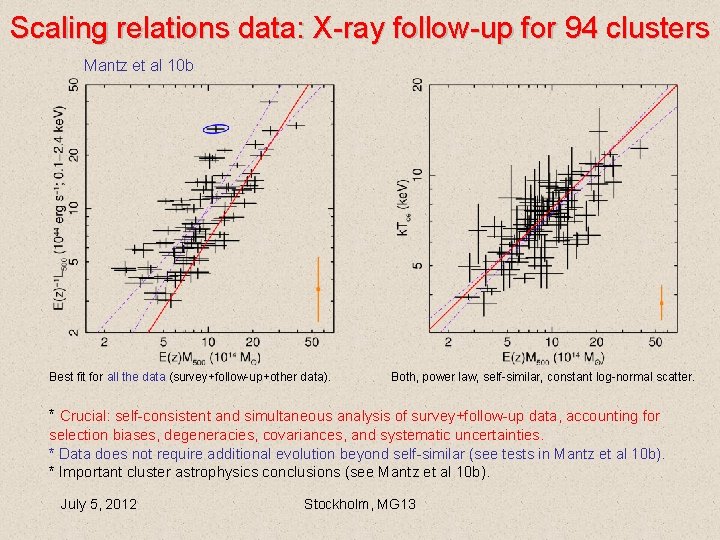
Scaling relations data: X-ray follow-up for 94 clusters Mantz et al 10 b Best fit for all the data (survey+follow-up+other data). Both, power law, self-similar, constant log-normal scatter. * Crucial: self-consistent and simultaneous analysis of survey+follow-up data, accounting for selection biases, degeneracies, covariances, and systematic uncertainties. * Data does not require additional evolution beyond self-similar (see tests in Mantz et al 10 b). * Important cluster astrophysics conclusions (see Mantz et al 10 b). July 5, 2012 Stockholm, MG 13
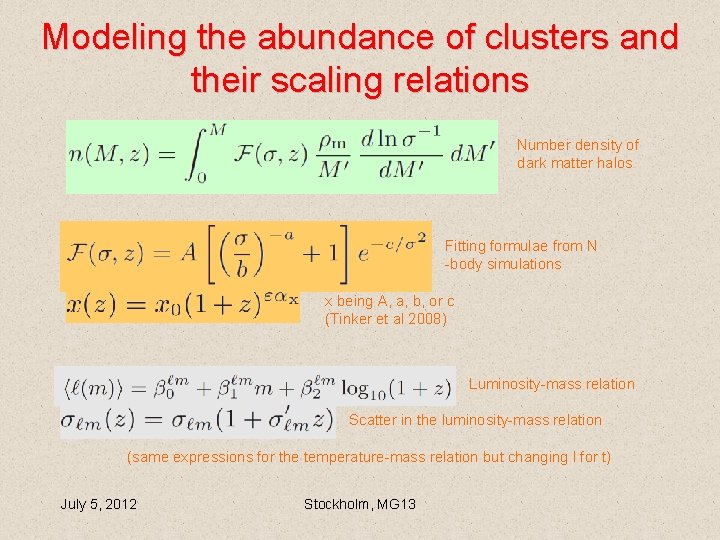
Modeling the abundance of clusters and their scaling relations Number density of dark matter halos Fitting formulae from N -body simulations x being A, a, b, or c (Tinker et al 2008) Luminosity-mass relation Scatter in the luminosity-mass relation (same expressions for the temperature-mass relation but changing l for t) July 5, 2012 Stockholm, MG 13
Beyond CDM: Constraints on dark energy “The Observed Growth of Massive Galaxy Clusters I: Statistical Methods and Cosmological Constraints”, MNRAS 406, 1759, 2010 Adam Mantz, Steven Allen, David Rapetti, Harald Ebeling July 5, 2012 Stockholm, MG 13
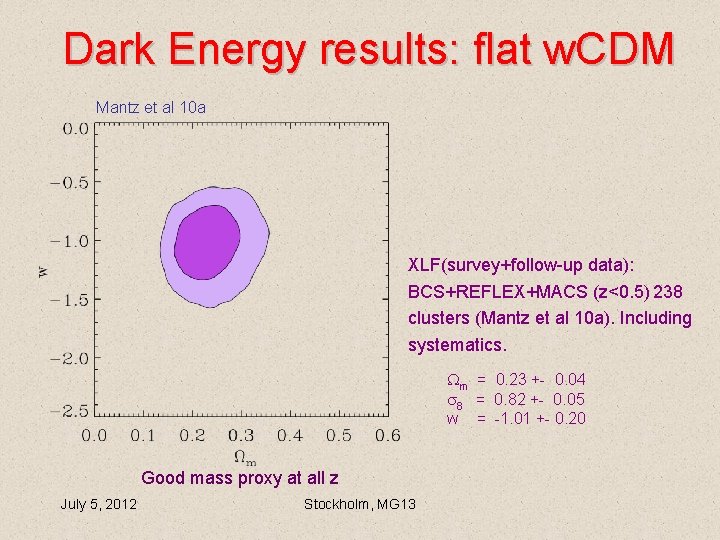
Dark Energy results: flat w. CDM Mantz et al 10 a XLF(survey+follow-up data): BCS+REFLEX+MACS (z<0. 5) 238 clusters (Mantz et al 10 a). Including systematics. m = 0. 23 +- 0. 04 8 = 0. 82 +- 0. 05 w = -1. 01 +- 0. 20 Good mass proxy at all z July 5, 2012 Stockholm, MG 13
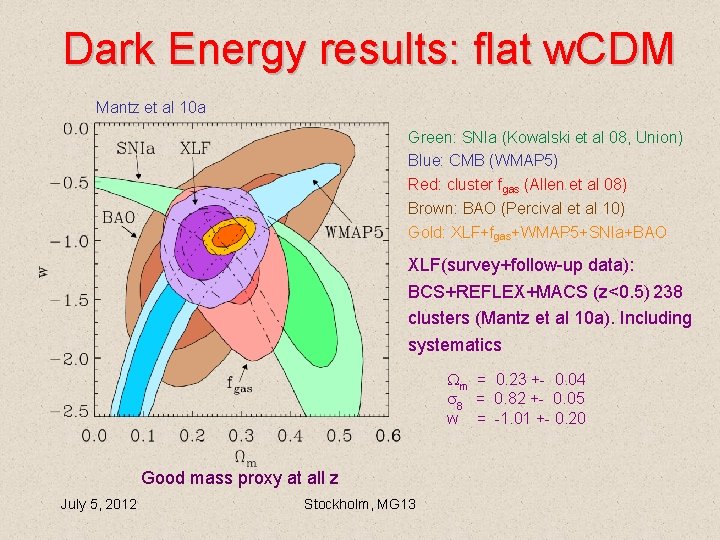
Dark Energy results: flat w. CDM Mantz et al 10 a Green: SNIa (Kowalski et al 08, Union) Blue: CMB (WMAP 5) Red: cluster fgas (Allen et al 08) Brown: BAO (Percival et al 10) Gold: XLF+fgas+WMAP 5+SNIa+BAO XLF(survey+follow-up data): BCS+REFLEX+MACS (z<0. 5) 238 clusters (Mantz et al 10 a). Including systematics m = 0. 23 +- 0. 04 8 = 0. 82 +- 0. 05 w = -1. 01 +- 0. 20 Good mass proxy at all z July 5, 2012 Stockholm, MG 13
Beyond CDM: Constraints on gravity at large scales “The Observed Growth of Massive Galaxy Clusters III: Testing General Relativity at Cosmological Scales”, MNRAS 406, 1796, 2010 David Rapetti, Steven Allen, Adam Mantz, Harald Ebeling (Chandra/NASA press release together with Schmidt, Vikhlinin & Hu 09, April 14 2010, “Einstein’s Theory Fights off Challengers”) July 5, 2012 Stockholm, MG 13
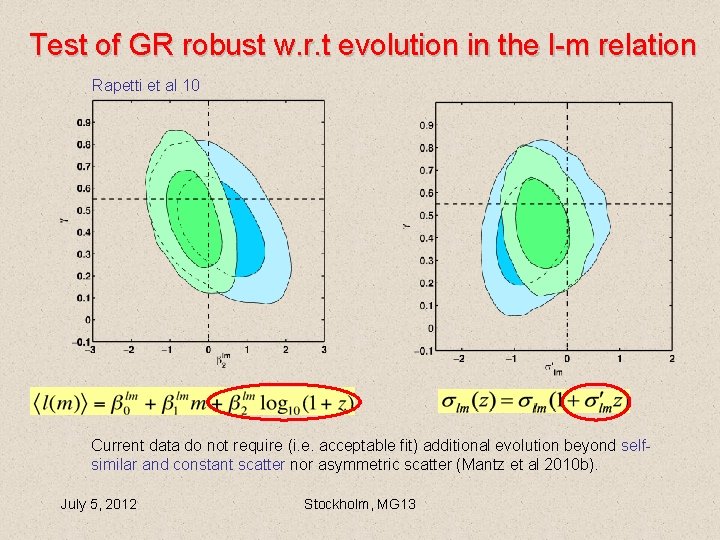
Test of GR robust w. r. t evolution in the l-m relation Rapetti et al 10 Current data do not require (i. e. acceptable fit) additional evolution beyond selfsimilar and constant scatter nor asymmetric scatter (Mantz et al 2010 b). July 5, 2012 Stockholm, MG 13
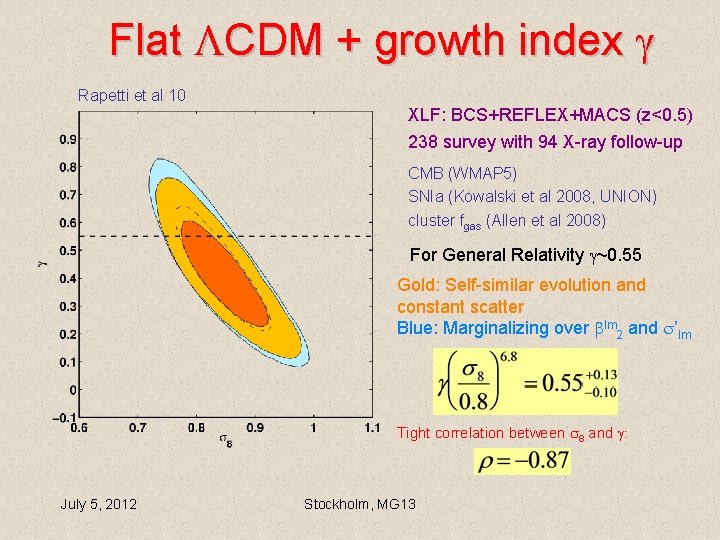
Flat CDM + growth index Rapetti et al 10 XLF: BCS+REFLEX+MACS (z<0. 5) 238 survey with 94 X-ray follow-up CMB (WMAP 5) SNIa (Kowalski et al 2008, UNION) cluster fgas (Allen et al 2008) For General Relativity ~0. 55 Gold: Self-similar evolution and constant scatter Blue: Marginalizing over lm 2 and ’lm Tight correlation between 8 and July 5, 2012 Stockholm, MG 13
Redshift space distortions and Alcock-Paczynski effect e. g. Blake et al 11; Beutler et al 2012; Reid et al 12 July 5, 2012 Stockholm, MG 13
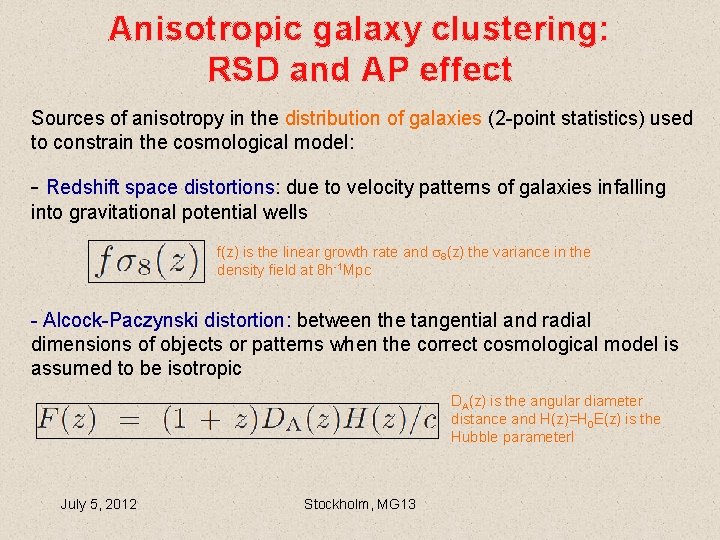
Anisotropic galaxy clustering: RSD and AP effect Sources of anisotropy in the distribution of galaxies (2 -point statistics) used to constrain the cosmological model: - Redshift space distortions: due to velocity patterns of galaxies infalling into gravitational potential wells f(z) is the linear growth rate and 8(z) the variance in the density field at 8 h-1 Mpc - Alcock-Paczynski distortion: between the tangential and radial dimensions of objects or patterns when the correct cosmological model is assumed to be isotropic DA(z) is the angular diameter distance and H(z)=H 0 E(z) is the Hubble parameterl July 5, 2012 Stockholm, MG 13
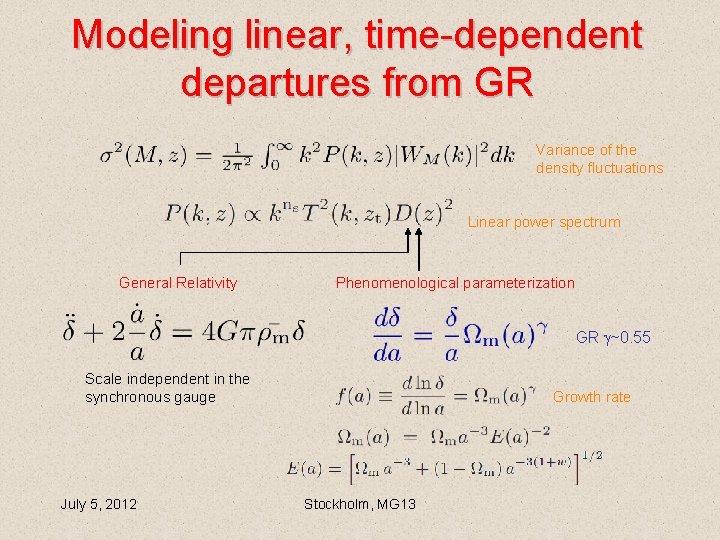
Modeling linear, time-dependent departures from GR Variance of the density fluctuations Linear power spectrum General Relativity Phenomenological parameterization GR ~0. 55 Scale independent in the synchronous gauge July 5, 2012 Growth rate Stockholm, MG 13
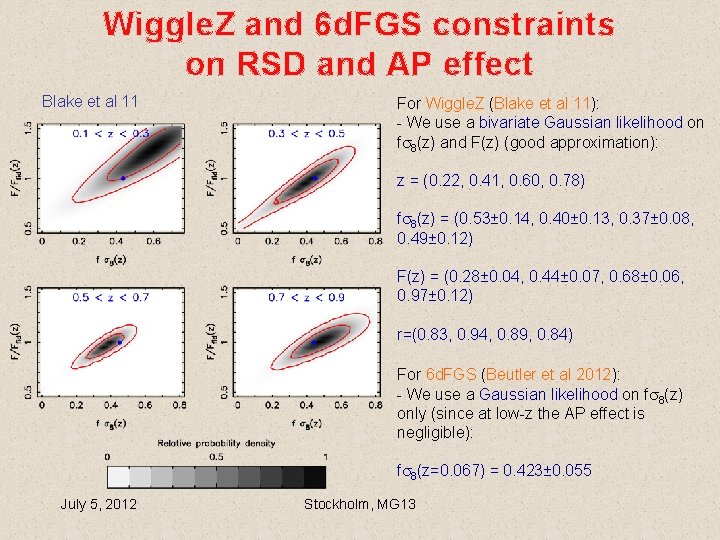
Wiggle. Z and 6 d. FGS constraints on RSD and AP effect Blake et al 11 For Wiggle. Z (Blake et al 11): - We use a bivariate Gaussian likelihood on f 8(z) and F(z) (good approximation): z = (0. 22, 0. 41, 0. 60, 0. 78) f 8(z) = (0. 53± 0. 14, 0. 40± 0. 13, 0. 37± 0. 08, 0. 49± 0. 12) F(z) = (0. 28± 0. 04, 0. 44± 0. 07, 0. 68± 0. 06, 0. 97± 0. 12) r=(0. 83, 0. 94, 0. 89, 0. 84) For 6 d. FGS (Beutler et al 2012): - We use a Gaussian likelihood on f 8(z) only (since at low-z the AP effect is negligible): f 8(z=0. 067) = 0. 423± 0. 055 July 5, 2012 Stockholm, MG 13
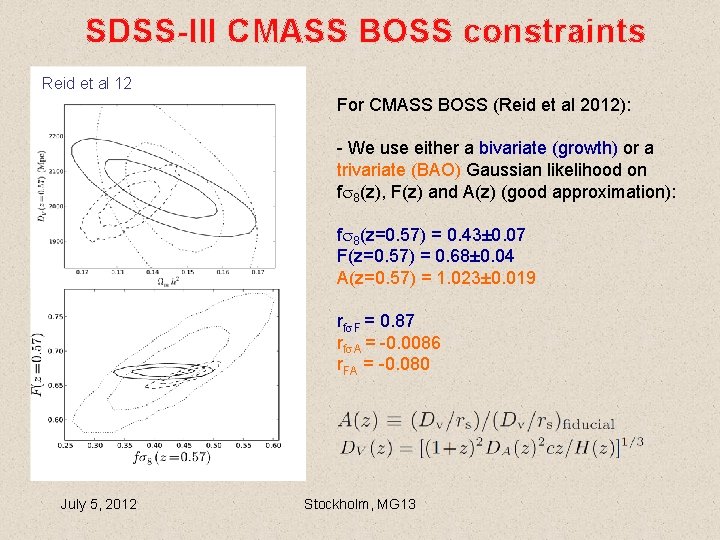
SDSS-III CMASS BOSS constraints Reid et al 12 For CMASS BOSS (Reid et al 2012): - We use either a bivariate (growth) or a trivariate (BAO) Gaussian likelihood on f 8(z), F(z) and A(z) (good approximation): f 8(z=0. 57) = 0. 43± 0. 07 F(z=0. 57) = 0. 68± 0. 04 A(z=0. 57) = 1. 023± 0. 019 rf F = 0. 87 rf A = -0. 0086 r. FA = -0. 080 July 5, 2012 Stockholm, MG 13
Combined constraints on growth and expansion: breaking degeneracies “A combined measurement of cosmic growth and expansion from clusters of galaxies, the CMB and galaxy clustering”, ar. Xiv: 1205. 4679 David Rapetti, Chris Blake, Steven Allen, Adam Mantz, David Parkinson, Florian Beutler July 5, 2012 Stockholm, MG 13
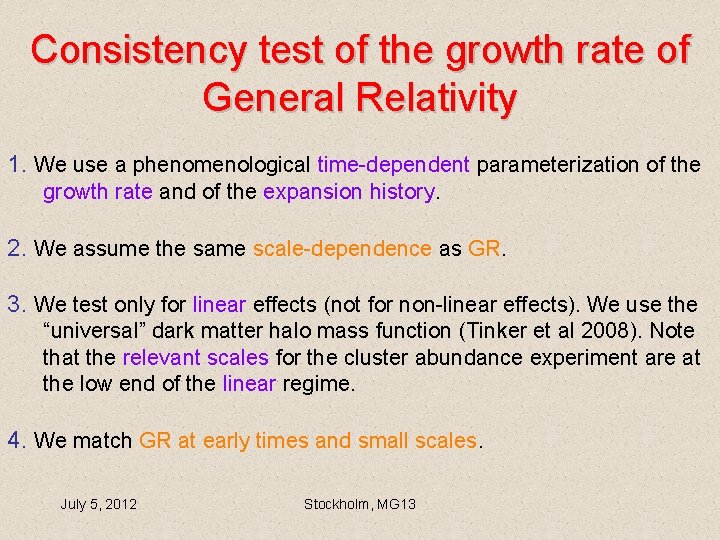
Consistency test of the growth rate of General Relativity 1. We use a phenomenological time-dependent parameterization of the growth rate and of the expansion history. 2. We assume the same scale-dependence as GR. 3. We test only for linear effects (not for non-linear effects). We use the “universal” dark matter halo mass function (Tinker et al 2008). Note that the relevant scales for the cluster abundance experiment are at the low end of the linear regime. 4. We match GR at early times and small scales. July 5, 2012 Stockholm, MG 13
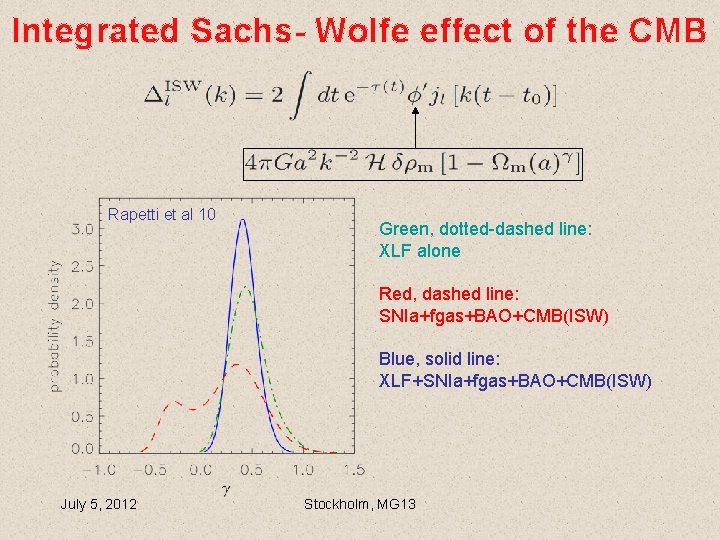
Integrated Sachs- Wolfe effect of the CMB Rapetti et al 10 Green, dotted-dashed line: XLF alone Red, dashed line: SNIa+fgas+BAO+CMB(ISW) Blue, solid line: XLF+SNIa+fgas+BAO+CMB(ISW) July 5, 2012 Stockholm, MG 13
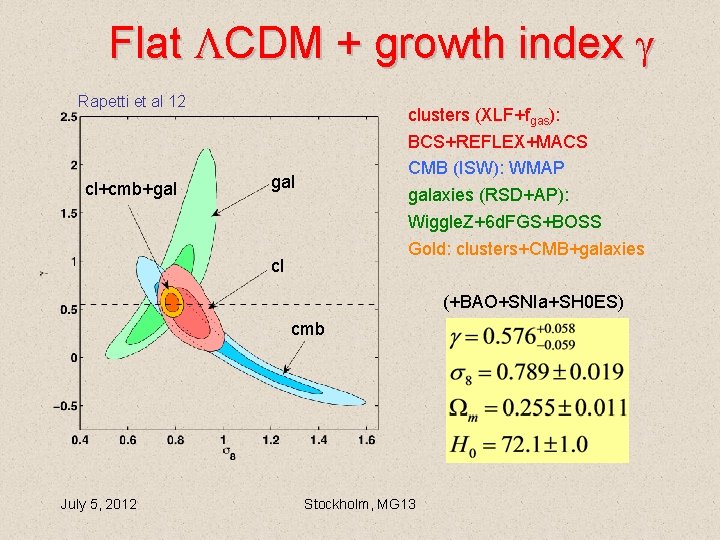
Flat CDM + growth index Rapetti et al 12 cl+cmb+gal clusters (XLF+fgas): BCS+REFLEX+MACS CMB (ISW): WMAP galaxies (RSD+AP): Wiggle. Z+6 d. FGS+BOSS Gold: clusters+CMB+galaxies gal cl (+BAO+SNIa+SH 0 ES) cmb July 5, 2012 Stockholm, MG 13
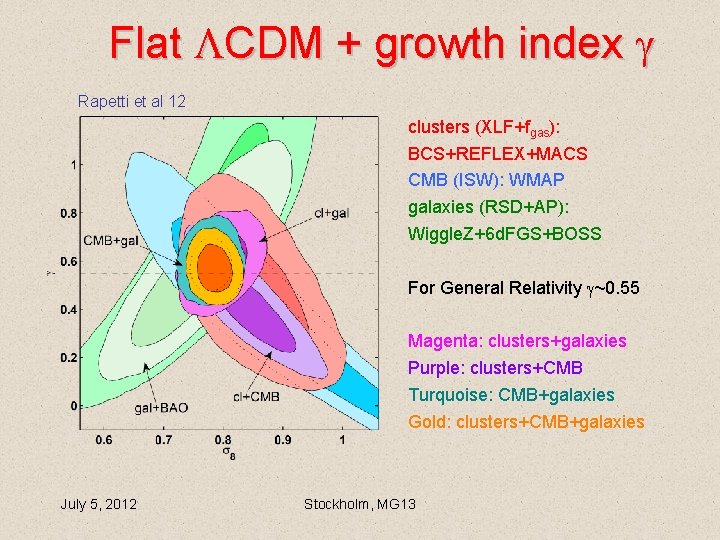
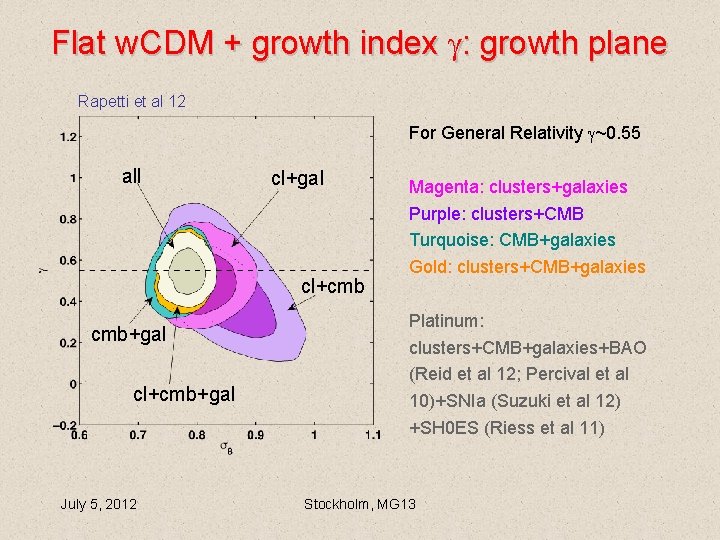
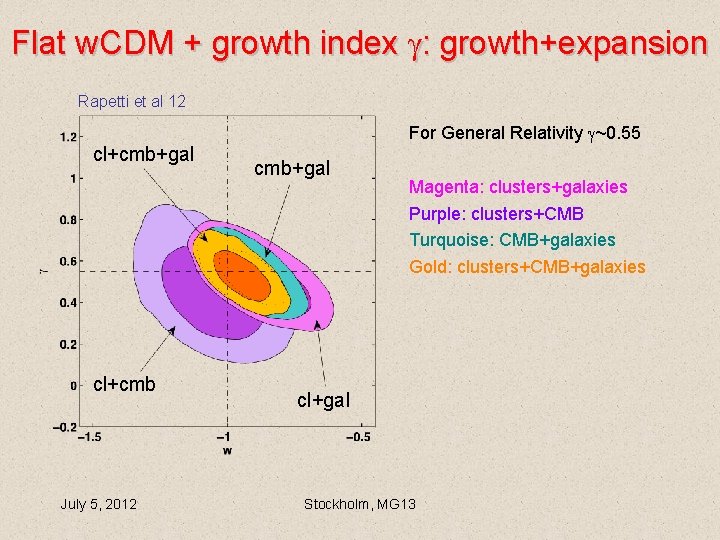
Flat CDM + growth index Rapetti et al 12 clusters (XLF+fgas): BCS+REFLEX+MACS CMB (ISW): WMAP galaxies (RSD+AP): Wiggle. Z+6 d. FGS+BOSS For General Relativity ~0. 55 Magenta: clusters+galaxies Purple: clusters+CMB Turquoise: CMB+galaxies Gold: clusters+CMB+galaxies July 5, 2012 Stockholm, MG 13
Flat w. CDM + growth index : growth plane Rapetti et al 12 For General Relativity ~0. 55 all cl+gal cl+cmb cmb+gal cl+cmb+gal July 5, 2012 Magenta: clusters+galaxies Purple: clusters+CMB Turquoise: CMB+galaxies Gold: clusters+CMB+galaxies Platinum: clusters+CMB+galaxies+BAO (Reid et al 12; Percival et al 10)+SNIa (Suzuki et al 12) +SH 0 ES (Riess et al 11) Stockholm, MG 13
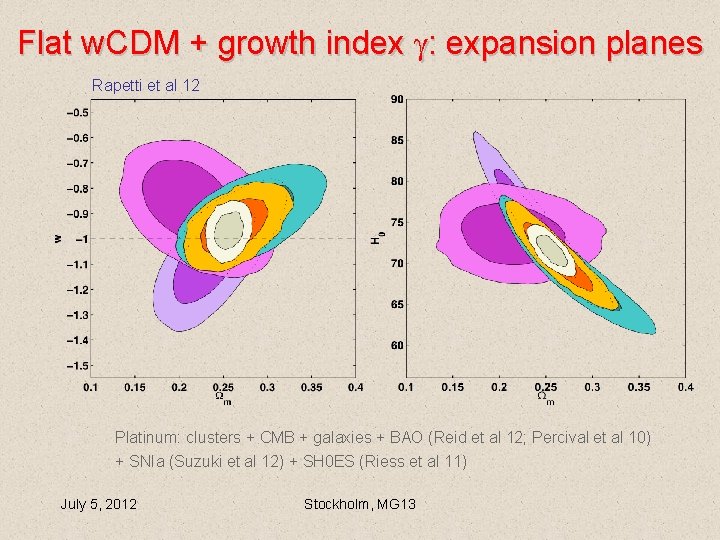
Flat w. CDM + growth index : expansion planes Rapetti et al 12 Platinum: clusters + CMB + galaxies + BAO (Reid et al 12; Percival et al 10) + SNIa (Suzuki et al 12) + SH 0 ES (Riess et al 11) July 5, 2012 Stockholm, MG 13
Flat w. CDM + growth index : growth+expansion Rapetti et al 12 cl+cmb+gal cl+cmb July 5, 2012 For General Relativity ~0. 55 cmb+gal Magenta: clusters+galaxies Purple: clusters+CMB Turquoise: CMB+galaxies Gold: clusters+CMB+galaxies cl+gal Stockholm, MG 13
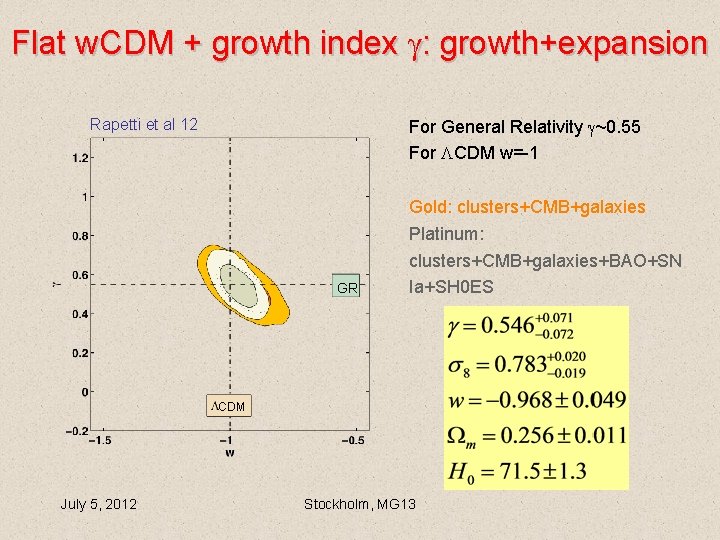
Flat w. CDM + growth index : growth+expansion For General Relativity ~0. 55 For CDM w=-1 Rapetti et al 12 GR Gold: clusters+CMB+galaxies Platinum: clusters+CMB+galaxies+BAO+SN Ia+SH 0 ES CDM July 5, 2012 Stockholm, MG 13
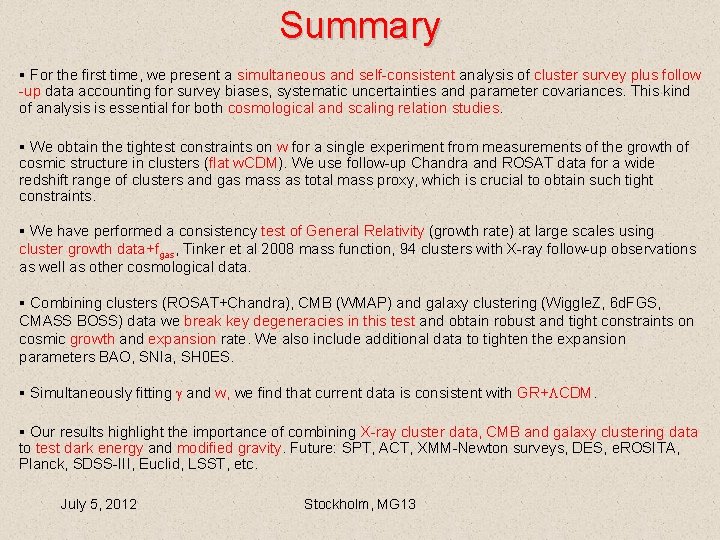
Summary § For the first time, we present a simultaneous and self-consistent analysis of cluster survey plus follow -up data accounting for survey biases, systematic uncertainties and parameter covariances. This kind of analysis is essential for both cosmological and scaling relation studies. § We obtain the tightest constraints on w for a single experiment from measurements of the growth of cosmic structure in clusters (flat w. CDM). We use follow-up Chandra and ROSAT data for a wide redshift range of clusters and gas mass as total mass proxy, which is crucial to obtain such tight constraints. § We have performed a consistency test of General Relativity (growth rate) at large scales using cluster growth data+fgas, Tinker et al 2008 mass function, 94 clusters with X-ray follow-up observations as well as other cosmological data. § Combining clusters (ROSAT+Chandra), CMB (WMAP) and galaxy clustering (Wiggle. Z, 6 d. FGS, CMASS BOSS) data we break key degeneracies in this test and obtain robust and tight constraints on cosmic growth and expansion rate. We also include additional data to tighten the expansion parameters BAO, SNIa, SH 0 ES. § Simultaneously fitting and w, we find that current data is consistent with GR+ CDM. § Our results highlight the importance of combining X-ray cluster data, CMB and galaxy clustering data to test dark energy and modified gravity. Future: SPT, ACT, XMM-Newton surveys, DES, e. ROSITA, Planck, SDSS-III, Euclid, LSST, etc. July 5, 2012 Stockholm, MG 13