Succession Energy and Matter Ecological Succession Ecological succession


- Slides: 26

Succession, Energy, and Matter

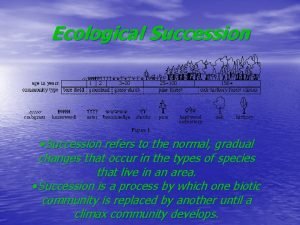
Ecological Succession Ecological succession is the sequence of community and ecosystem changes after a disturbance Primary succession occurs where no soil exists when succession begins Secondary succession begins in an area where soil remains after a disturbance

Early-arriving species and later-arriving species may be linked in one of three processes: Early arrivals may facilitate appearance of later species by making the environment favorable They may inhibit establishment of later species They may tolerate later species but have no impact on their establishment

Retreating glaciers provide a valuable field-research opportunity for observing succession Succession on the moraines in Glacier Bay, Alaska, follows a predictable pattern of change in vegetation and soil characteristics

Fig. 54 -22 -4 1941 1907 2 1 Pioneer stage, with fireweed dominant 0 1860 Dryas stage 5 10 15 Kilometers Glacier Bay Alaska 1760 4 Spruce stage 3 Alder stage

Ecological Succession The first organisms to inhabit an area undergoing succession are known as pioneer organisms These are usually small organisms (bacteria, lichens, algae, etc. ) The ecosystem goes through a number of stages, with each new stage usually consisting of larger organisms than the last one Once a community has become stable and is not changing much, it is known as a climax community

Causes of Ecological Succession There are 3 major causes of ecological succession: 1. Human Activities - logging, mining, development, etc. 2. Natural Disasters/Disturbances - fires, volcanic eruptions, etc. 3. Natural Competition Among Species - Fictitious example: - turtles and frogs both eat crickets - frogs are faster, turtles are slower - frogs eat more crickets, turtles starve - turtle population dies out, frog population gets bigger

Energy, Mass, and Trophic Levels Autotrophs build molecules themselves using photosynthesis or chemosynthesis as an energy source; heterotrophs depend on the biosynthetic output of other organisms Energy and nutrients pass from primary producers (autotrophs) to primary consumers (herbivores) to secondary consumers (carnivores) to tertiary consumers (carnivores that feed on other carnivores)

Fig. 55 -4 Tertiary consumers Microorganisms and other detritivores Detritus Secondary consumers Primary producers Heat Key Chemical cycling Energy flow Sun

Fig. 55 -9 Plant material eaten by caterpillar 200 J 67 J Feces 100 J 33 J Growth (new biomass) Cellular respiration

Trophic Efficiency and Ecological Pyramids Trophic efficiency is the percentage of production transferred from one trophic level to the next It usually ranges from 5% to 20% Trophic efficiency is multiplied over the length of a food chain

Approximately 0. 1% of chemical energy fixed by photosynthesis reaches a tertiary consumer A pyramid of net production represents the loss of energy with each transfer in a food chain

Fig. 55 -10 Tertiary consumers Secondary consumers 10 J 100 J Primary consumers 1, 000 J Primary producers 10, 000 J 1, 000 J of sunlight

In a biomass pyramid, each tier represents the dry weight of all organisms in one trophic level Most biomass pyramids show a sharp decrease at successively higher trophic levels

Fig. 55 -11 Trophic level Dry mass (g/m 2) Tertiary consumers Secondary consumers Primary producers 1. 5 11 37 809 (a) Most ecosystems (data from a Florida bog) Trophic level Dry mass (g/m 2) Primary consumers (zooplankton) Primary producers (phytoplankton) (b) Some aquatic ecosystems (data from the English Channel) 21 4

Dynamics of energy flow in ecosystems have important implications for the human population Eating meat is a relatively inefficient way of tapping photosynthetic production Worldwide agriculture could feed many more people if humans ate only plant material

Concept 55. 4: Biological and geochemical processes cycle nutrients between organic and inorganic parts of an ecosystem Life depends on recycling chemical elements Nutrient circuits in ecosystems involve biotic and abiotic components and are often called biogeochemical cycles

Fig. 55 -14 a Solar energy Transport over land Net movement of water vapor by wind Precipitation over ocean Evaporation from ocean Precipitation over land Evapotranspiration from land Runoff and groundwater Percolation through soil

Fig. 55 -14 b CO 2 in atmosphere Photosynthesis Burning of fossil fuels and wood Cellular respiration Phytoplankton Primary consumers Carbon compounds in water Detritus Decomposition Higher-level consumers

Fig. 55 -14 c N 2 in atmosphere Assimilation Nitrogen-fixing bacteria NO 3– Decomposers Ammonification NH 3 Nitrogen-fixing soil bacteria Nitrification NO 2– NH 4+ Nitrifying bacteria Denitrifying bacteria Nitrifying bacteria

Fig. 55 -14 d Precipitation Geologic uplift Weathering of rocks Runoff Consumption Decomposition Plankton Dissolved PO 43– Uptake Sedimentation Leaching Soil Plant uptake of PO 43–

Fig. 55 -16 (a) Concrete dam and weir Nitrate concentration in runoff (mg/L) (b) Clear-cut watershed 80 60 40 20 4 3 2 1 0 Deforested Completion of tree cutting 1965 Control 1966 (c) Nitrogen in runoff from watersheds 1967 1968

Contamination of Aquatic Ecosystems Critical load for a nutrient is the amount that plants can absorb without damaging the ecosystem When excess nutrients are added to an ecosystem, the critical load is exceeded Remaining nutrients can contaminate groundwater as well as freshwater and marine ecosystems Sewage runoff causes cultural eutrophication, excessive algal growth that can greatly harm freshwater ecosystems

Fig. 55 -18 Winter Summer

Toxins in the Environment Humans release many toxic chemicals, including synthetics previously unknown to nature In some cases, harmful substances persist for long periods in an ecosystem One reason toxins are harmful is that they become more concentrated in successive trophic levels Biological magnification concentrates toxins at higher trophic levels, where biomass is lower

Fig. 55 -20 Concentration of PCBs Herring gull eggs 124 ppm Lake trout 4. 83 ppm Smelt 1. 04 ppm Zooplankton 0. 123 ppm Phytoplankton 0. 025 ppm
 Ecological succession succession of a pond
 Ecological succession succession of a pond
 Energy naturally flows from warmer matter to cooler matter.
 Def of primary succession
 Ecological succession concept map
 Succession venn diagram
 Dune climax
 What are the objectives of ecosystem
 Ecological succession
 Ecological succession two types
 Progressive succession:
 Ecological succession
 Primary ecological succession
 Youtube ecological succession
 Def of secondary succession
 Eutrophication comic strip
 Ecological succession
 Primary succession examples
 Types of succession
 Types of succession
 How do ecosystems change naturally
 Ecological succession
 Climax community
 Secondary successio
 What is a climax species
 Secondary succession ________.
 Grey matter


