Recap Ecological Succession concepts type of succession Mechanisms


 17. 1 Variation in the relative abundance of species influences concepts")


/ln(N) S")


 Number of")
 Based on the species presence or")


 model n n Similar to density-dependent regulation of population size Births –")


- Slides: 73
Recap: Ecological Succession concepts, type of succession Mechanisms of succession Climax community
16. 3 Succession becomes self-limiting as it approaches the climax Succession continues until the addition of new species to the sere and the exclusion of established species no longer change the environment of the developing community. The progression from small to large growth form modifies the conditions of light, temperature, moisture and soil nutrients. Conditions change slowly after the vegetations achieves the largest growth form that the environment can support. Final dimensions of a climax community are limited by climate independently of events during succession.
Succession becomes self-limiting as it approaches the climax Time required for succession from a new or disturbed habitat to a climax community depends on nature of climax and initial quality of habitat Mature oak-hickory climax forest from old field in North Carolina: 150 yrs Climax stage of grasslands in western North America: 20 -40 years Humid tropics, reach climax within 100 years from clear cut, but may take a few more centuries to achieves a fully mature structure and species composition. Sand dune beech-maple climax, up to 1, 000 years Climax is an elusive concept: Communities also change in response to climate change, hunting, fire, and logging, disappearance of keystone consumers (wolf, passenger pigeon) and trees (chestnuts, eastern hemlock)
Climax communities under extreme environmental conditions Fire is an important feature of many climax communities, favoring fire-resistant species and excluding species that would otherwise dominate. Longleaf pine after a fire Seedling may be badly burned, but the growing shoot is protected by the long, dense needles.
Grazing pressure also modify a climax community Grassland can be turned into shrubland by intense grazing Herbivivores may kill or severely damage perennial grasses and allow shrubs and cacti that are unsuitable forage to invade. Selective grazing Some species prefer to feed on areas previously grazed by others. Both zebras and Thompson’s gazelles feed on Serengeti ecosystem of east Africa, but eating different plants. In North America, cattle grazing may lead to invasion by alien cheatgrass, which promote fire.
Transient and cyclic climaxes Succession is a series of changes leading to a stable climax, whose character is determined by local environment. Once established, a beech-maple forest perpetuates itself, and its general appearance changes little despite constant replacement of individuals within the community. Transient climaxes: such as communities in seasonal ponds – small bodies of water that either dry up in summer, or freeze solid in winter. The extreme seasonal changes regularly destroy the communities that become established in the ponds each year. On African savannas, carcasses of large mammals are devoured by a succession of vultures including: large, aggressive species smaller species that glen smaller bits of meat from bone species that cracks open bone to feed on marrow.
Cyclic climax: Suppose, for example, species A can only germinate under species B, B only under C, and C only under A. The relationships create a regular cycle of species dominance in the order of A, C, B, A, …, in which the length of each stage is determined by the life span of the dominant species. Cyclic succession is usually driven by stressful environmental conditions.
When high winds damage heaths and other types of vegetation in northern Scotland, shredded foliage and broken twigs create openings for further damage, and soon a wide swath is opened in the vegetation. Regeneration occurs on the protected side of damaged area while wind damage further encroaches on exposed vegetation. Temporal: wind damage and regenerate, cycling Spatial: mosaic patches
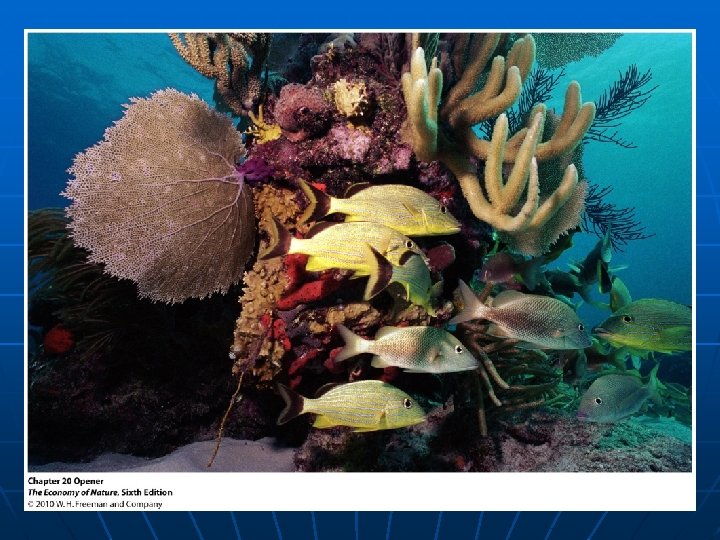
BIOL 4120: Principles of Ecology Lecture 17: Biodiversity Dafeng Hui Office: Harned Hall 320 Phone: 963 -5777 Email: dhui@tnstate. edu
Species richness varies over the surface of the earth Why so may species in tropics and few toward the poles? 1 hectare of forest Boreal: <5 Temperate : 10 -30 Tropical: 100 -300
Outline (Chapter 20) 17. 1 Variation in the relative abundance of species influences concepts of biodiversity 17. 2 The number of species increase with the area sampled 17. 3 Large-scale patterns of diversity reflect latitude, environmental heterogeneity, and productivity 17. 4 Diversity has both regional and local components 17. 5 Diversity can be understood in terms of niche relationships 17. 6 Equilibrium theories of diversity balance factors that add and remove species 17. 7 Explanations for high tree species richness in the tropics focus on forest dynamics
17. 1 Variation in the relative abundance of species influences concepts of biodiversity Biodiversity: variation among organisms and ecological systems at all levels, including genetic variation within populations, morphological and functional differences between species, and variation in biome structure and ecosystem process in both terrestrial and aquatic systems. Indices of biodiversity 1. Species richness: number of species that occur within the community (simple and most general one). 2. Relative abundance: counting all individuals of each species in a number of sample plots within a community and determining what percentage each contributes to the total number of individual of all species. Can also be quantified by density, or biomass of individuals within a sample area, by the frequency of sample plots in which a specific species is recorded, or by the cover (proportion of the area of habitat covered by a species)
24 species, 256 trees
10 species Compared to 1 st forest stand, this stand has less species. Also, two species make up 83. 5% of the total tree density.
Species diversity Graphical display of attributes of community structure 1. Rank-abundance diagram: graphical way to show relative abundance 2. Species evenness: equitable distribution of individuals among species Gradual slope in the rank-abundance diagram Length shows species richness, slope shows species eveness.
Rank-abundance plot Birds in a deciduous forest in W. Virginia; vascular plants in a subalpine fir forest in Great Smoky Mountains, TN; and vascular plants in a deciduous cove forest in Great Smoky Mountains. Abundance is represented by number of species for birds and by NPP for plants (Whittaker 1975).
Species diversity Diversity indexes: an index considering only species richness Margalef’s index D=(S-1)/ln(N) S is species richness, N is sample size Menhinick’s index D=S/Sqrt(N) Both indexes normalize species richness in relation to the size of the sample.
Simpson’s Species diversity Diversity indexes: an index considering both the number and relative abundance of species within the community. Simpson’s index (D): three definitions Definition: Where ni is the number of individuals in species i; n is the total number of individuals of all species D measures the probability that two individuals randomly selected from a sample will belong to the same species Range of D: 0 to 1 (1 is no diversity)
Species diversity Simpson’s index of diversity=1 -D Simpson’s reciprocal index =1/D also called Simpson’s diversity index Calculate Simpson’s Index using Tables 16. 1 and 16. 2 Stand 1: D=0. 13 , index of diversity 0. 87, diversity index 7. 7 Stand 2: D=0. 36 0. 64 2. 8
Shannon's diversity index introduced by Claude Shannon: pi is the fraction of individuals belonging to the i-th species, relative abundance. The most widely used
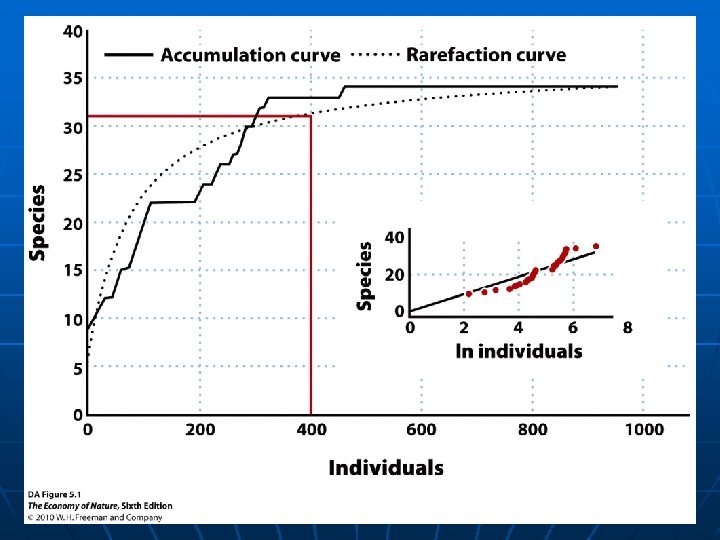
17. 2 The number of species increases with the area sampled Species-area relationship Olaf Arrhenius, 1921 S=c. A^z Power function log (S) = log(c) + z log (A) Z=0. 20 -0. 35 The number of species increase with the area sampled More species are found within large areas than within small areas.
The slope of S-A relationship is influenced by different processes on different scales Three grasslands in North Carolina, USA, the Netherlands, and Sweden Small sample: 10 cm 2 Specie richness increase with sample size over small areas. S-As are nearly superimposable.
Species richness-area relationships on islands The fourth process: extinction Slope of S-A is higher when islands of different sizes are compared than it is across continental areas over a comparable size range. 1. The range of endemic island species (a species found only on that island nowhere else) can be no larger than the island, but the range of continental species generally exceeds the particular sampling area. 2. Dispersal in island is limited and easily to go extinction, thus smaller and larger areas within continents have more similar complements of species than do smaller and larger islands, and the slope of S-A is consequently lower. 3. Habitat diversity also influence S-A relationship: Large island has more diverse habitats
Recap: Biodiversity Concept Components of biodiversity Species richness and relative abundance Different species diversity indices Margalef’s index Menhinick’s index Simpson’s indices Species and area (S-A) relationship
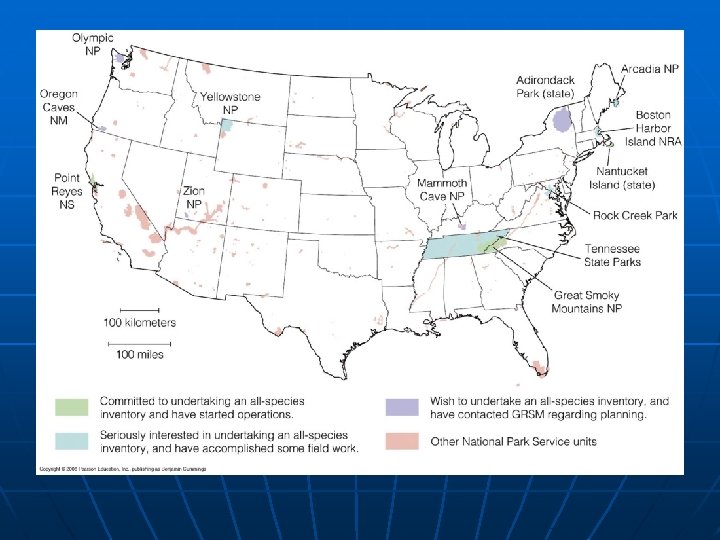
17. 3 Large-scale patterns of diversity reflect latitude, environmental heterogeneity, and productivity Species richness increases from north to south in the Northern Hemisphere Mammal species richness increases toward the equator and in regions of high habitat diversity Numbers are species richness in sample blocks 150 miles on a side Simpson 1964. Land birds show similar pattern, but trees and reptiles, and amphibians present strikingly different patterns.
Land birds show similar pattern, but trees and reptiles, and amphibians present strikingly different patterns.
Ecological heterogeneity and habitat productivity Diversity is higher in structurally complex habitats. Among several habitats in temperate regions, the average of bird species tends to increase with habitat productivity (Whittaker 1975)
Vegetation structure may be more important than productivity in determining diversity Sonoran Desert, CA and salt marsh, MI Very productive, but structure simple salt marsh has fewer plant species than the desert.
Bird species diversity is correlated with foliage height diversity Robert and John Mac. Arthus, 1981 13 communities in northeastern US Deciduous forest, old fields, and regenerating forest habitats in eastern North America
Solar energy input and precipitation Two factors predict species richness well: Energy input from the sun and water input from precipitation Brad Hawkins, UC Irvine, 2003 Published data Bars indicate number of studies show significant influences Precipitation is more important in tropics and south-temperate regions
Species richness is correlated with energy input into the environment PET: potential evapotranspiration, amount of water that could be evaporated from the soil and transpired by plants, given the average T and humidity. The relationship leads to energy-diversity hypothesis Large amount of energy in an ecosystem can be shared by a large number of species. Great input also support higher productivity, support large population size, reduce extinction. High energy increase rate of speciation.
17. 5 Diversity has both regional and local components Local diversity (alpha) Number of species in a small area of homogeneous habitat Regional diversity ( gamma) Total number of species observed in all habitats within a geographic area that includes no significant barriers to the dispersal of organisms. Gamma diversity=alpha (each habit has all) or sum of alpha diversity (no overlap of species) Beta diversity: difference (or turn over) in species from one habitat to another.
Beta diversity Sorensen’s similarity (or coefficient of community) Based on the species presence or absence An Example: s 1=24, s 2=10, c=9; CC=2*9/(24+10)= 0. 529 CC ranges from 0 to 1, (Jaccard Similarity J= C/(C+U 1+U 2)
Change of beta diversity Rate of similarity decreases with the distance between two samples Beta diversity is high in Asia with respect to both latitude and longitude. Regional diversity in also higher in Asia. State level flora species
Beta diversity of plants decrease from south to north in North America Beta diversity decreases from south to north in North America Whittaker’s beta diversity index: beta=S_total/mean(alpha) S_total: regional species richness; alpha is alpha diversity: r=alpha_bar*beta.
Local communities and regional species pool Species pool: species occur within a region. Whether a species occurs in a local community depends both on its adaptations to local conditions and on its interactions with other species Species sorting: Species present within the regional species pool are sorted into different communities based on their adaptations and interactions.
Species sorting 8 5 12
Local communities and regional species pool Mark Bertness, Brown 2006 Species pool: mussels, algae species Species sorting: exposed area, mussels; protected area, algae or mussels.
Species interactions and ecological release Competitive interactions between species also play an important role in species sorting Species sorting should be greatest where the regional pool contains the most species. In such a situation, each species should be able to maintain itself over only a narrow range of habitats – those to which it is best adapted – and beta diversity should be high.
Species interactions and ecological release Island neighboring continental regions. Comparing species richness among regions with similar climate and range of habitats, but different degrees of geographic isolation. Island usually have few species than comparable mainland areas, but island species often attain greater densities than their mainland counterparts. In addition, they expand into habitats that would be filled by other species on the mainland: Collectively, these phenomena are referred to as ecological release.
Example of bird communities in two continental regions and five islands of various sizes within the Caribbean basin Panama: a large region with a large species pool St. Kitts: a small region with a small species pool When few species occur, each is likely to be more abundant and to live in more habitats Thus, as the size of regional species pool decrease, the realized niche of each species becomes broader.
17. 4 Diversity can be understood in terms of niche relationships n n n Fundamental niche Boundaries of a particular species’s niche might extend between T of 10 o. C and 30 o. C, prey sizes of 4 and 12 mm, perches on branches with diameters between 5 and 20 cm, or day-time light levels between 10 and 50 W m-2 Niche overlap means competition Niche relationships of species provide informative measure of community structure Three factors: total community niche space, niche overlap among species, and niche breadth of individual species
Competition, diversity and niche n n Variation in local specie richness represent difference in total niche space In a particular location with a fixed volume of total niche space, species can be added only by increasing niche overlap (sharing of niche space) or by decreasing niche breadth (partitioning total niche space more finely).
Competition, diversity and niche n n Intensive competition species exclusion High diversity is associated with weaker competition between species Mechanisms: competitors have to either avoid competition through ecological specialization or be limited by predators rather than by resources High species richness in tropics results at least in part from the presence of a great variety of ecological resources n More fruit eating bird species, nectar-feeding, and insectivorous species n More mammals (bat) feed on fruit, nectar and night-flying insects (non-flying mammal species are similar to temperate) n Herbivorous insects diversified to take advantage of immense variety of plant species
Species diversity and niche diversity n Species diversity is paralleled by the functional diversity or niche diversity of the species in a community Niche breadths /species are the same: Morphological analyses have revealed that number of species packed into a certain amount of morphologically defined niche space is relatively constant – average niche breadth remains the same in communities with different number of species. Therefore, as species diversity increases, so does the niche diversity.
Bat’s communities in temperate and tropical localities Morphological space: two axes, ratio of ear-forearm and ratio of digit length First: relate to type of prey can locate Second: flies ability to purse and capture prey Ontario, Canada and Cameroon, West Africa A tropical bat fauna occupies more morphologically defined niche space than a temperate bat fauna
Fish exhibit more ecological roles in more diverse communities Fish are sampled at four locations, Mexico From headwater spring to a downstream community at river mouth
Recap Diversity patterns Latitude, habitat heterogeneity, productivity Local and regional diversity, beta diversity Species interaction and ecological release Species pool and species sorting Species diversity and niche diversity
17. 5 Equilibrium theories of diversity balance factors that add and remove species n Diversity patters: n At global scale, species richness increases from high latitude toward equator n Within latitude belts, diversity appears to be correlated with temperature, productivity, topographic heterogeneity within a region and structure complexity of local habitats n Isolated islands exhibit species impoverishment n High diversity is associated with greater ecological variety The ultimate source of diversity is speciation. Change in species diversity is determined by speciation and extinction.
Steady-state (equilibrium) model n n Similar to density-dependent regulation of population size Births – formation of new species or colonization by species from elsewhere Death – local extinction of species Carrying capacity – steady-state number of species
Species richness on islands Robert Mar. Arthur and E. O Wilson, 1960 s Equilibrium theory of island biogeography: The number of species on an island balances regional processes governing immigration against local processes governing extinction. A small offshore island The steady-state number of species is determined by the intersection of colonization and extinction curves Too small, only way to add species is from mainland. S: stead-state.
Smaller island support few species
Islands close to the mainland support more species because of higher immigration rates
Disturbance study by Simberloff and Wilson Red mangrove
Experiment by Daniel Simberloff and E. O. Wilson Disturbance influence species If some diseaster exterminated a part of an island’s biota or all of it, new colonists would, over time, restore diversity to its predisturbance equilibrium. Erecting metal scaffolds covered with plastic sheeting over entire red mangrove trees and resampled at regular intervals for a year.
Equilibrium theory in continental community At the continental scale, new species are added to the regional pool by evolutionary process of speciation as well as immigration from elsewhere (Mac. Arthur 1969)
17. 6 Explanations for high tree species richness in the tropics focus on forest dynamics Why are there so many different kinds of trees in the tropics? Plausible mechanisms include: n 1. Environmental heterogeneity n 2. Disturbance such as tree falls n 3. Herbivores and pathogens allow rare species to coexist n 4. Tree species are closely matched ecologically, competitive exclusion takes a long time, and the resulting rare species advantage allows many species to coexist (neutral theory) n
1. Environmental heterogeneity n n n Number of tree species varies in proportion to the heterogeneity of the environment Soil and climate Could great variation in the physical environment in the tropics account for the tenfold (or more) greater diversity of trees in tropical than in the temperate forest?
Environmental heterogeneity It seems unlikely, unless trees recognize much finer habitat differences in the tropics than they do in temperate regions, especially considering that temperate regions contain greater heterogeneity in some climatic factors.
2. Disturbance and gap dynamics n n n Joseph Connell, UC Santa Barbara and others High species richness of tropical rain forests is related to habitat diversity created by disturbance Disturbances open up space for colonization and initiates a cycle of succession by species adapted for colonizing disturbed sites. Intermediate disturbance hypothesis: specie richness is high when the intensity of disturbance is not too high or low. Death rate of trees due to disturbance showed no difference in temperature and tropic regions (0. 5 -2% died). It is doubt that gap formation could contribute to 10 fold difference in species richness.
3. Herbivore and pathogen pressure n n n Consumers reduce the competition and promote coexistence of many resource species (sea star example) Daniel Janzen, Uni. Penn suggests herbivory could be responsible for the high species richness in tropical forests. Herbivores feed on buds, seeds and seedling of abundant species and allow others to grow.
Herbivore and pathogen pressure n Several evidence support his “pest pressure” hypothesis n Monoculture may fail due to infestations of herbivores n Rubber plantation in Amazon grow poorly and in Malaysia (lack specialist herbivores, and grow well) n Prediction: seedlings should be less likely to become established close to adult of same species than at a distance from them (adults have herbivores)
Seedling survival varies with distance from the parent trees
Fungicide treatment improves survival in seedlings of a tropical tree Thomas Bell, Uni. Of Oxford 0. 24 m 2 plots Two treatments Applied fungicide and control Thinned half of plots to create low density
4. Random ecological drift Steve Hubbell: Neutral theory Under model of specieation, the equilibrium species richness in the metacommunity (regional diversity) would be S=Jm*nu Jm is the number of individuals in the metacommunity Nu is the rate of speciation expressed per individual.
THE End
Response of Stipa neomexicana plants Jessica Gurevitch University of New York at Stony Brook Stipa: C 3 perennial grass Semi-arid grassland in Arizona
Competition release n n Competitive release occurs when a species expands its niche in response to the removal of a competitor or when a species invades an island expands into unoccupied habitats Examples of competitive release • Response of Stipa neomexicana plants • Decline in baleen whales has allowed for an increase in other krill-dependent predators (penguins, seals)
Commercial whaling in Antarctic Ocean n n Baleen whales: 1 million a century ago eat Antarctic krill (4% of body weight) Now, less than 200, 000 Other krill-dependent predators such as seals and penguins have been found greatly increased in abundance Competition release due to the dramatic decrease in baleen whale population
Recap Diversity and sampling area S-A relationship, scales and island Diversity patterns Latitude, habitat heterogeneity, productivity Local and regional diversity, beta diversity Species interaction and ecological release Species pool and species sorting