Statistics for Experimental Verification MAE 106 04252018 In
- Slides: 11
Statistics for Experimental Verification MAE 106 – 04/25/2018
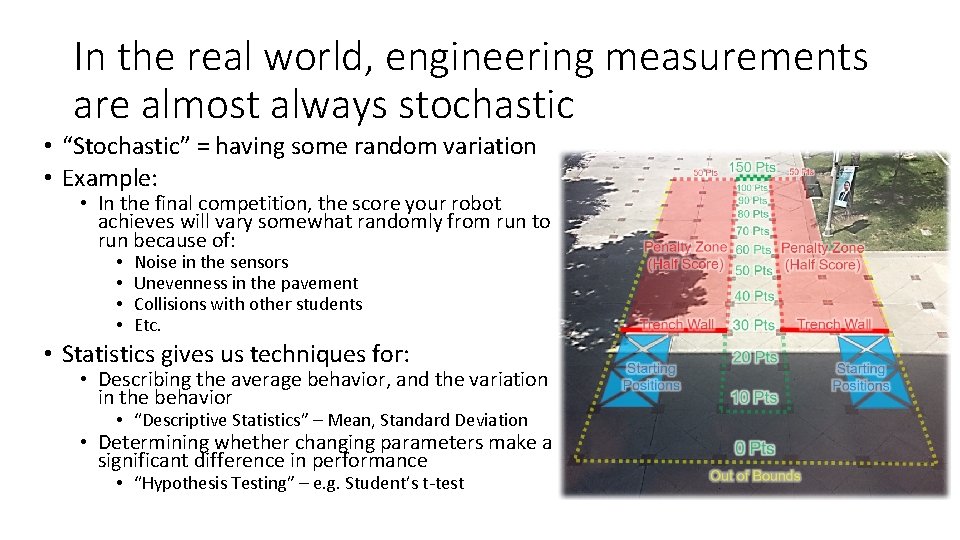
In the real world, engineering measurements are almost always stochastic • “Stochastic” = having some random variation • Example: • In the final competition, the score your robot achieves will vary somewhat randomly from run to run because of: • • Noise in the sensors Unevenness in the pavement Collisions with other students Etc. • Statistics gives us techniques for: • Describing the average behavior, and the variation in the behavior • “Descriptive Statistics” – Mean, Standard Deviation • Determining whether changing parameters make a significant difference in performance • “Hypothesis Testing” – e. g. Student’s t-test
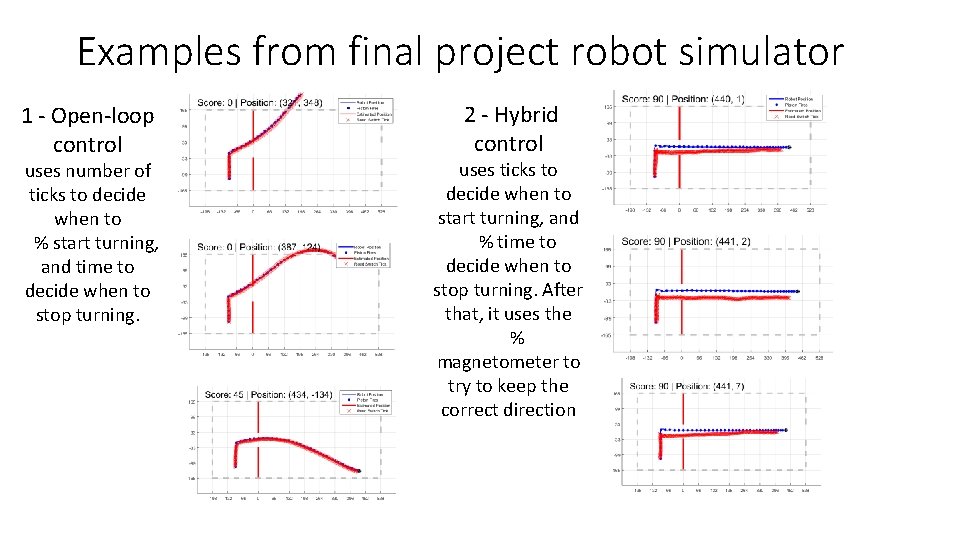
Examples from final project robot simulator 1 - Open-loop control uses number of ticks to decide when to % start turning, and time to decide when to stop turning. 2 - Hybrid control uses ticks to decide when to start turning, and % time to decide when to stop turning. After that, it uses the % magnetometer to try to keep the correct direction
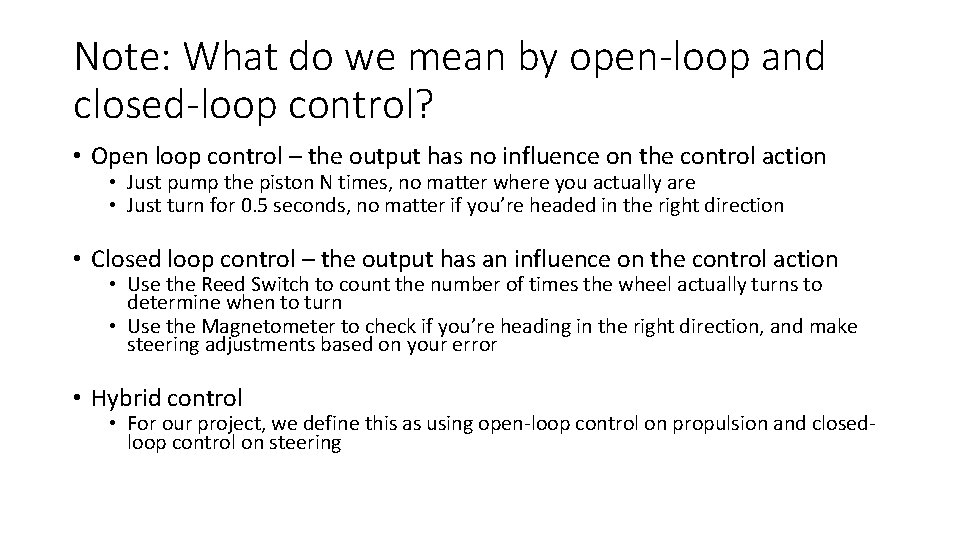
Note: What do we mean by open-loop and closed-loop control? • Open loop control – the output has no influence on the control action • Just pump the piston N times, no matter where you actually are • Just turn for 0. 5 seconds, no matter if you’re headed in the right direction • Closed loop control – the output has an influence on the control action • Use the Reed Switch to count the number of times the wheel actually turns to determine when to turn • Use the Magnetometer to check if you’re heading in the right direction, and make steering adjustments based on your error • Hybrid control • For our project, we define this as using open-loop control on propulsion and closedloop control on steering
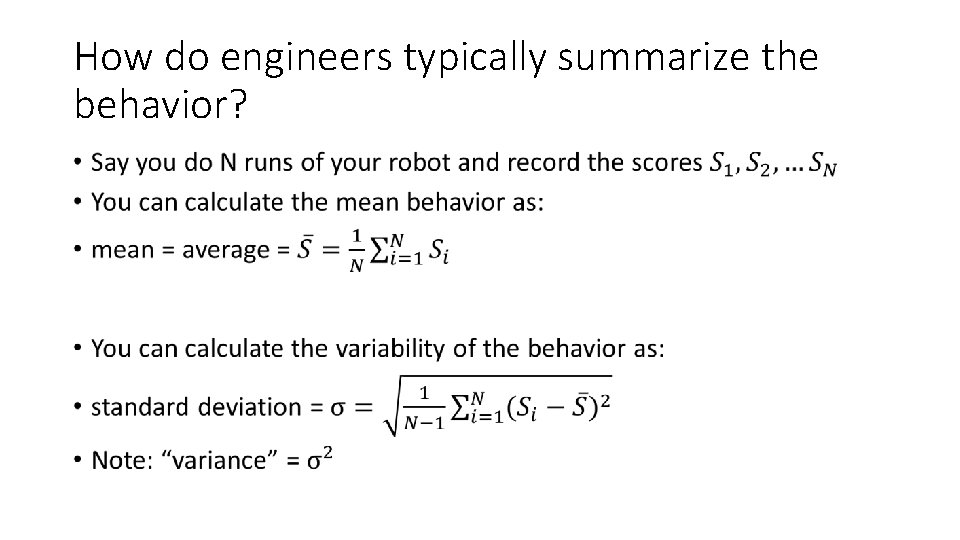
How do engineers typically summarize the behavior? •
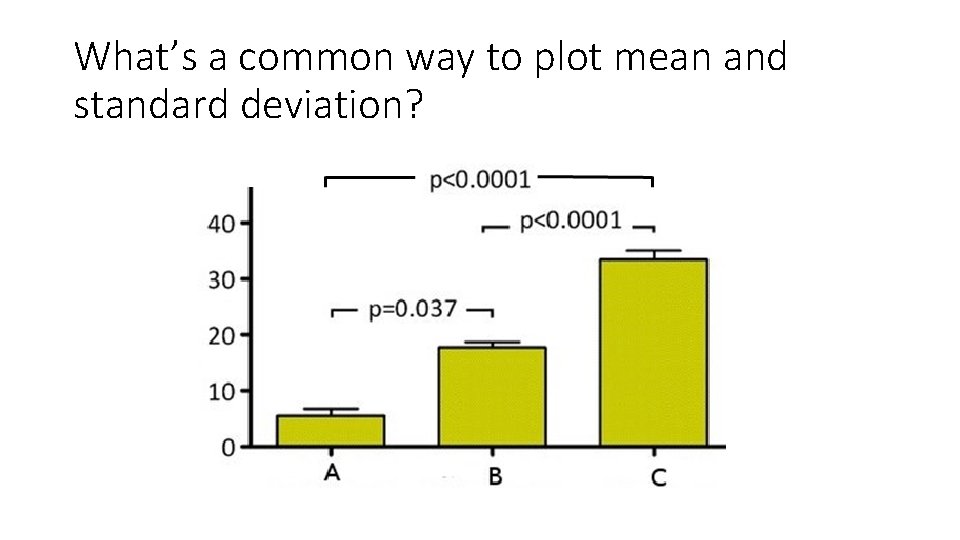
What’s a common way to plot mean and standard deviation?
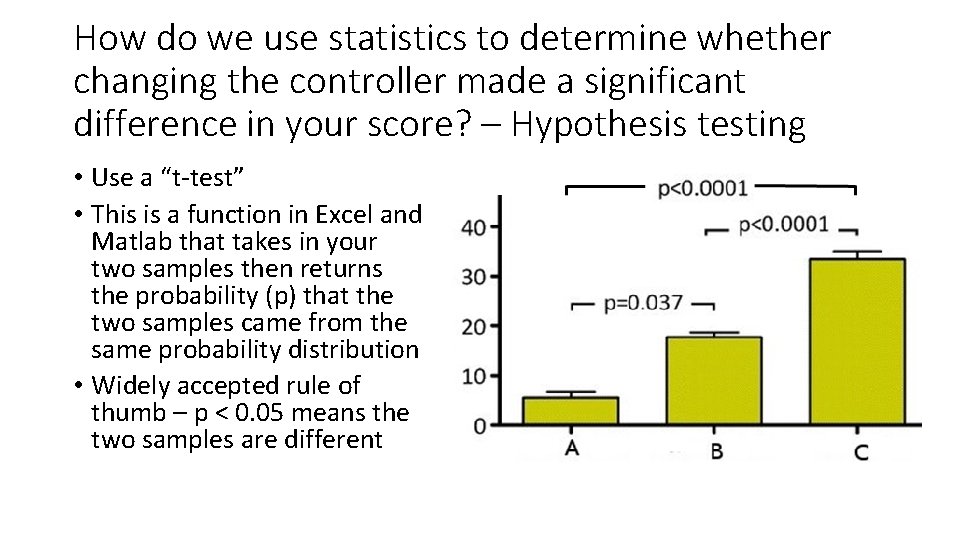
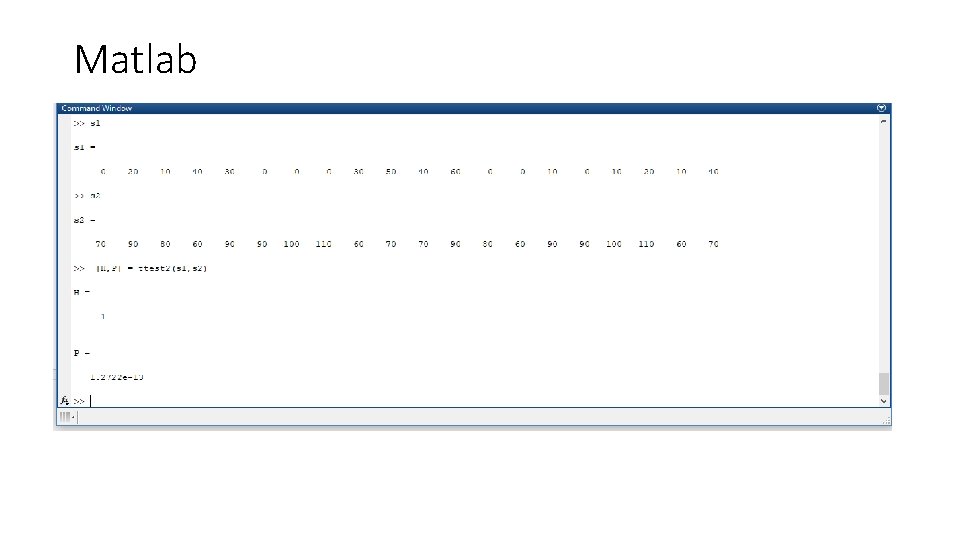
How do we use statistics to determine whether changing the controller made a significant difference in your score? – Hypothesis testing • Use a “t-test” • This is a function in Excel and Matlab that takes in your two samples then returns the probability (p) that the two samples came from the same probability distribution • Widely accepted rule of thumb – p < 0. 05 means the two samples are different
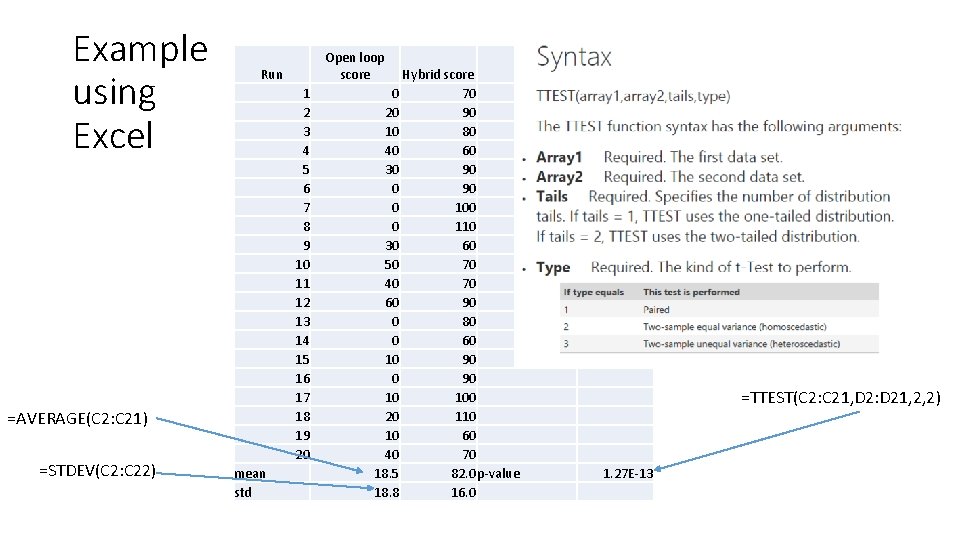
Example using Excel Run 1 2 3 4 5 6 7 8 9 10 11 12 13 14 15 16 17 18 19 20 =AVERAGE(C 2: C 21) =STDEV(C 2: C 22) Open loop score mean std Hybrid score 0 70 20 90 10 80 40 60 30 90 0 100 0 110 30 60 50 70 40 70 60 90 0 80 0 60 10 90 10 100 20 110 10 60 40 70 18. 5 82. 0 p-value 18. 8 16. 0 =TTEST(C 2: C 21, D 2: D 21, 2, 2) 1. 27 E-13
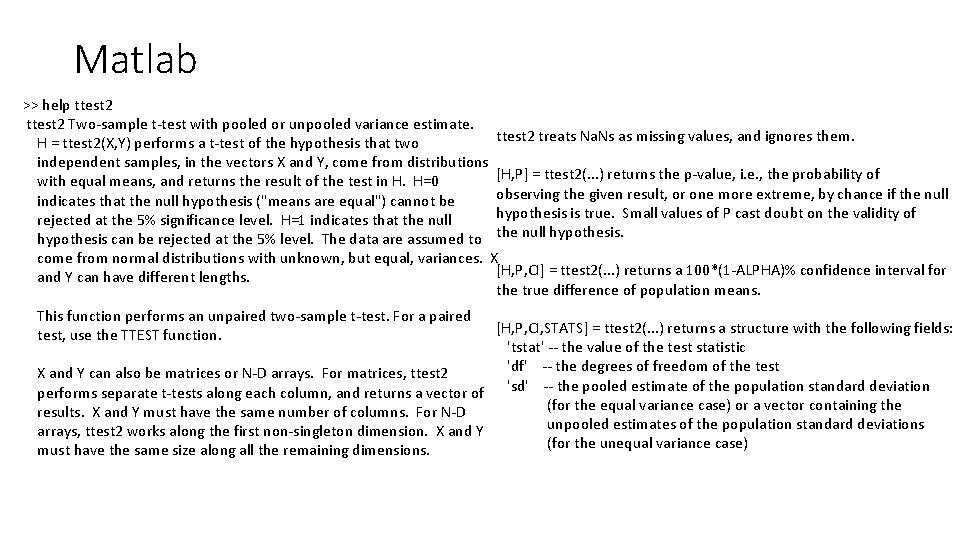
Matlab >> help ttest 2 Two-sample t-test with pooled or unpooled variance estimate. ttest 2 treats Na. Ns as missing values, and ignores them. H = ttest 2(X, Y) performs a t-test of the hypothesis that two independent samples, in the vectors X and Y, come from distributions [H, P] = ttest 2(. . . ) returns the p-value, i. e. , the probability of with equal means, and returns the result of the test in H. H=0 observing the given result, or one more extreme, by chance if the null indicates that the null hypothesis ("means are equal") cannot be hypothesis is true. Small values of P cast doubt on the validity of rejected at the 5% significance level. H=1 indicates that the null hypothesis can be rejected at the 5% level. The data are assumed to the null hypothesis. come from normal distributions with unknown, but equal, variances. X [H, P, CI] = ttest 2(. . . ) returns a 100*(1 -ALPHA)% confidence interval for and Y can have different lengths. the true difference of population means. This function performs an unpaired two-sample t-test. For a paired [H, P, CI, STATS] = ttest 2(. . . ) returns a structure with the following fields: test, use the TTEST function. 'tstat' -- the value of the test statistic 'df' -- the degrees of freedom of the test X and Y can also be matrices or N-D arrays. For matrices, ttest 2 performs separate t-tests along each column, and returns a vector of 'sd' -- the pooled estimate of the population standard deviation results. X and Y must have the same number of columns. For N-D (for the equal variance case) or a vector containing the arrays, ttest 2 works along the first non-singleton dimension. X and Y unpooled estimates of the population standard deviations (for the unequal variance case) must have the same size along all the remaining dimensions.
Matlab
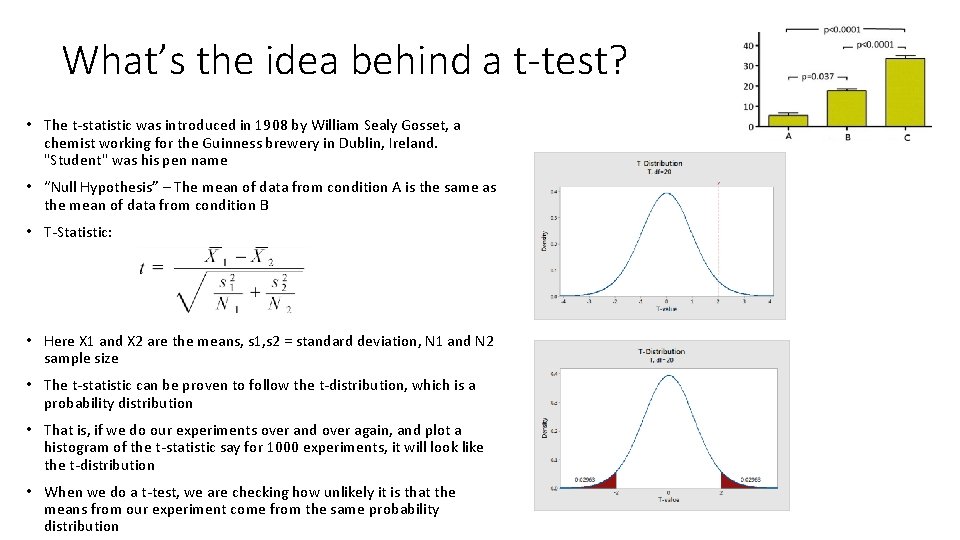
What’s the idea behind a t-test? • The t-statistic was introduced in 1908 by William Sealy Gosset, a chemist working for the Guinness brewery in Dublin, Ireland. "Student" was his pen name • “Null Hypothesis” – The mean of data from condition A is the same as the mean of data from condition B • T-Statistic: • Here X 1 and X 2 are the means, s 1, s 2 = standard deviation, N 1 and N 2 sample size • The t-statistic can be proven to follow the t-distribution, which is a probability distribution • That is, if we do our experiments over and over again, and plot a histogram of the t-statistic say for 1000 experiments, it will look like the t-distribution • When we do a t-test, we are checking how unlikely it is that the means from our experiment come from the same probability distribution