SPECTROPHOTOMETRY Prof Dr Nevin ERK Spectrophotometry particulary in


, which is defined as:")


- Slides: 10
SPECTROPHOTOMETRY Prof. Dr. Nevin ERK
Spectrophotometry , particulary in the visible region of the electromagnetic spectrum , is one of the most widely used methods of analysis. It is very widely used in clinical chemistry and environmental laboratories because very substances can be selectively converted to a colored derivative. The instrumentation is readly available an generally fairly easy to operate.
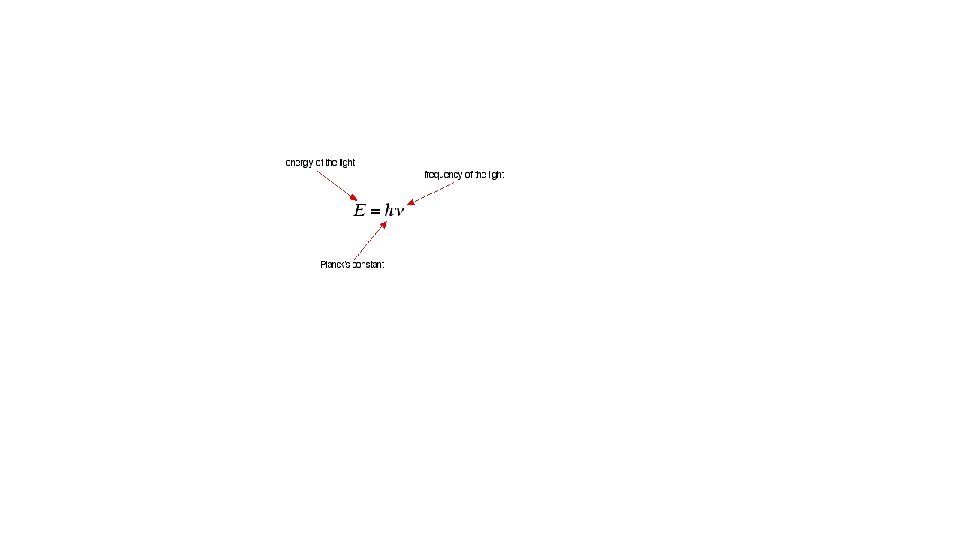
The wave is described either in terms of its wavelength, the distance of one complete cycle , or in terms of the frequency , the number of cycles passing a fixed point per unit time. The reciprocal of the wavelength is called the wavenumber. The relation between the wavelength and frequency is
Spectral changes can be classed as follows : 1. Bathochromic shift : absorption maximum shifted to longer wavelength. 2. Hipsochromic shift : absorption maximum shifted to longer wavelength. 3. Hyperchromism effect : an increase in molar absorptivity 4. Hypochromism effect : a descrease in molar absorptivity
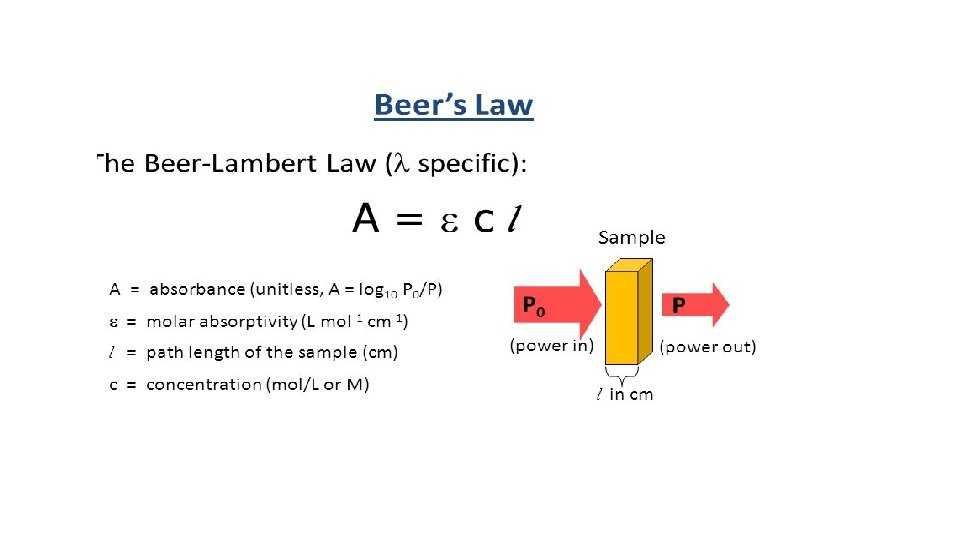
Experimental measurements are usually made in terms of transmittance (T), which is defined as: T = I / Io where I is the light intensity after it passes through the sample and Io is the initial light intensity. The relation between A and T is: A = -log T = - log (I / Io).
Example 1. A sample in a 1 cm cell is determined with a spectrometer to transmit 80% light at a certain wavelength. If the absorptivity of this substance at this wavelength in 2. 0 , what is the concentration of the substance? A=-log T 0. 500= -log T T = 31. 6 %
Single Beam Systems The light source comprising of a hollow cathode lamp emits sharp atomic line of the element whose determination is required. The light is modulated (switched on and off) rapidly by means of a rotating chopper located between the light source and the flame. Modulation can also be achieved by pulsing the power (switched on and off rapidly) to the light source. Modulation serves to differentiate the light coming from the source lamp from the emission from the flame. The modulated light is led to the flame where ground state atoms of the element of interest are present and after absorption is led to the monochromator which isolates the wavelength of interest which is then led to the detector.
Double Beam Systems The light beam from the source is split into sample beam and reference beam by the mechanical chopper. The reference beam monitors the lamp energy whereas the sample beam reflects sample absorption. The observed absorbance measurement is the ratio of the sample and reference beams which are recombined before moving to the monochromator. This arrangement compensates the effects due to drift in lamp intensity, electronic and mechanical fluctuations which affect both the sample and reference beams equally.