Sixth Power Plan Setting Conservation Targets and Implementation


- Slides: 27
Sixth Power Plan Setting Conservation Targets and Implementation Strategies Jill Steiner, Snohomish Public Utility District Northwest Power and Conservation Council Conservation Resource Advisory Committee June 19, 2009
Conservation Philosophy 2 § Public power utilities are committed to acquiring all cost-effective energy efficiency for the benefit of the region and our customers § Increasing marginal costs (Tier 2 pricing) and State requirements (e. g. , I-937) provide strong incentive to pursue energy efficiency § Many utilities are increasing internal savings targets and expanding delivery capabilities Driven by resource preference and anticipation of higher targets Gaining better understanding of the Council supply curves part of that process
Target Concerns 3 § Total economic potential, screening at $60/MWh for discretionary resources and $100/MWh, falls short of the recommended 5 year target § Historical achievements may not be fully indicative of our short-term ability to deliver a different and complex mix of measures § There is uncertainty around technical availability, performance, market acceptance and effective program approach and deployment for some of the measures in the supply curves § In addition to aggressive acquisition over the next five years, the region needs to prepare for sustained savings over the 20 -year planning horizon
Target Assessment 4 § Targets need to be aggressive, but achievable Targets provide a minimum threshold for performance Utilities and others have demonstrated willingness to exceed targets when conservation resources are available § Three methods used to assess achievability of targets Measure-by-measure ramp rate review Uncertainty analysis Margin of error
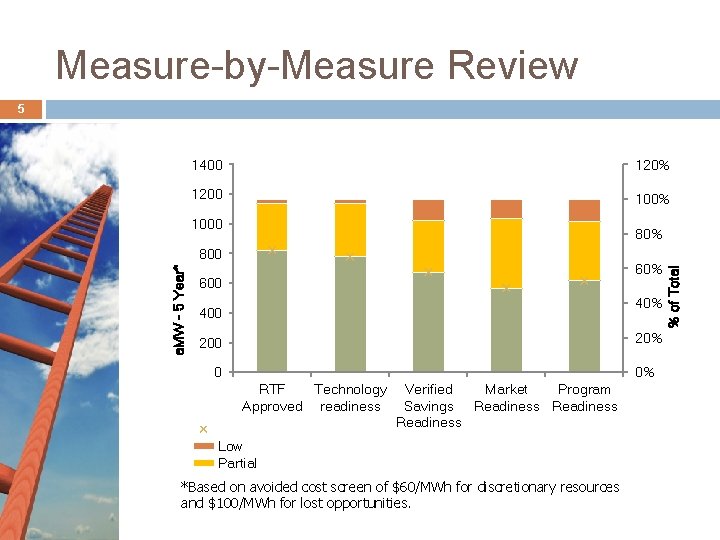
Measure-by-Measure Review 5 1400 120% 1200 100% 1000 a. MW - 5 Year* 800 60% 600 40% 400 20% 200 0 0% RTF Technology Approved readiness Verified Market Program Savings Readiness Low Partial *Based on avoided cost screen of $60/MWh for discretionary resources and $100/MWh for lost opportunities. % of Total 80%
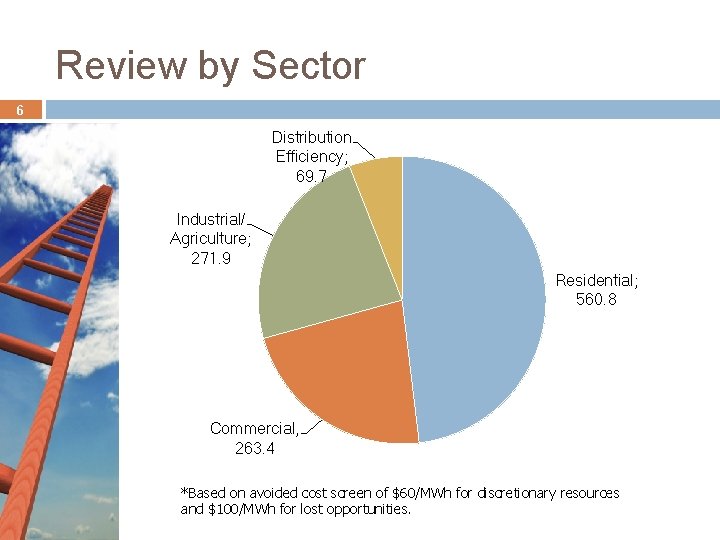
Review by Sector 6 Distribution Efficiency; 69. 7 Industrial/ Agriculture; 271. 9 Residential; 560. 8 Commercial, 263. 4 *Based on avoided cost screen of $60/MWh for discretionary resources and $100/MWh for lost opportunities.
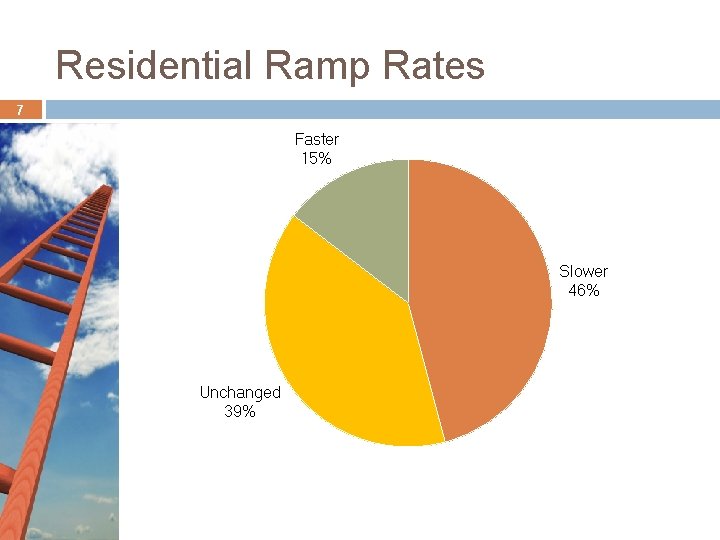
Residential Ramp Rates 7 Faster 15% Slower 46% Unchanged 39%
Residential Measure WG Changes 8
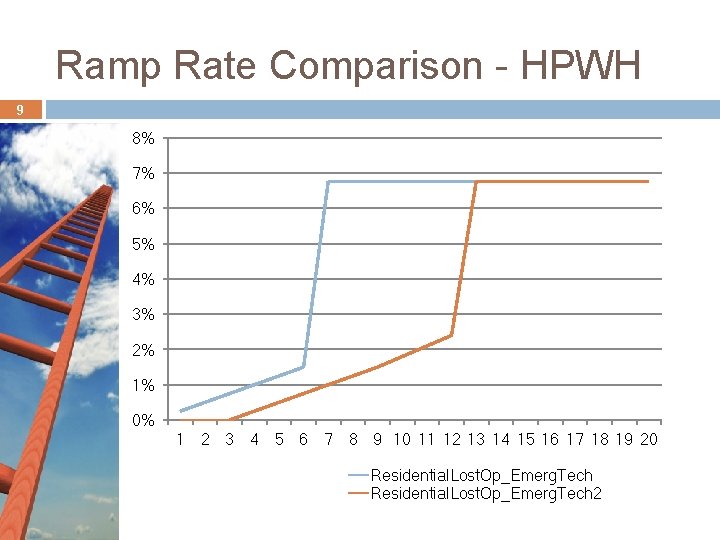
Ramp Rate Comparison - HPWH 9 8% 7% 6% 5% 4% 3% 2% 1% 0% 1 2 3 4 5 6 7 8 9 10 11 12 13 14 15 16 17 18 19 20 Residential. Lost. Op_Emerg. Tech 2
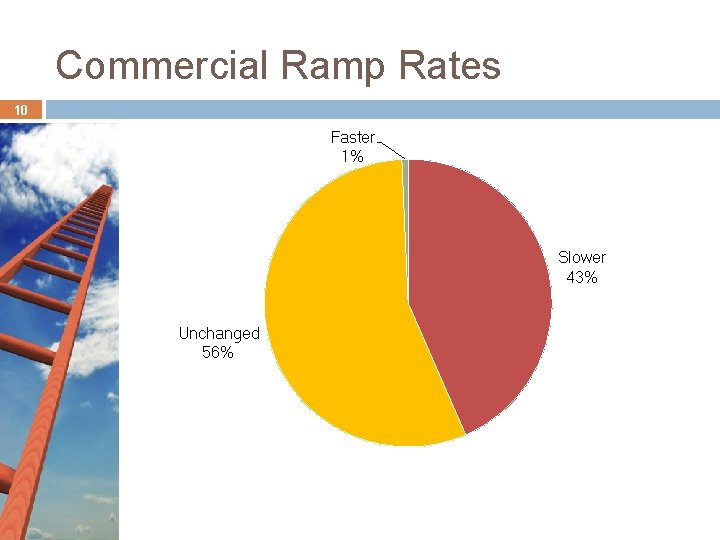
Commercial Ramp Rates 10 Faster 1% Slower 43% Unchanged 56%
Commercial Measure WG Changes 11
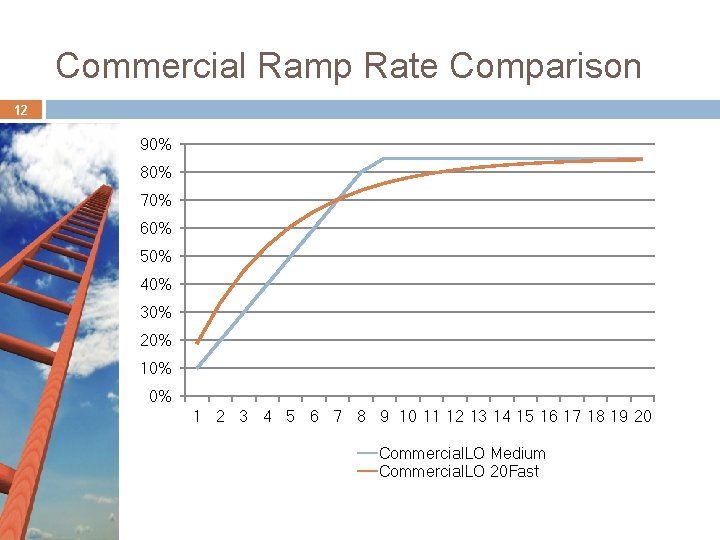
Commercial Ramp Rate Comparison 12 90% 80% 70% 60% 50% 40% 30% 20% 10% 0% 1 2 3 4 5 6 7 8 9 10 11 12 13 14 15 16 17 18 19 20 Commercial. LO Medium Commercial. LO 20 Fast
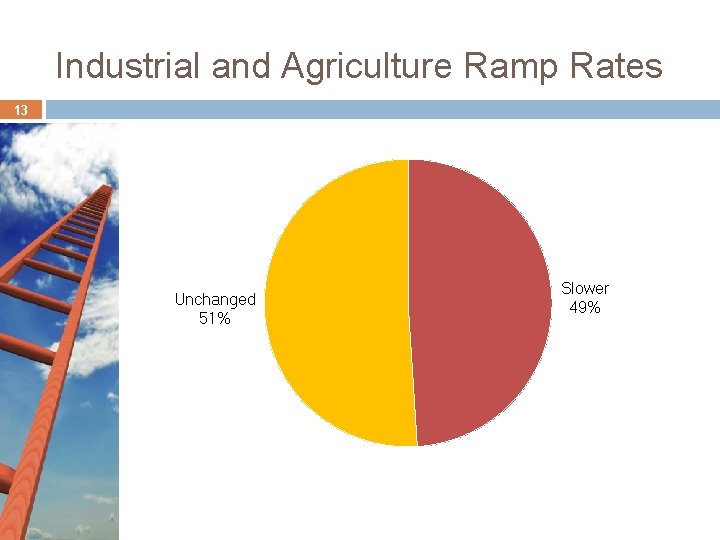
Industrial and Agriculture Ramp Rates 13 Unchanged 51% Slower 49%
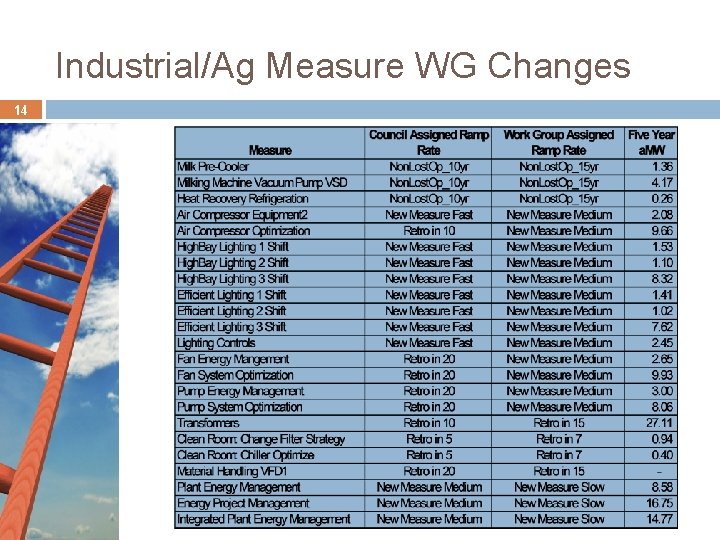
Industrial/Ag Measure WG Changes 14
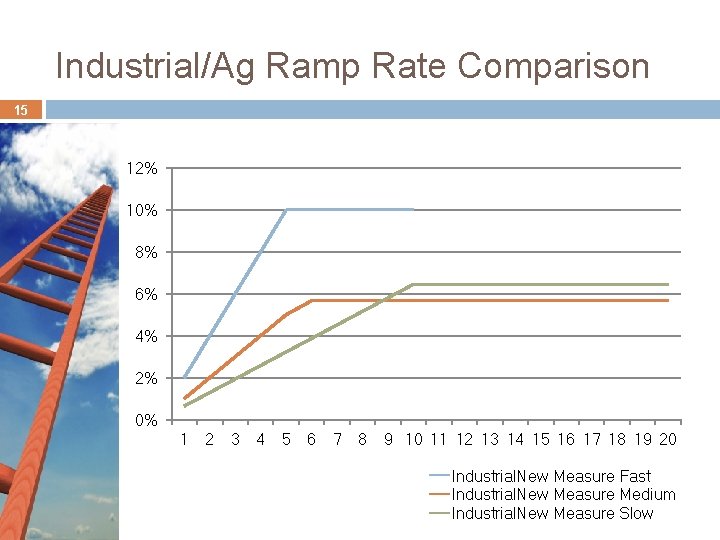
Industrial/Ag Ramp Rate Comparison 15 12% 10% 8% 6% 4% 2% 0% 1 2 3 4 5 6 7 8 9 10 11 12 13 14 15 16 17 18 19 20 Industrial. New Measure Fast Industrial. New Measure Medium Industrial. New Measure Slow
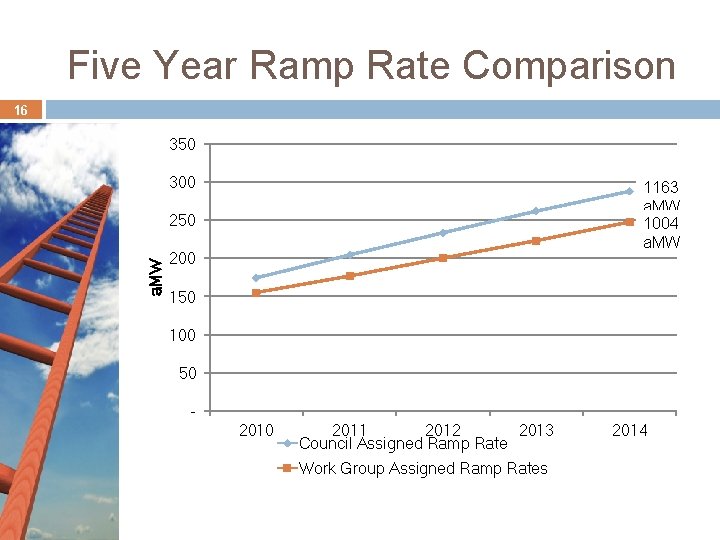
Five Year Ramp Rate Comparison 16 350 300 1163 a. MW 1004 a. MW 250 200 150 100 50 2011 2012 2013 Council Assigned Ramp Rate Work Group Assigned Ramp Rates 2014
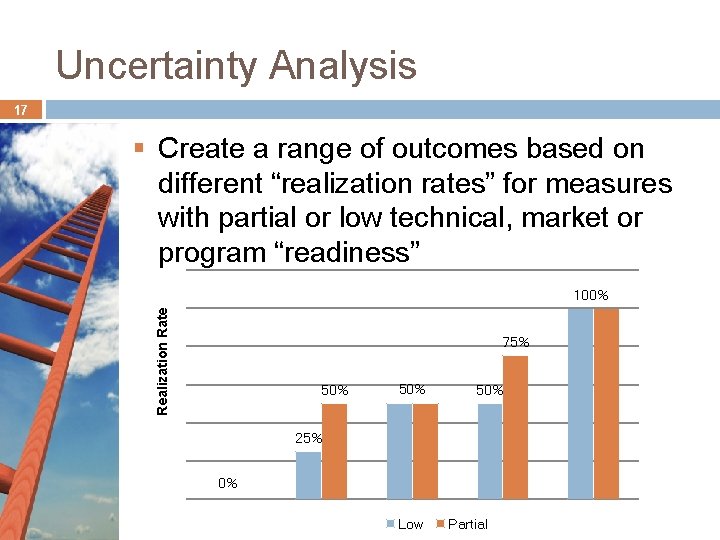
Uncertainty Analysis 17 § Create a range of outcomes based on different “realization rates” for measures with partial or low technical, market or program “readiness” Realization Rate 100% 75% 50% 50% 25% 0% Low Partial
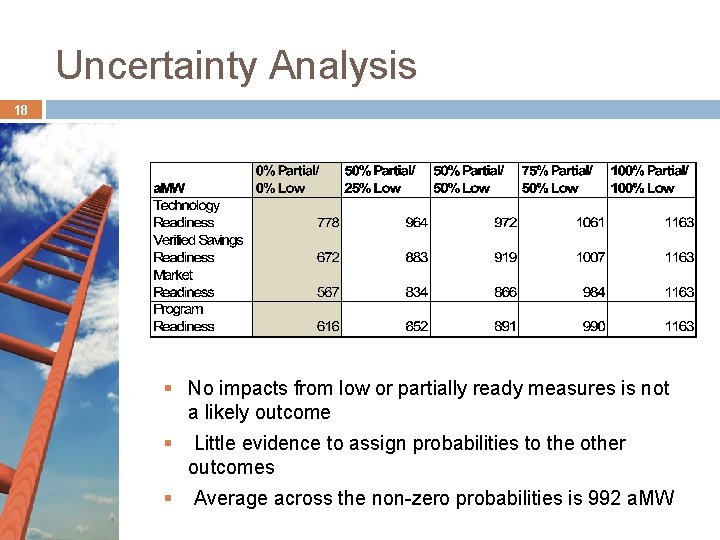
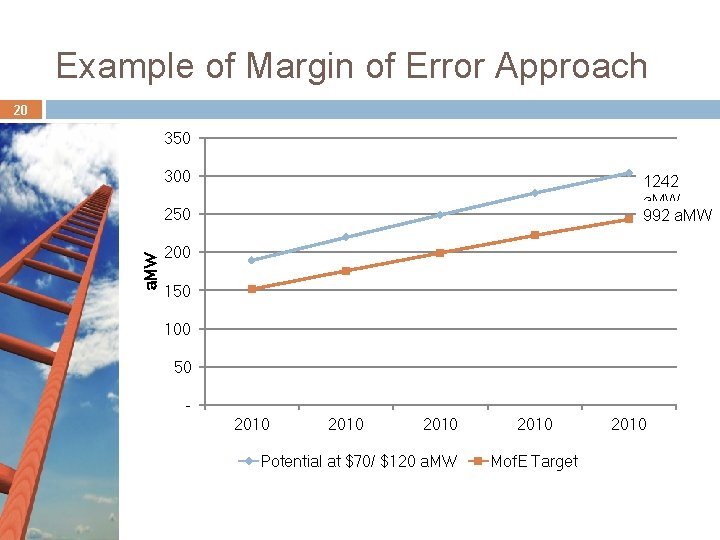
Uncertainty Analysis 18 § No impacts from low or partially ready measures is not a likely outcome § Little evidence to assign probabilities to the other outcomes § Average across the non-zero probabilities is 992 a. MW
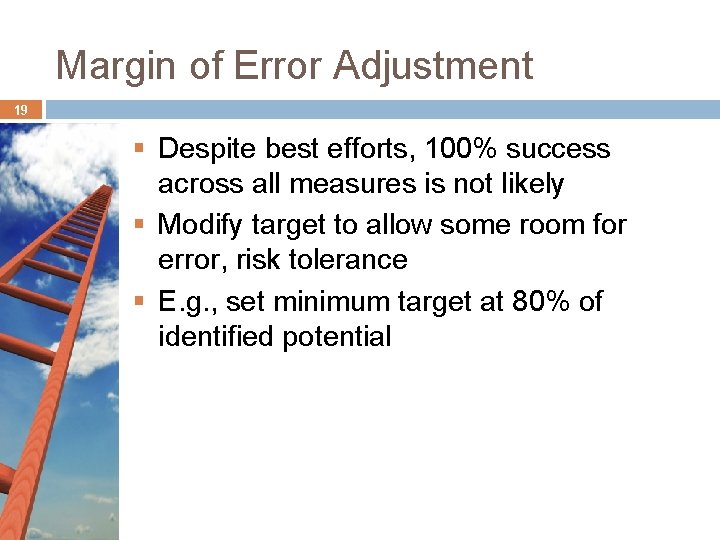
Margin of Error Adjustment 19 § Despite best efforts, 100% success across all measures is not likely § Modify target to allow some room for error, risk tolerance § E. g. , set minimum target at 80% of identified potential
Example of Margin of Error Approach 20 350 300 1242 a. MW 992 a. MW 250 200 150 100 50 2010 Potential at $70/ $120 a. MW 2010 Mof. E Target 2010
Effect of Increased Avoided Costs 21
Addressing Uncertainty 22 § Create a regional research agenda that includes: Objectives Priorities Funding commitments § Establish milestones for: Monitoring progress Making decisions
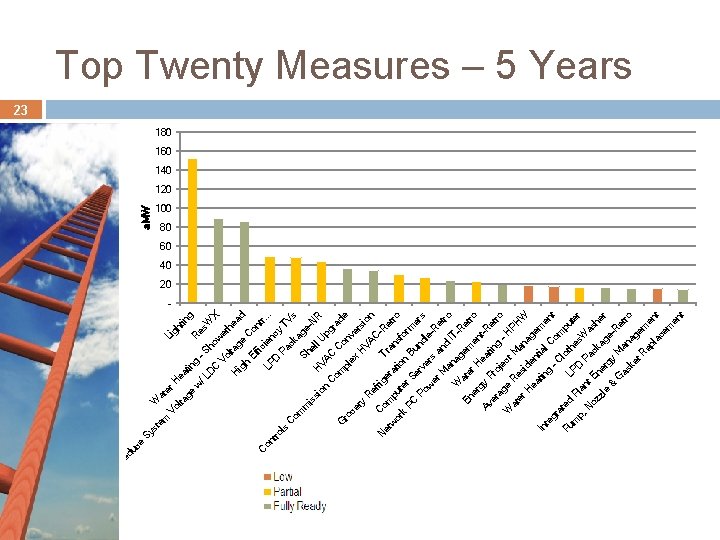
Sy em st at W Vo er Li gh H ea lta tin ge tin g R g w es -S /L W ho D X C Vo wer he lta H ad ge ig h C Ef on fi t C LP cien r. . . on tro c D Pa y T ls Vs C c ka om g Sh m eis N el si H R l on U VA p g C ra om C C de G on pl ro ve ex ce r ry H VA sion R ef C r C -R N Tr om ige et et a r w a p ro n tio or ut sf k er or n PC m Bu S nd ers Po erv er le w -R s er a et nd M ro an I T W ag R e et En ate ro r H me er n t-R ea Av gy tin P et er ro g ag roje c W e H t PH R at es Ma er W n i de ag H ea nt em tin ia In en l. C te g t gr -C o m a lo p Pu ted ut th LP m er e Pl p, an D P s. W N oz t En ack ash er zl ag er e gy e& R M G et a as ro ke nag t. R em ep en la ce t m en t e uc ed R a. MW Top Twenty Measures – 5 Years 23 180 160 140 120 100 80 60 40 20 -
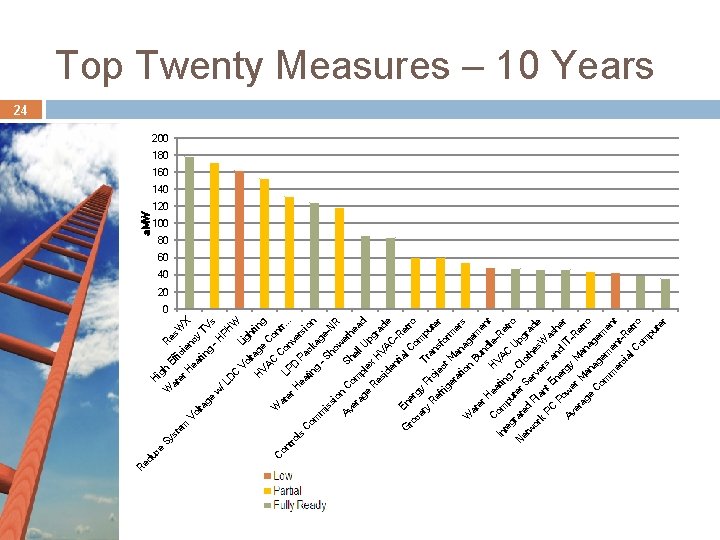
Sy em st at W h ig H ie fic Ef R es er H W X n Vo ea cy lta tin TV ge g s w H /L PH D W C Vo Lig h lta ge ting H VA C C on W C C tr at on o L er nv. . . PD tro H ls Pa ers ea C i t i om ng cka on m - S ge is ho -NR si on w Av Sh erh C o er e ag mp ell U ad l ex e pg R H ra es V de id A C en tia -Re E G l. C tr ro ner om o gy ce Tr ry pu Pr an R te ef oje s r fo ct rig r M m er an e at io ag rs W n at Bu em er en nd H t le H ea C om In tin VA -Re te C g tro gr put -C U e a p N r t g ed et Se lot w he rad Pl rv or s. W e a e k PC nt E rs a a nd she Po ne rg r IT w Av y -R er M er e M ag an ana tro e g a C em om ge e m me nt nt er -R ci al et r C om o pu te r uc e ed R a. MW Top Twenty Measures – 10 Years 24 200 180 160 140 120 100 80 60 40 20 0
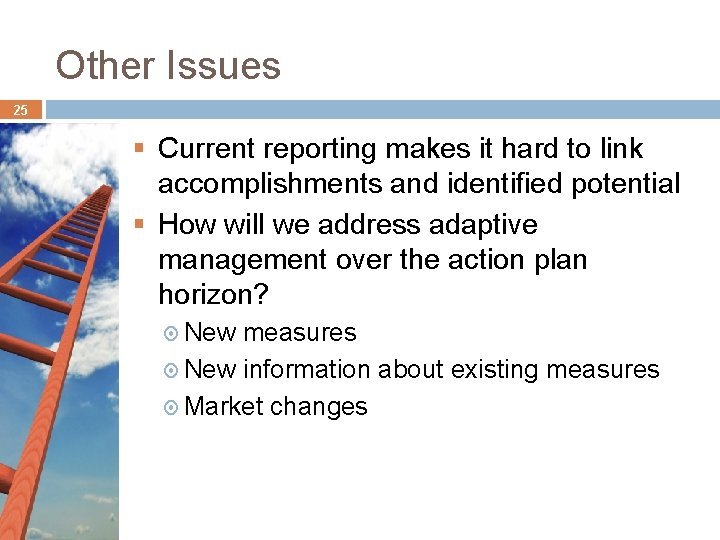
Other Issues 25 § Current reporting makes it hard to link accomplishments and identified potential § How will we address adaptive management over the action plan horizon? New measures New information about existing measures Market changes
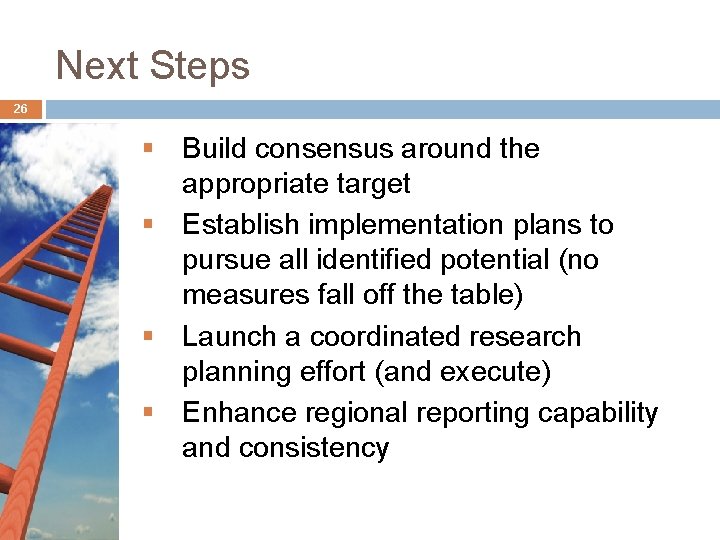
Next Steps 26 § Build consensus around the appropriate target § Establish implementation plans to pursue all identified potential (no measures fall off the table) § Launch a coordinated research planning effort (and execute) § Enhance regional reporting capability and consistency
Let’s get to work!!! 27