Session 9 Inflation Chapter 21 in text Inflation


- Slides: 37
Session 9
Inflation Chapter 21 in text
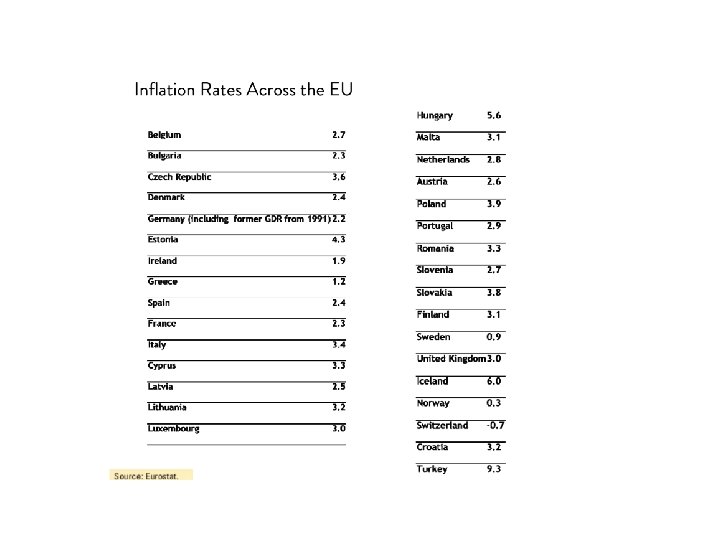
• Inflation is the term used to describe a situation in which the economy’s overall price level is rising. – Deflation is a decrease in the PL • The inflation rate is the percentage change in the price level from the previous period. – For any growth rate, just remember • {(new-old)/old}*100
• The consumer price index (CPI) is a measure of the overall cost of the goods and services bought by a typical consumer. • The Office of National Statistics for UK and Eurostat for Europe reports the CPI each month. – It is used to monitor changes in the cost of living over time. • When the CPI rises (inflation), the typical family has to spend more money to maintain the same standard of living.
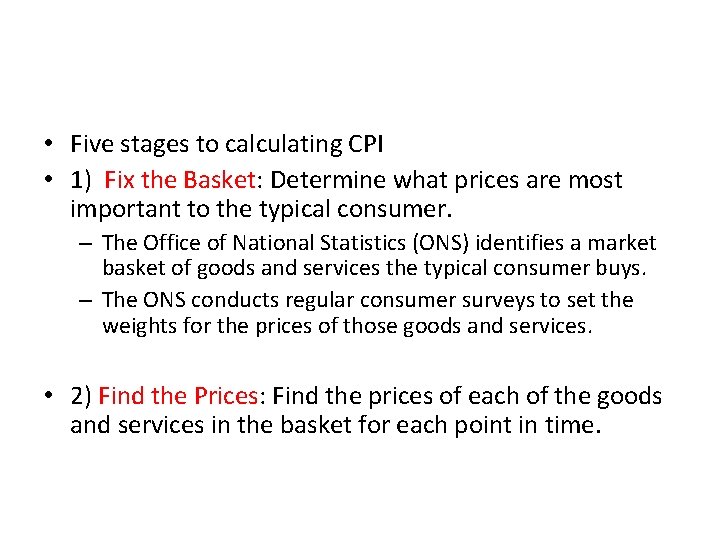
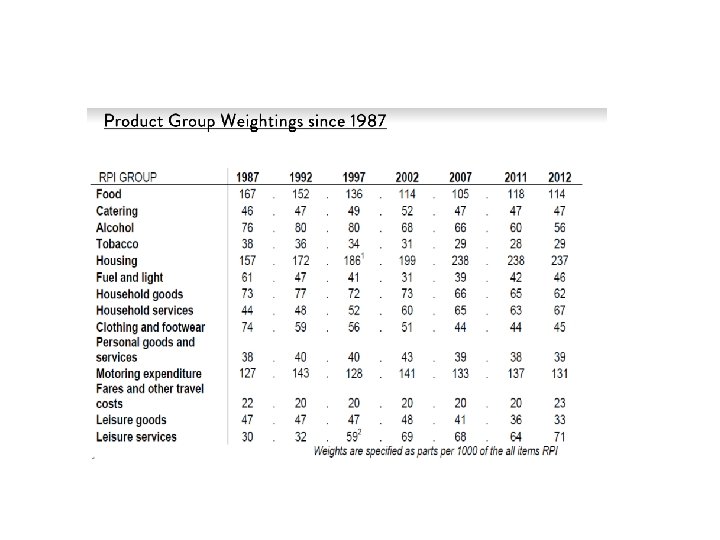
• Five stages to calculating CPI • 1) Fix the Basket: Determine what prices are most important to the typical consumer. – The Office of National Statistics (ONS) identifies a market basket of goods and services the typical consumer buys. – The ONS conducts regular consumer surveys to set the weights for the prices of those goods and services. • 2) Find the Prices: Find the prices of each of the goods and services in the basket for each point in time.
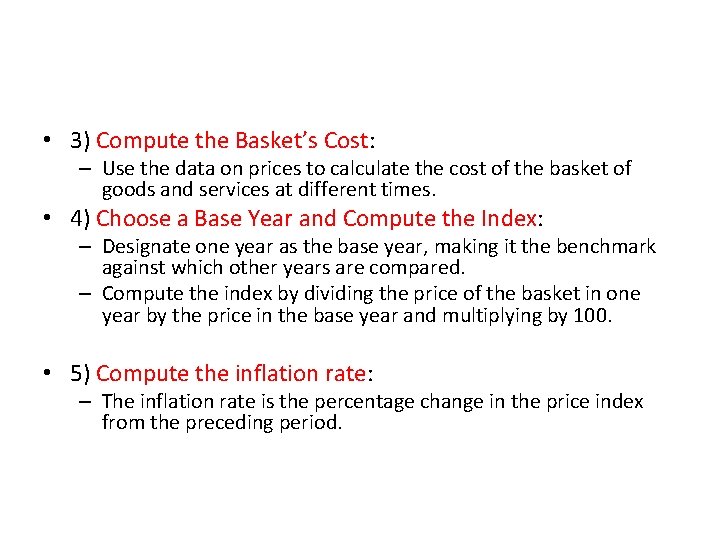
• 3) Compute the Basket’s Cost: – Use the data on prices to calculate the cost of the basket of goods and services at different times. • 4) Choose a Base Year and Compute the Index: – Designate one year as the base year, making it the benchmark against which other years are compared. – Compute the index by dividing the price of the basket in one year by the price in the base year and multiplying by 100. • 5) Compute the inflation rate: – The inflation rate is the percentage change in the price index from the preceding period.
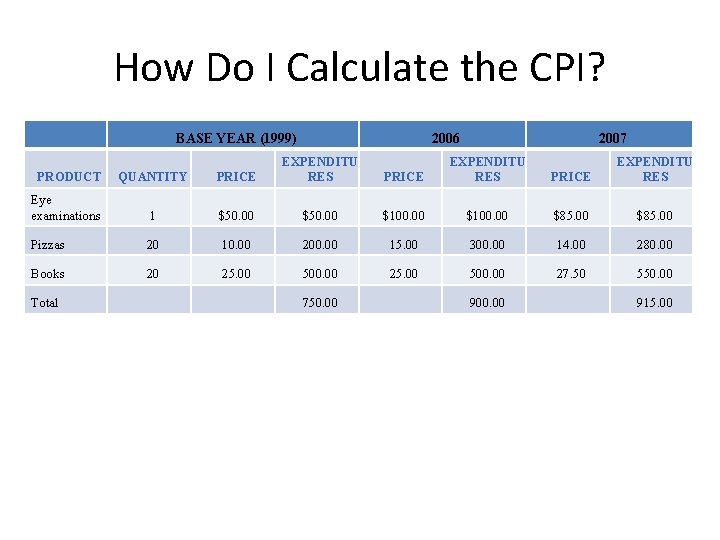
How Do I Calculate the CPI? BASE YEAR (1999) 2006 2007 PRODUCT QUANTITY PRICE EXPENDITU RES Eye examinations 1 $50. 00 $100. 00 $85. 00 Pizzas 20 10. 00 200. 00 15. 00 300. 00 14. 00 280. 00 Books 20 25. 00 500. 00 27. 50 550. 00 Total 750. 00 PRICE EXPENDITU RES 900. 00 915. 00
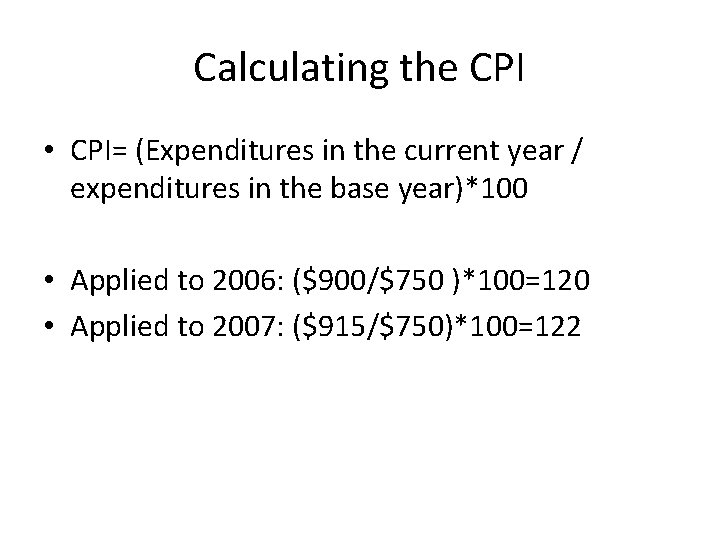
Calculating the CPI • CPI= (Expenditures in the current year / expenditures in the base year)*100 • Applied to 2006: ($900/$750 )*100=120 • Applied to 2007: ($915/$750)*100=122
Calculating Inflation • Calculating the inflation rate is easy: • Inf. Rate = {(this year’s CPI - last year’s CPI)/Last years CPI}*100 • Say the CPI for 2006 is 120 (in $1999) and the CPI in 2007 is 122. • Inflation rate for 2007 is {(122120)/120}*100=1. 7% • We can also say that prices have increased 22% since 1999. Why?
Note that: • the CPI is always in relation to a base year. Always. • the CPI is an index and thus its measured in “points”, not dollars, percentages, gold stars or anything else explicitly tangible • the CPI has a direct effect on people b/c many important things are indexed to the CPI, such as income tax brackets and some gov’t payments – Of course its also used by policy makers to make decisions and in loads of economic research
Is the CPI Accurate? • Increase in quality bias • New product bias • Substitution bias – Imagine a mkt bskt w/ 5 apples and 5 oranges, $1 each – Now imagine P of apples ↑ $2 (so mkt bskt is now $15) • Would conclude inflation was 50% – Is it plausible that people may partially sub away from the expensive apples towards the cheap oranges? • Maybe they are just as happy consuming 8 oranges and 3 apples as 5 and 5 • This mkt basket costs only (8*1)+(3*2)=$14
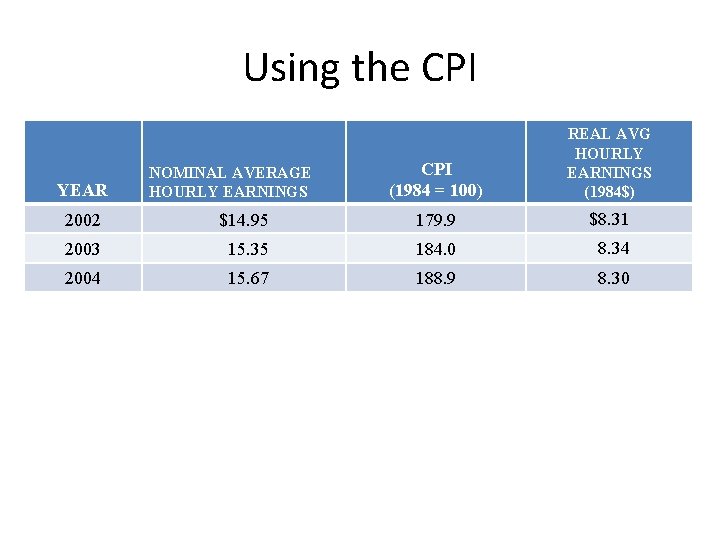
Can We Use the CPI to Adjust for the Effects of Inflation? • Yup • Take the ((nominal price) / (that year’s CPI))* 100. This gives you the inflation adjusted value in base year dollars.
Using the CPI YEAR NOMINAL AVERAGE HOURLY EARNINGS CPI (1984 = 100) REAL AVG HOURLY EARNINGS (1984$) 2002 $14. 95 179. 9 $8. 31 2003 15. 35 184. 0 8. 34 2004 15. 67 188. 9 8. 30
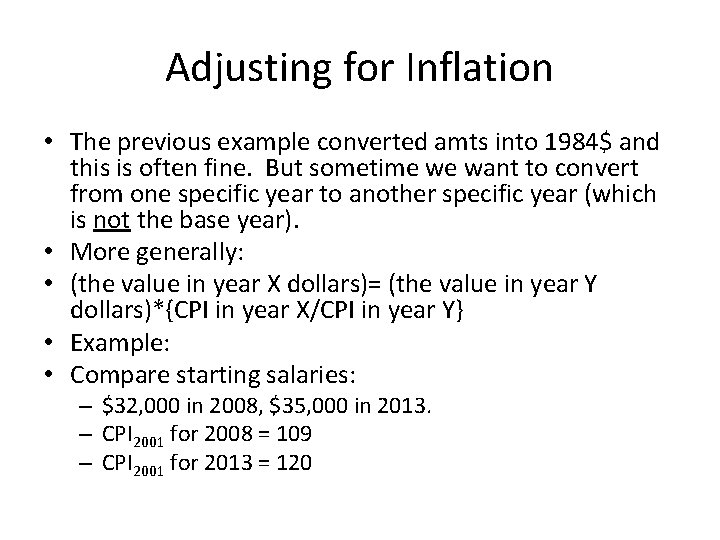
Adjusting for Inflation • The previous example converted amts into 1984$ and this is often fine. But sometime we want to convert from one specific year to another specific year (which is not the base year). • More generally: • (the value in year X dollars)= (the value in year Y dollars)*{CPI in year X/CPI in year Y} • Example: • Compare starting salaries: – $32, 000 in 2008, $35, 000 in 2013. – CPI 2001 for 2008 = 109 – CPI 2001 for 2013 = 120
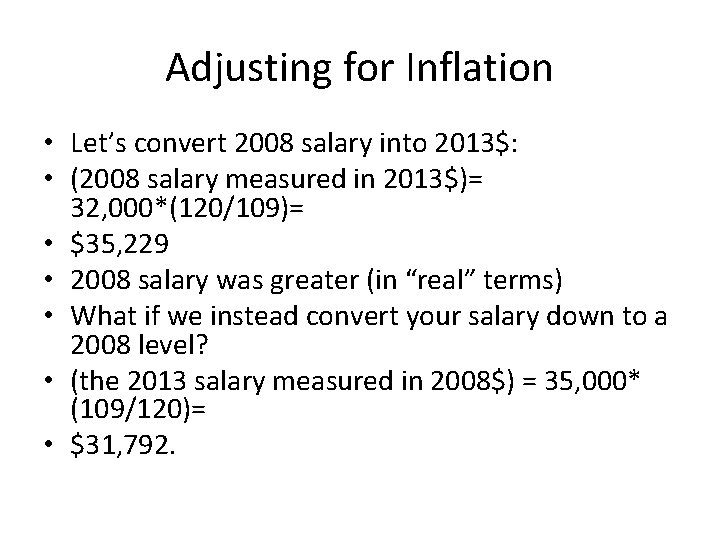
Adjusting for Inflation • Let’s convert 2008 salary into 2013$: • (2008 salary measured in 2013$)= 32, 000*(120/109)= • $35, 229 • 2008 salary was greater (in “real” terms) • What if we instead convert your salary down to a 2008 level? • (the 2013 salary measured in 2008$) = 35, 000* (109/120)= • $31, 792.
Does inflation impose a cost to the econ? • What if prices and your salary both doubled? Would you be worse off? • Hmm, maybe not…. IF nominal wages keep up with inflation. • Do we think they would? • Yes (at least eventually), if the labor mkt is competitive. • But even if nom. wages adjust perfectly and instantly to changes in the price level, inflation could still be harmful. • Any ideas how?
Does inflation impose a cost on the econ? • Reduces the value of wealth held in dollar denominated assets – Money in savings/checking accounts, bonds, etc – Generally, we think poorer people hold a larger fraction of their wealth in money so inflation may affect the poor more. • Menu costs • Lots of uncertainty in future price level can create risk in lending thus stifling credit mkts. – Note there will be a winner and a loser, but if both parties are risk averse, it may reduce the overall level of lending which could mean good projects go unfunded (to the detriment of social welfare)
Uncertain expected inflation • As always, we note that we don’t directly care about the number of dollars in our bank account: – What we really care about is the amount of stuff we can buy with that money • Say I want to borrow € 100 for 1 year and I agree to pay you a 2% rate of return (I pay you € 102 one year from today) • Say the inflation rate was 2%. • Did you earn anything in “real” terms? • If you really want a 2% return, and you expect 2% inflation, what interest rate do you need to charge?
Uncertain expected inflation • Imagine that you expect inflation to be 2%, but it turns out to be 5% • Who won and who lost there? • At 4% nom. int. rate, I borrowed € 100, paid back € 104, which was really only worth about € 99 in last years dollars. • So the € 104 you get actually buys LESS in the current year than the € 100 you loaned out would have bought last year. – You paid me (implicitly) to borrow the money!
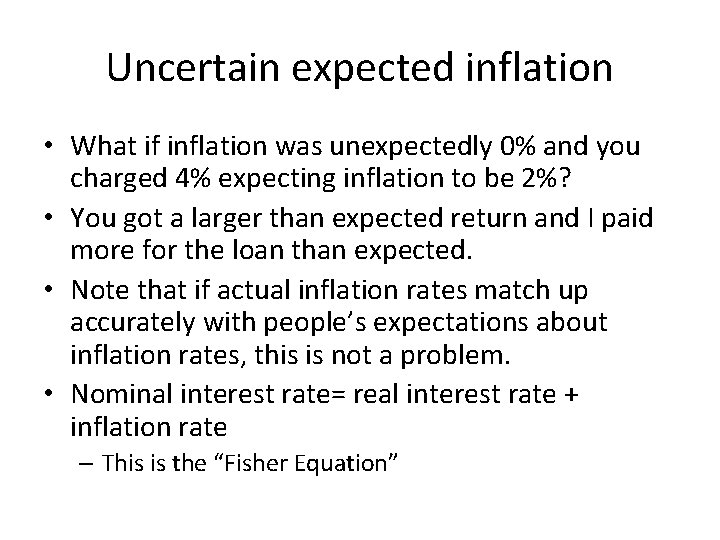
Uncertain expected inflation • What if inflation was unexpectedly 0% and you charged 4% expecting inflation to be 2%? • You got a larger than expected return and I paid more for the loan than expected. • Note that if actual inflation rates match up accurately with people’s expectations about inflation rates, this is not a problem. • Nominal interest rate= real interest rate + inflation rate – This is the “Fisher Equation”
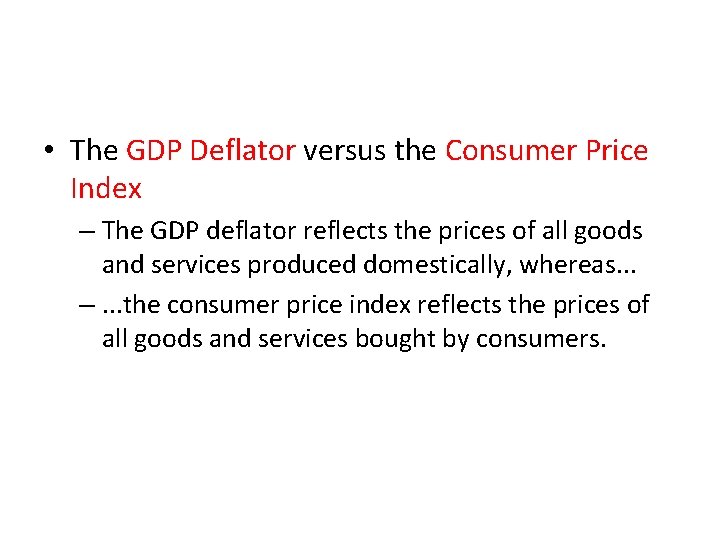
• The GDP Deflator versus the Consumer Price Index – The GDP deflator reflects the prices of all goods and services produced domestically, whereas. . . –. . . the consumer price index reflects the prices of all goods and services bought by consumers.
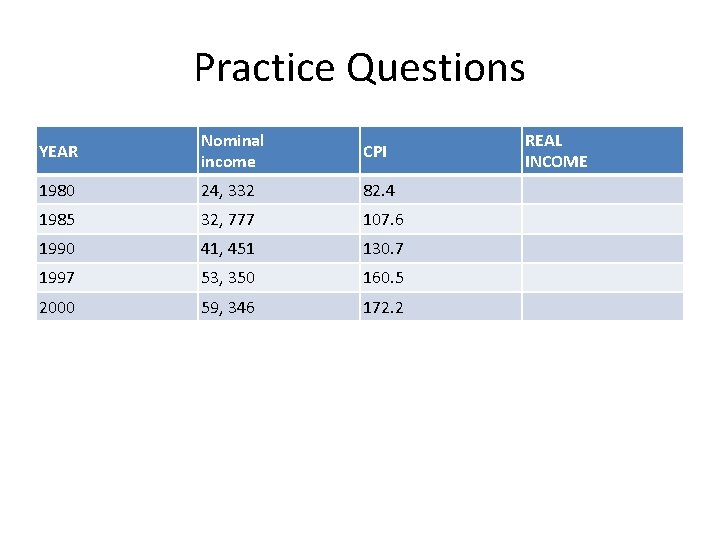
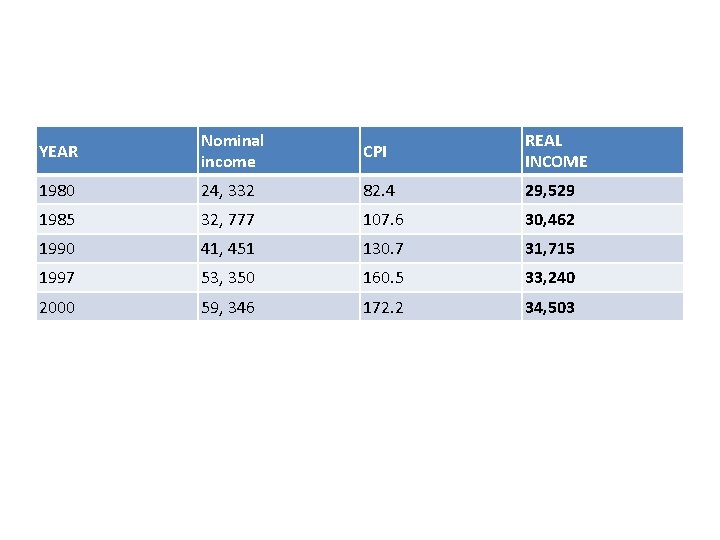
Practice Questions YEAR Nominal income CPI 1980 24, 332 82. 4 1985 32, 777 107. 6 1990 41, 451 130. 7 1997 53, 350 160. 5 2000 59, 346 172. 2 REAL INCOME
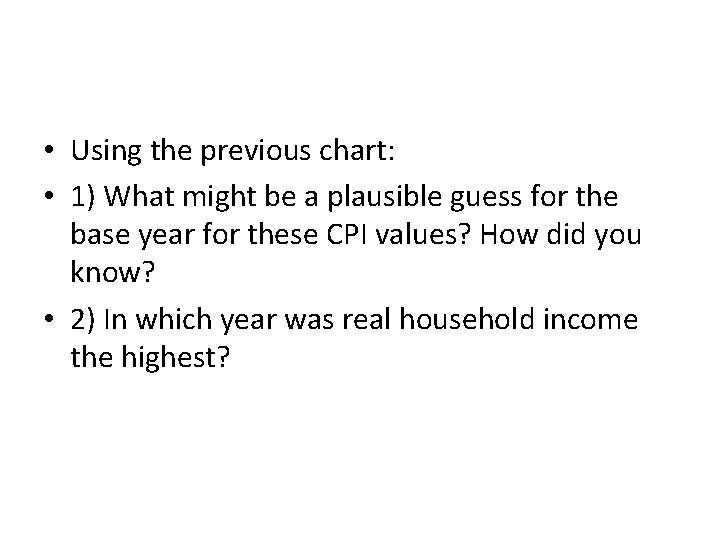
• Using the previous chart: • 1) What might be a plausible guess for the base year for these CPI values? How did you know? • 2) In which year was real household income the highest?
YEAR Nominal income CPI REAL INCOME 1980 24, 332 82. 4 29, 529 1985 32, 777 107. 6 30, 462 1990 41, 451 130. 7 31, 715 1997 53, 350 160. 5 33, 240 2000 59, 346 172. 2 34, 503
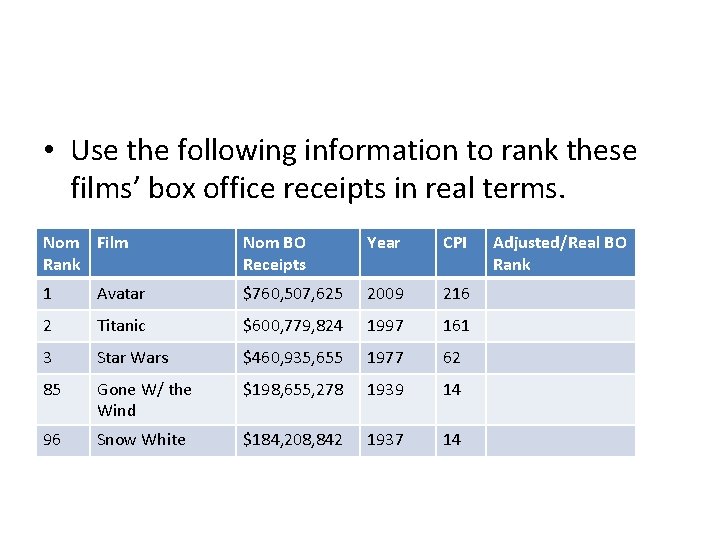
• Use the following information to rank these films’ box office receipts in real terms. Nom Film Rank Nom BO Receipts Year CPI 1 Avatar $760, 507, 625 2009 216 2 Titanic $600, 779, 824 1997 161 3 Star Wars $460, 935, 655 1977 62 85 Gone W/ the Wind $198, 655, 278 1939 14 96 Snow White $184, 208, 842 1937 14 Adjusted/Real BO Rank
Unemployment Chapter 23 in Text
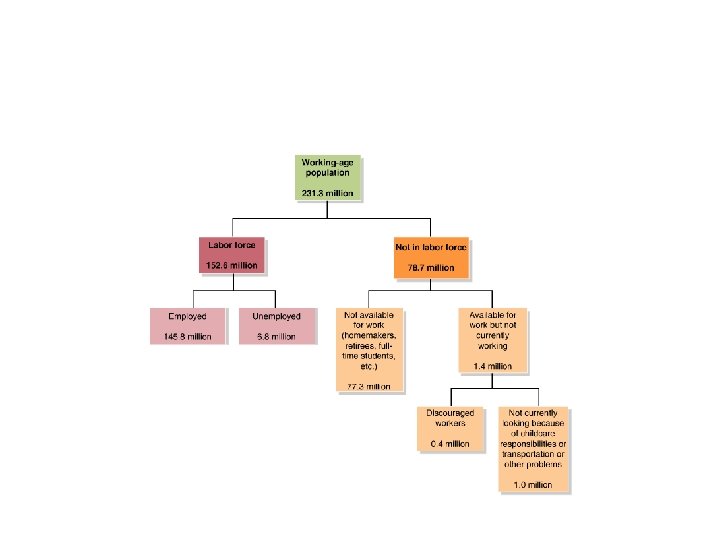
Some definitions: • Labor force: The sum of employed and unemployed workers in the economy. • Unemployment rate: The percentage of the labor force that is unemployed.
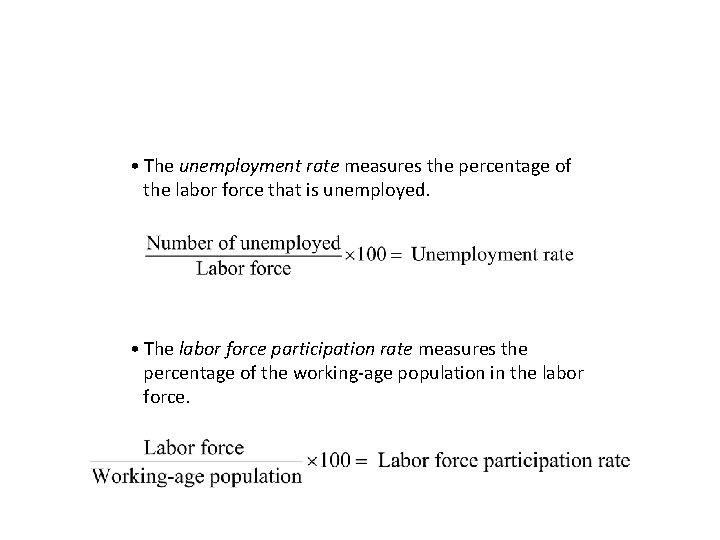
• The unemployment rate measures the percentage of the labor force that is unemployed. • The labor force participation rate measures the percentage of the working-age population in the labor force.
Problems with Measuring the Unemp Rate • Provides useful information, but is far from a perfect measure of joblessness in the econ or of the shape of the econ in general
Problems with Measuring the Unemp Rate • Understating Unemployment • One problem is that its difficult to distinguish who is/isn’t in the labor force – Discouraged workers: People who are available for work but have not looked for a job during the previous four weeks because they believe no jobs are available for them. • Underemployment – Part time workers • It is estimated that if you added in the above groups, unemployment would be about 3 -4% points higher.
Problems with Measuring the Unemp Rate • Overstating Unemployment • The survey does not verify the info people provide – If they say they’ve looked for work but haven’t, they are counted as unemployed. • They may do this for several reasons, like remaining eligible for unemployment benefits – People might be working “under the table” to avoid paying taxes • Might fear the tax authorities could learn about their job
• Also note that the reported employment data is net • We would expect some amount of job creation and destruction over time in a vibrant market system as there are changes in consumer tastes and technologies.
3 types of unemp • Economists have identified three different types of unemployment • 1) Frictional unemployment : Short-term unemployment that arises from the process of matching workers with jobs. • 2) Structural unemployment : Unemployment arising from a persistent mismatch between the skills and characteristics of workers and the requirements of jobs. • 3) Cyclical unemployment : Unemployment caused by a business cycle recession.
• Is zero unemployment a worthwhile (or attainable) goal? • Even in the best of time the unemp rate is almost never below 4% • We think of frictional and structural UE as a normal, underlying level of UE in the econ and not always an indication of economic weakness. • This “normal” level of unemployment (just struc. and frictional, omitting cyclical) is known as the natural rate of unemployment • Generally believed to be around 7% in Europe • Also known as “full employment”