Section 9 2 THE RECIPROCAL FUNCTION FAMILY PA

- Slides: 12
Section 9. 2 THE RECIPROCAL FUNCTION FAMILY
PA Assessment Standard Match the graph of a given function to its table or equation.
LEQ How do you graph a translation of an inverse variation graph?
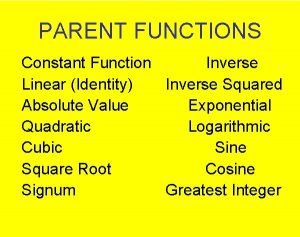
Using Graphs of Inverse Variations: �Definition 1: Functions that model inverse variations belong to a family whose parent is the reciprocal function. �Definition 2: The graph below shows the function y = 5/x. Notice that the graph has two parts. Each part is called a branch. � Definition 3: The vertical asymptote of a graph are lines the graph approaches.
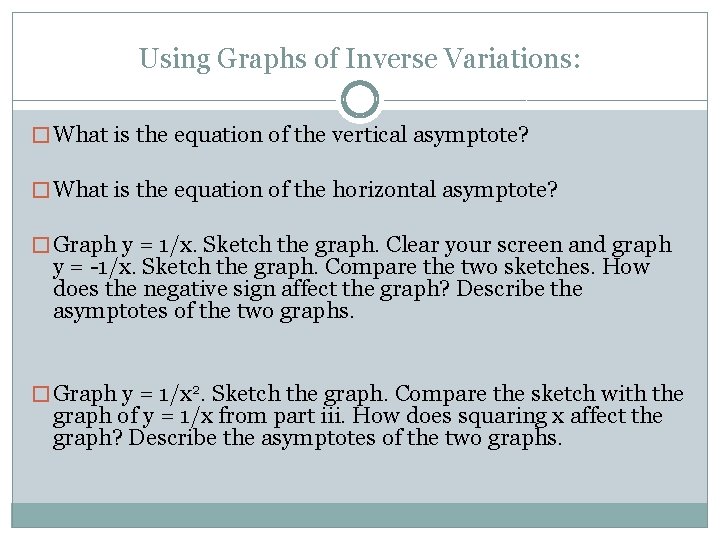
Using Graphs of Inverse Variations: � What is the equation of the vertical asymptote? � What is the equation of the horizontal asymptote? � Graph y = 1/x. Sketch the graph. Clear your screen and graph y = -1/x. Sketch the graph. Compare the two sketches. How does the negative sign affect the graph? Describe the asymptotes of the two graphs. � Graph y = 1/x 2. Sketch the graph. Compare the sketch with the graph of y = 1/x from part iii. How does squaring x affect the graph? Describe the asymptotes of the two graphs.
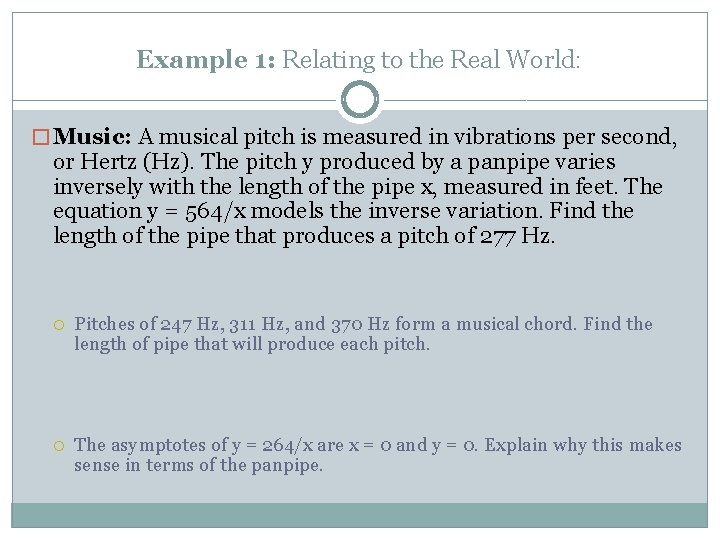
Example 1: Relating to the Real World: � Music: A musical pitch is measured in vibrations per second, or Hertz (Hz). The pitch y produced by a panpipe varies inversely with the length of the pipe x, measured in feet. The equation y = 564/x models the inverse variation. Find the length of the pipe that produces a pitch of 277 Hz. Pitches of 247 Hz, 311 Hz, and 370 Hz form a musical chord. Find the length of pipe that will produce each pitch. The asymptotes of y = 264/x are x = 0 and y = 0. Explain why this makes sense in terms of the panpipe.
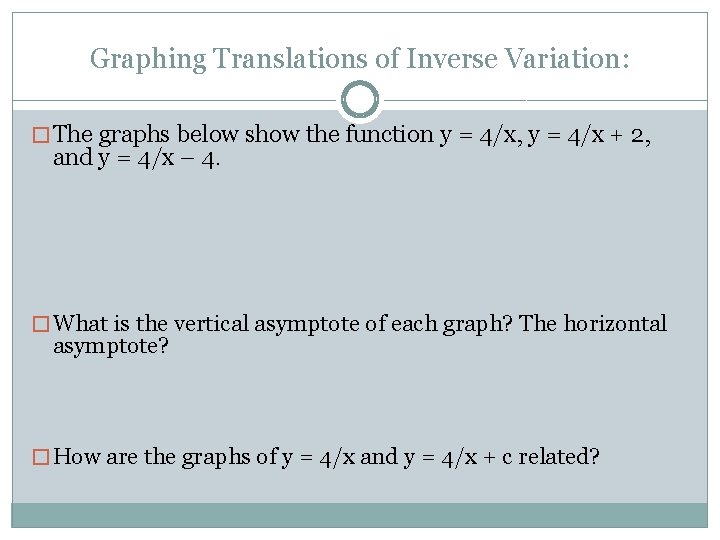
Graphing Translations of Inverse Variation: � The graphs below show the function y = 4/x, y = 4/x + 2, and y = 4/x – 4. � What is the vertical asymptote of each graph? The horizontal asymptote? � How are the graphs of y = 4/x and y = 4/x + c related?
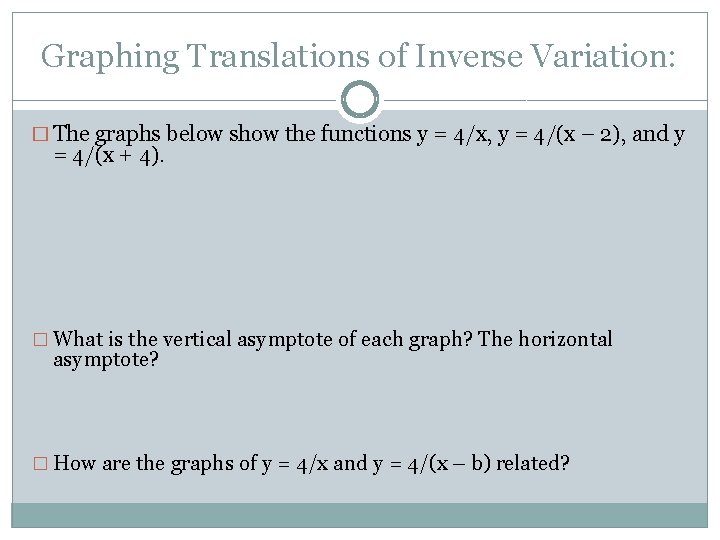
Graphing Translations of Inverse Variation: � The graphs below show the functions y = 4/x, y = 4/(x – 2), and y = 4/(x + 4). � What is the vertical asymptote of each graph? The horizontal asymptote? � How are the graphs of y = 4/x and y = 4/(x – b) related?
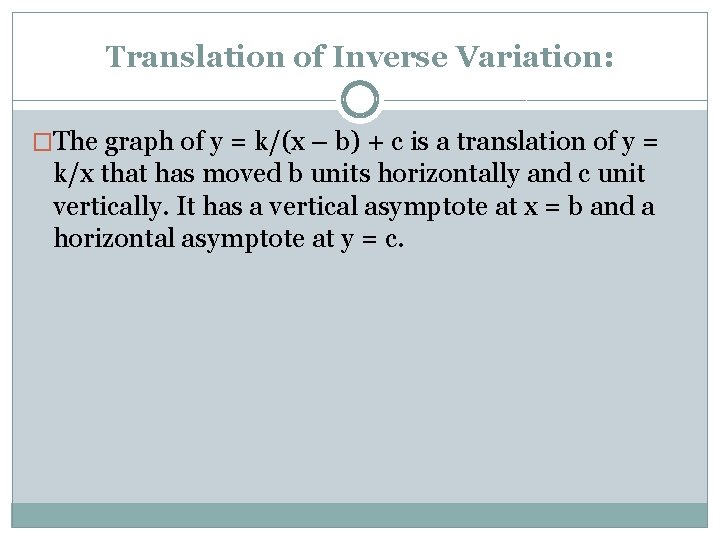
Translation of Inverse Variation: �The graph of y = k/(x – b) + c is a translation of y = k/x that has moved b units horizontally and c unit vertically. It has a vertical asymptote at x = b and a horizontal asymptote at y = c.
Examples 2 - 7 �Sketch the graphs of the following functions. Identify the vertical and horizontal asymptotes.
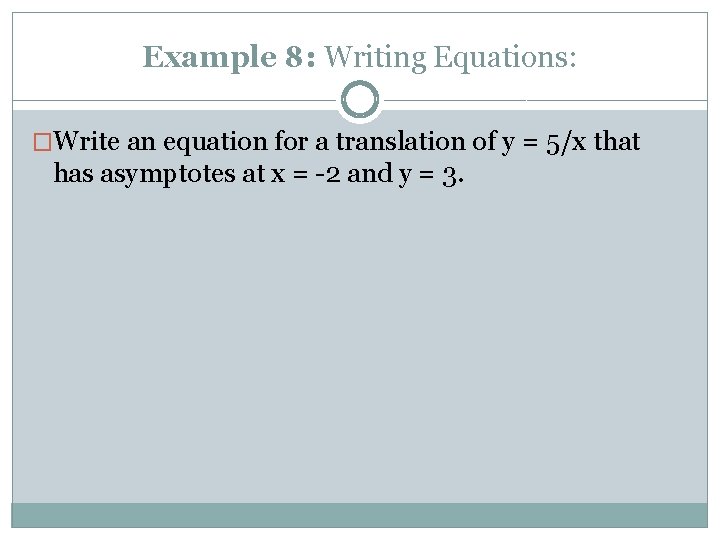
Example 8: Writing Equations: �Write an equation for a translation of y = 5/x that has asymptotes at x = -2 and y = 3.
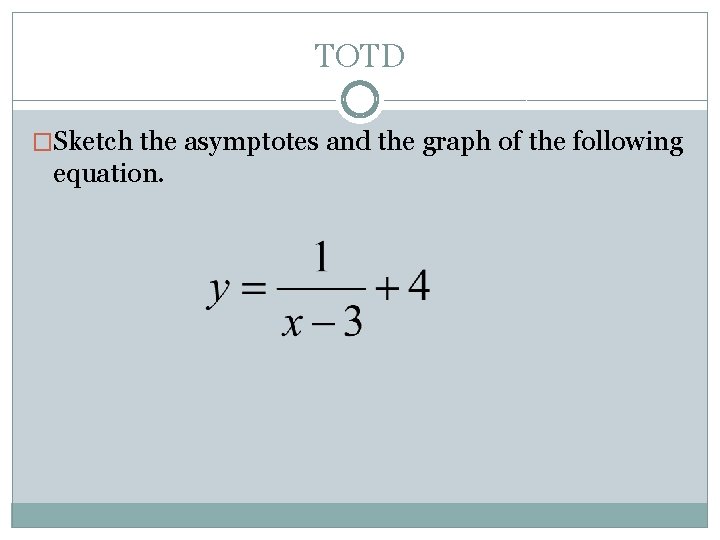
TOTD �Sketch the asymptotes and the graph of the following equation.