
Trig Graphs and reciprocal trig functions AS 91575
- Slides: 45
Trig Graphs and reciprocal trig functions AS 91575 4 credits
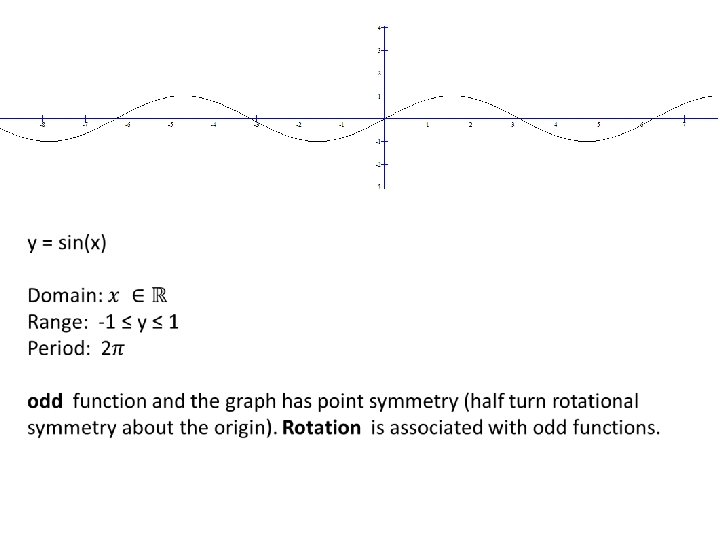
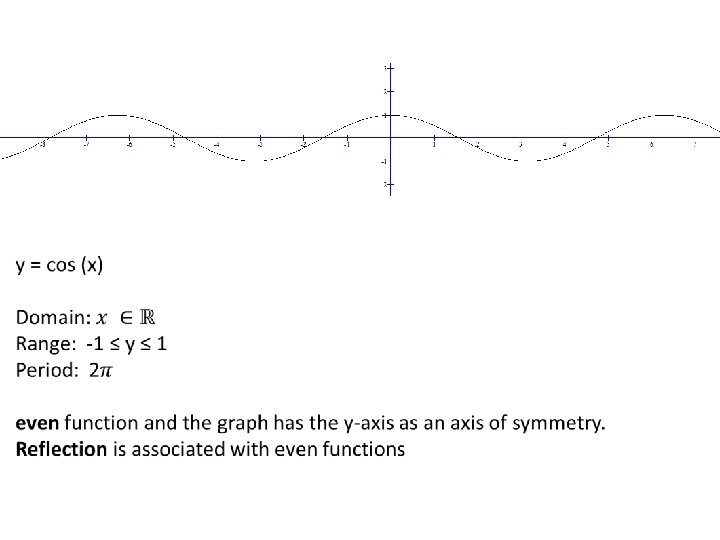
Graphs of Trigonometric Functions 5/06/2021 • I know recognise the graphs for sin, cos and tan • I am familiar with the words domain, range, odd function, even function, amplitude and period • I can transform graphs of trigonometric functions
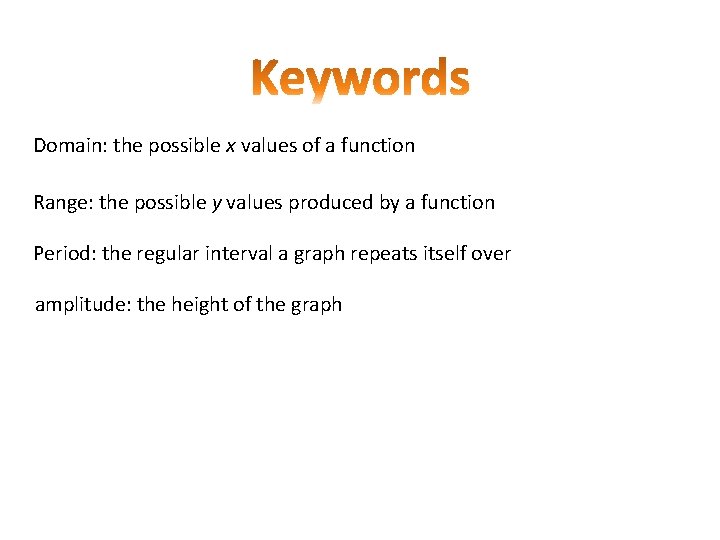
Domain: the possible x values of a function Range: the possible y values produced by a function Period: the regular interval a graph repeats itself over amplitude: the height of the graph
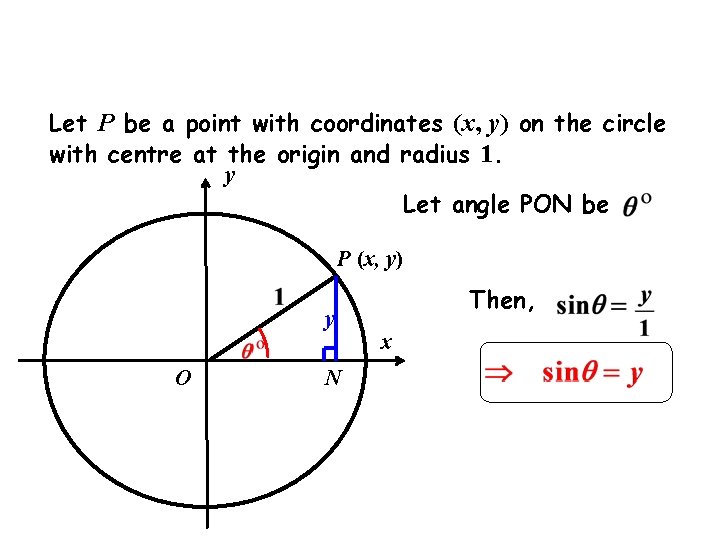
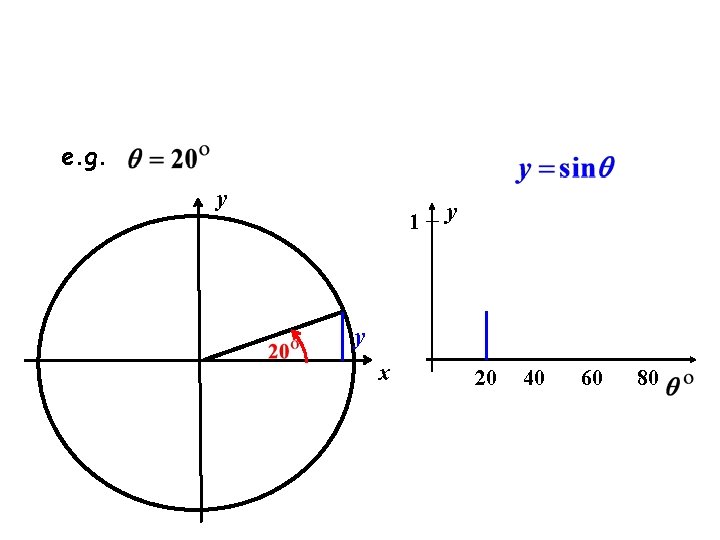
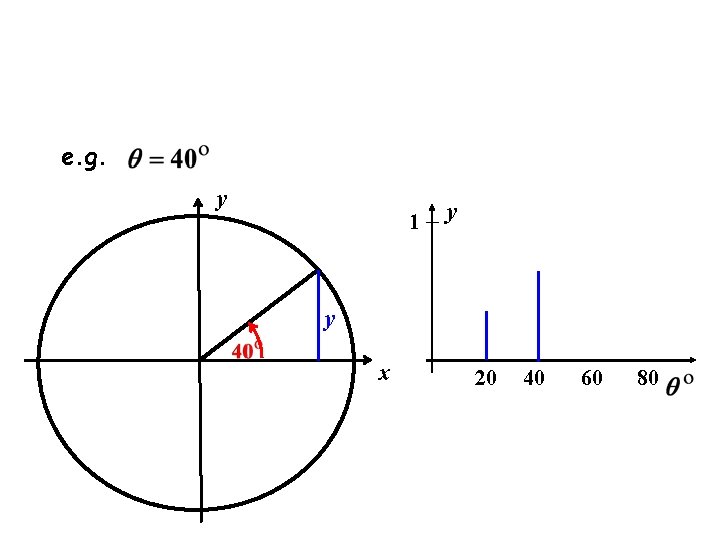
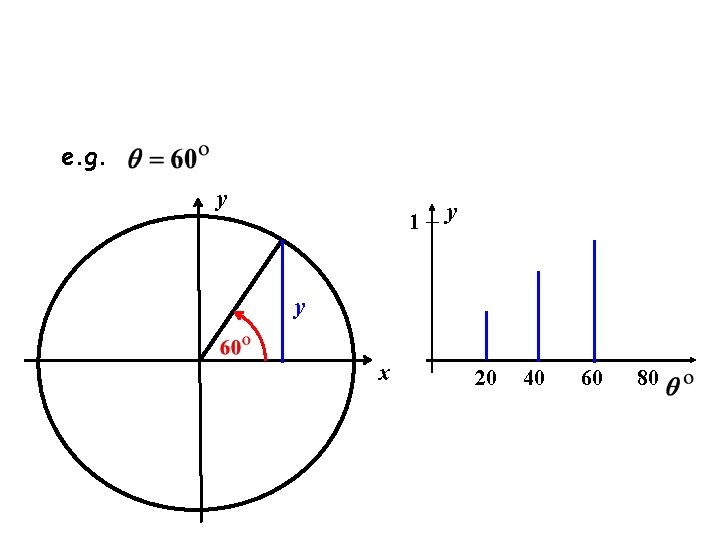
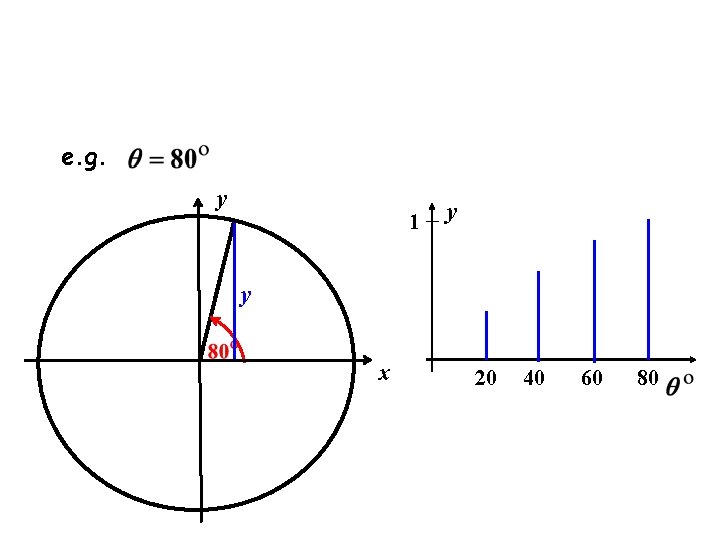
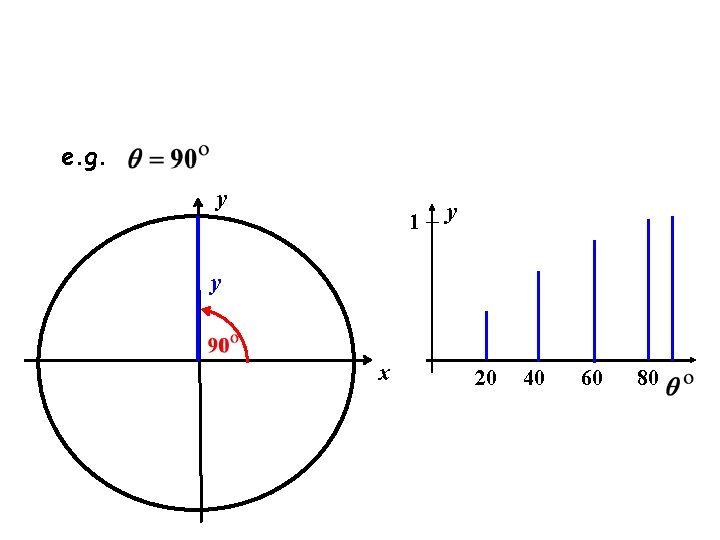
Let P be a point with coordinates (x, y) on the circle with centre at the origin and radius 1. y Let angle PON be P (x, y) y O N Then, x
e. g. y 1 y y x 20 40 60 80
e. g. y 1 y y x 20 40 60 80
e. g. y 1 y y x 20 40 60 80
e. g. y 1 y y x 20 40 60 80
e. g. y 1 y y x 20 40 60 80
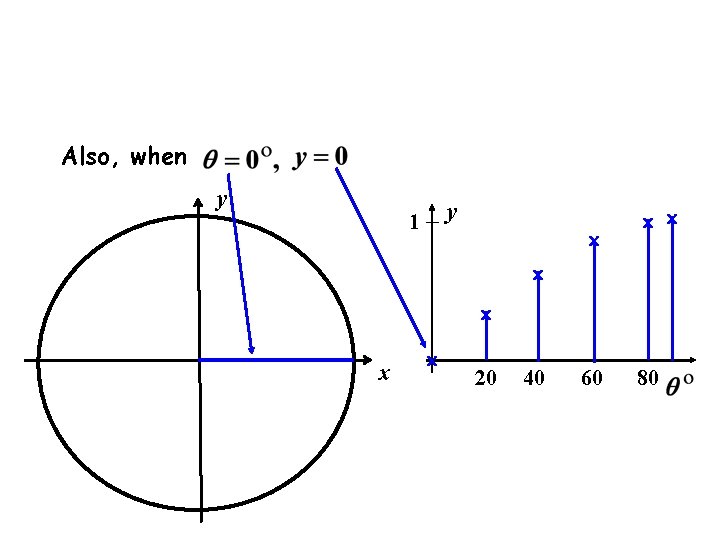
Also, when y y 1 x x x x 20 40 60 80
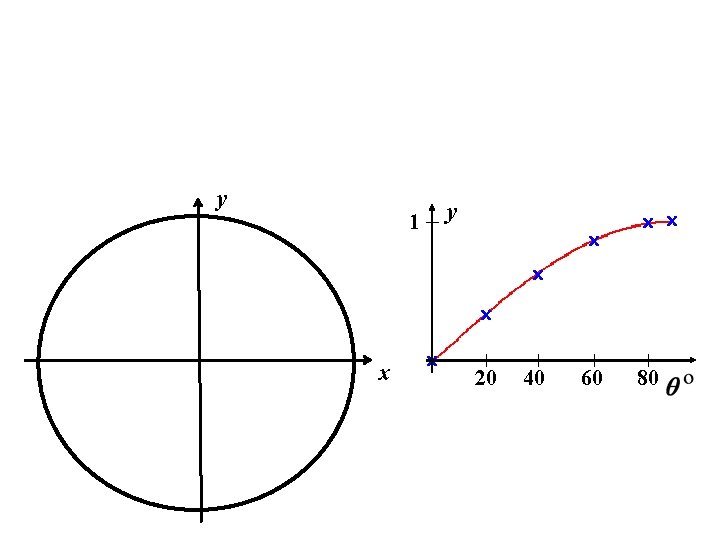
y y 1 x x x x 20 40 60 80
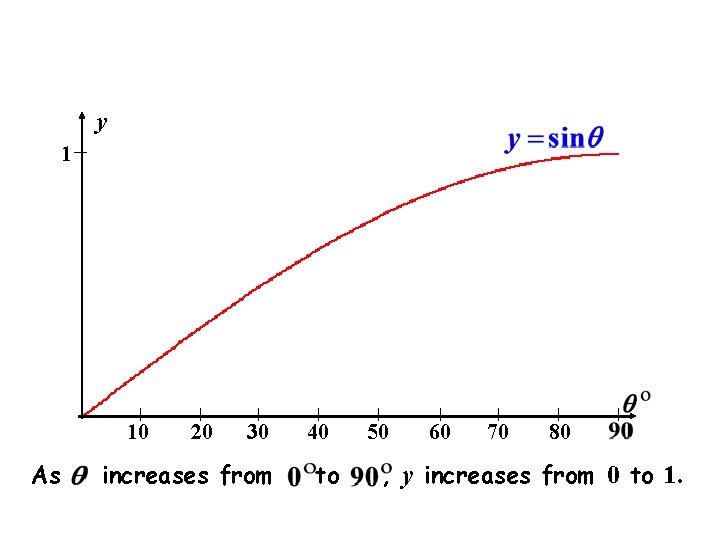
y 1 10 As 20 30 increases from 40 to 50 60 70 80 , y increases from 0 to 1.
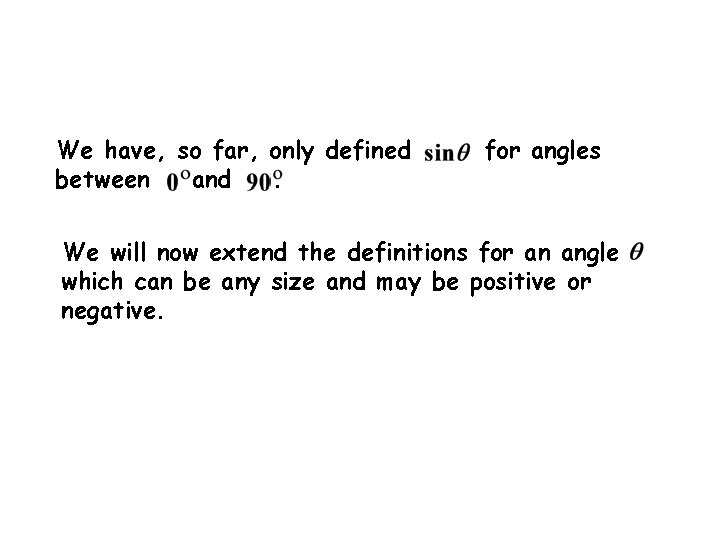
We have, so far, only defined between and. for angles We will now extend the definitions for an angle which can be any size and may be positive or negative.
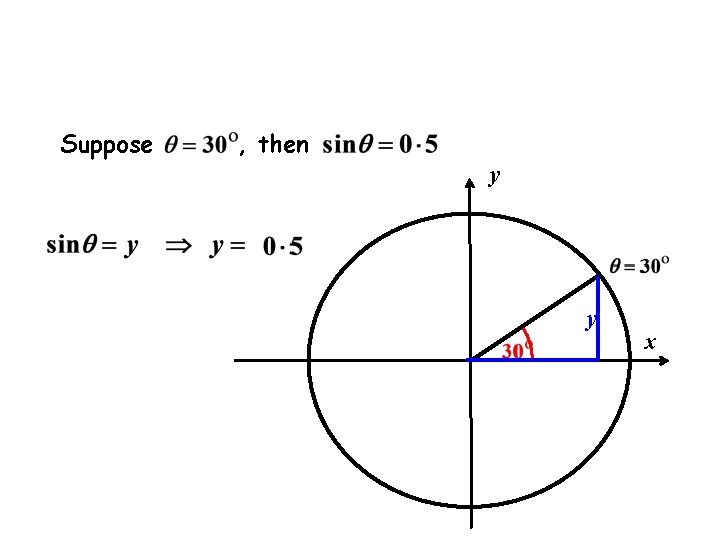
Suppose , then y y x
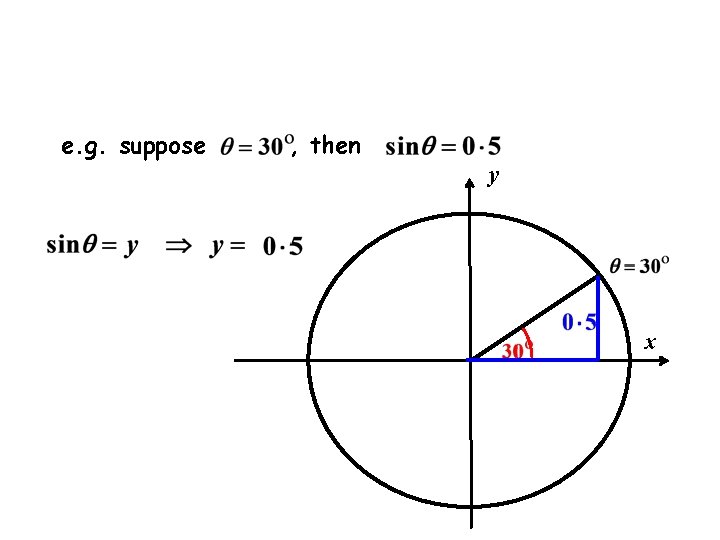
e. g. suppose , then y x
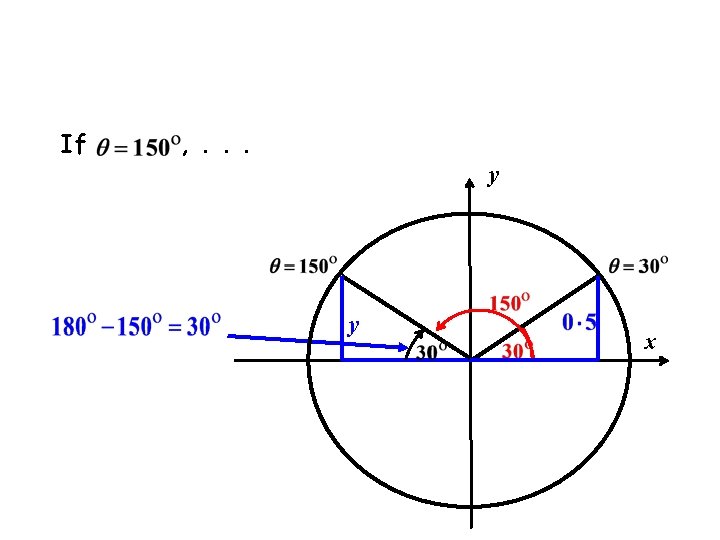
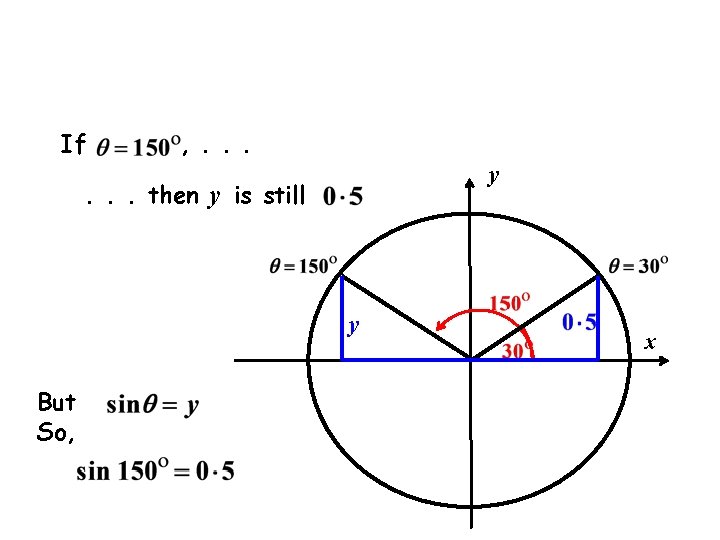
If , . . . y . . . then y is still y But So, x
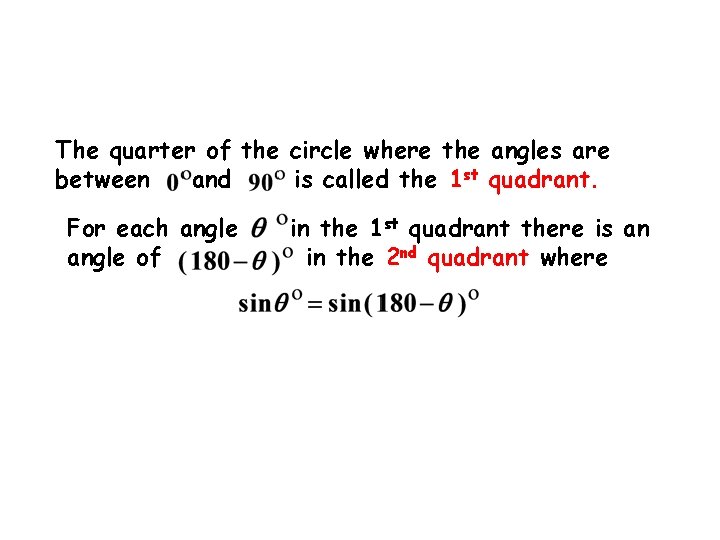
The quarter of the circle where the angles are between and is called the 1 st quadrant. For each angle of in the 1 st quadrant there is an in the 2 nd quadrant where
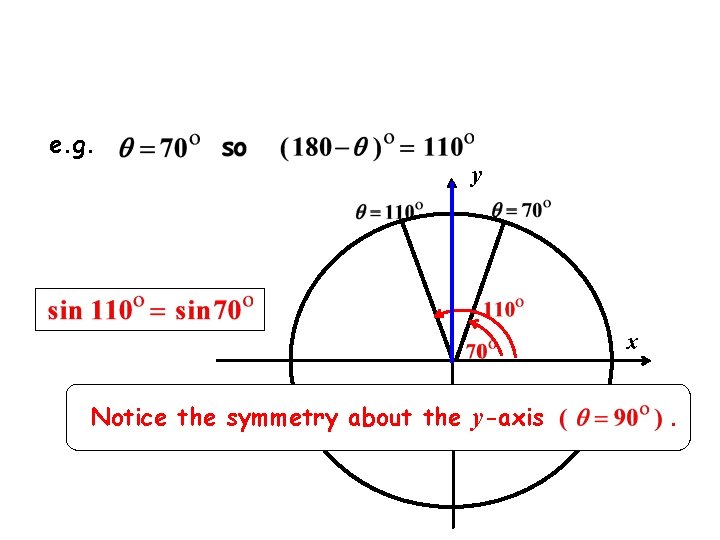
e. g. y x Notice the symmetry about the y-axis .
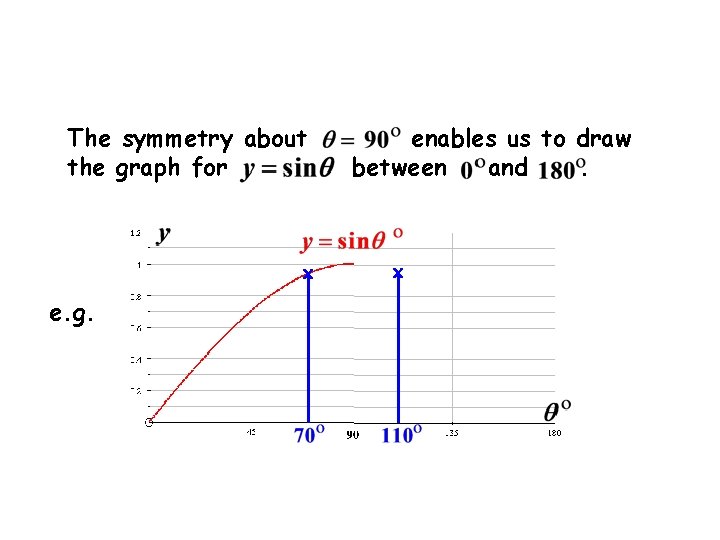
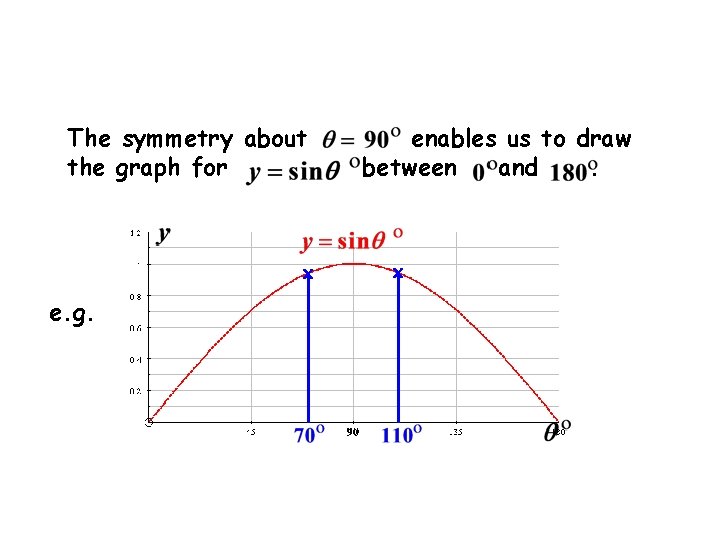
The symmetry about the graph for x e. g. enables us to draw between and. x
The symmetry about the graph for x e. g. enables us to draw between and. x
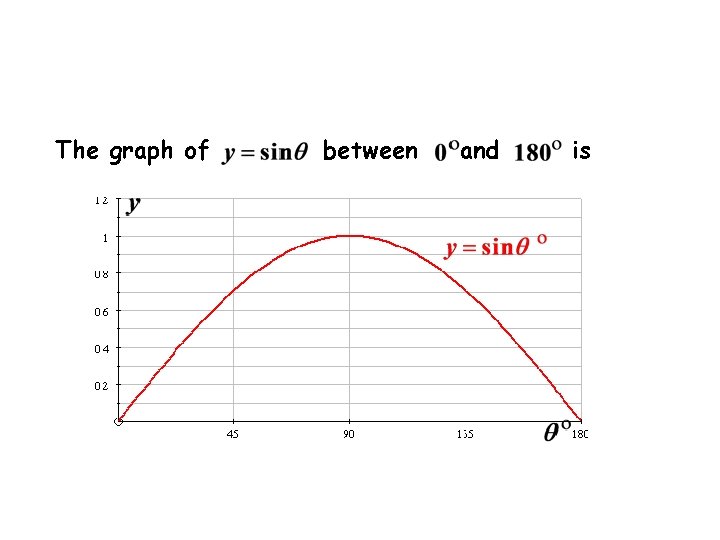
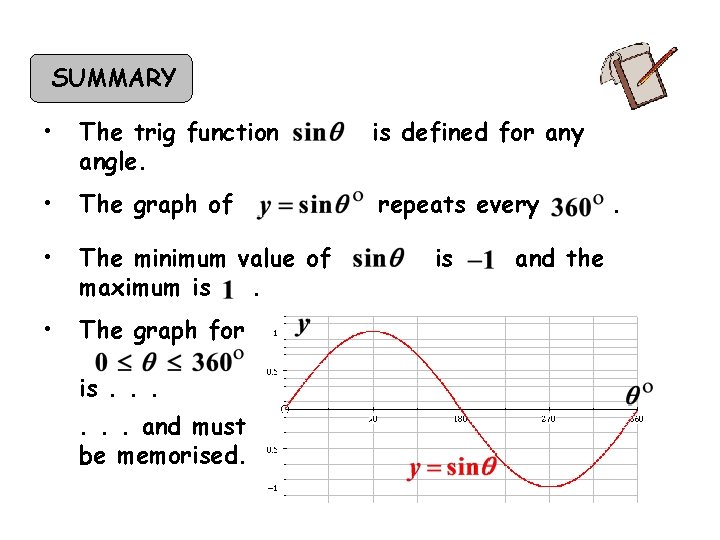
The graph of between and is
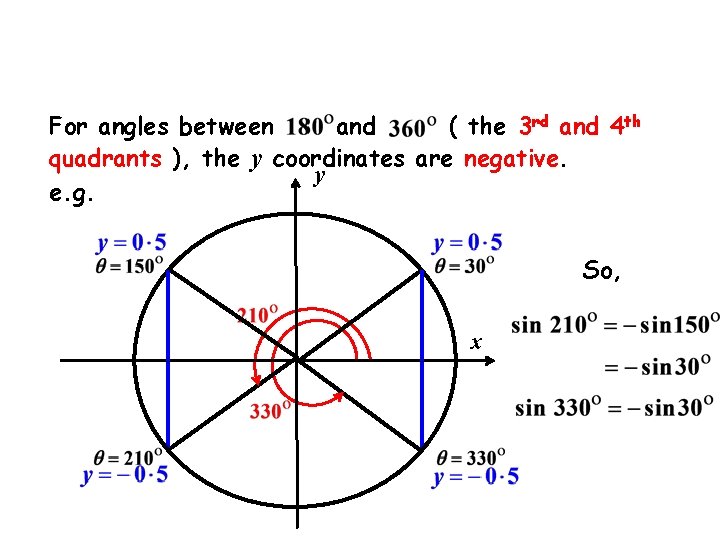
For angles between and ( the 3 rd and 4 th quadrants ), the y coordinates are negative. y e. g. So, x
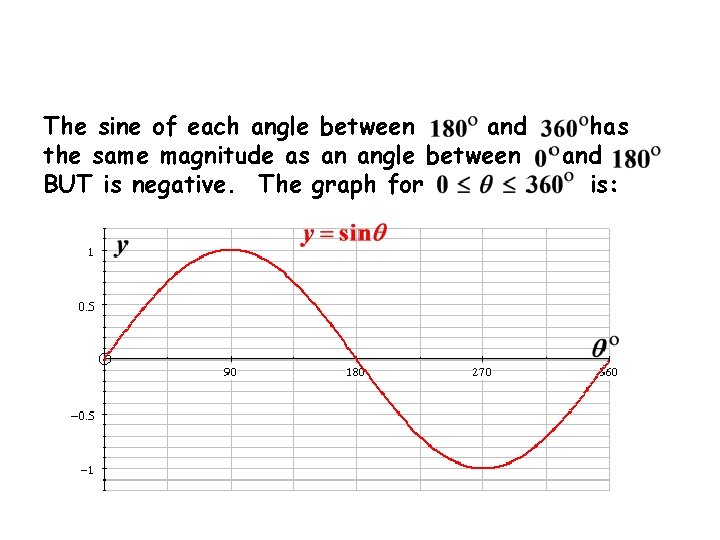
The sine of each angle between and the same magnitude as an angle between BUT is negative. The graph for has and is:
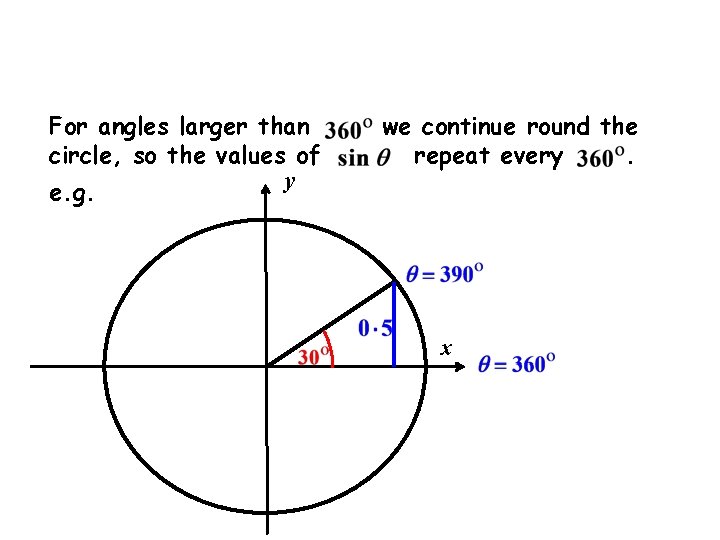
For angles larger than circle, so the values of e. g. y we continue round the repeat every. x
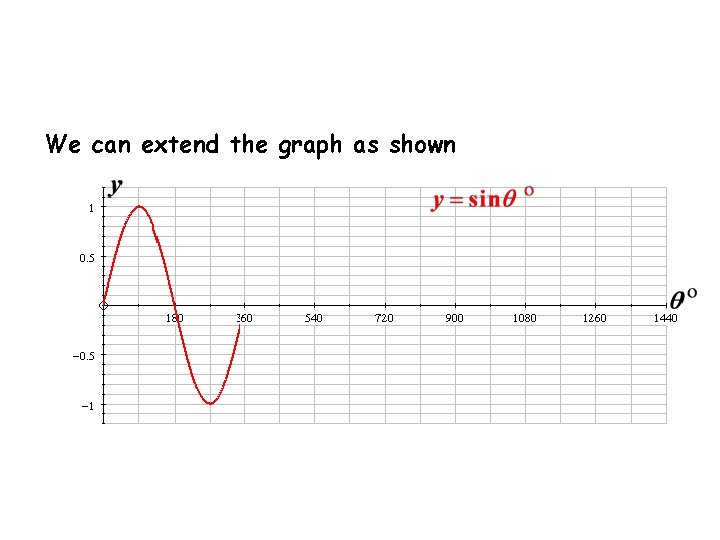
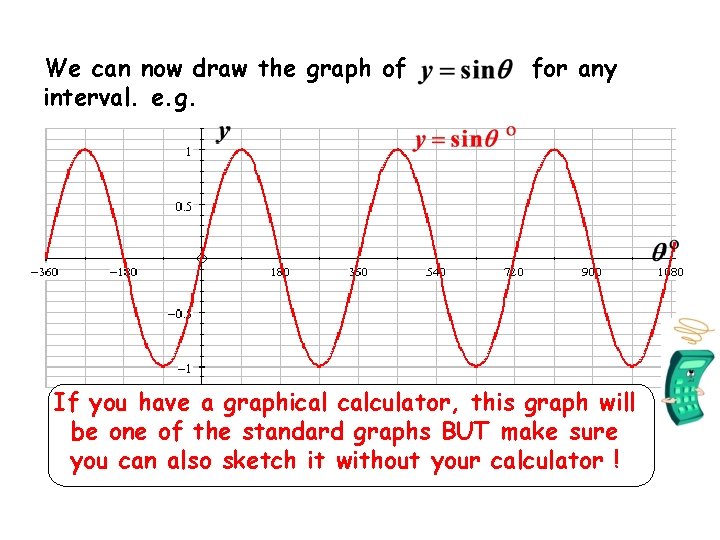
We can extend the graph as shown
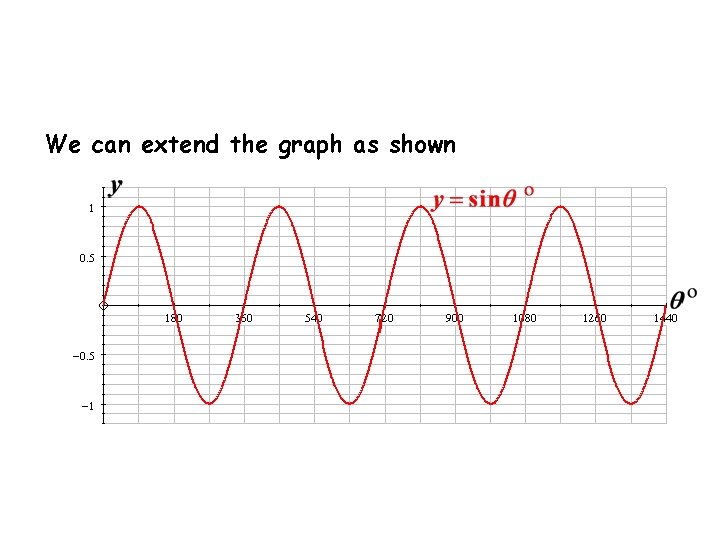
We can extend the graph as shown
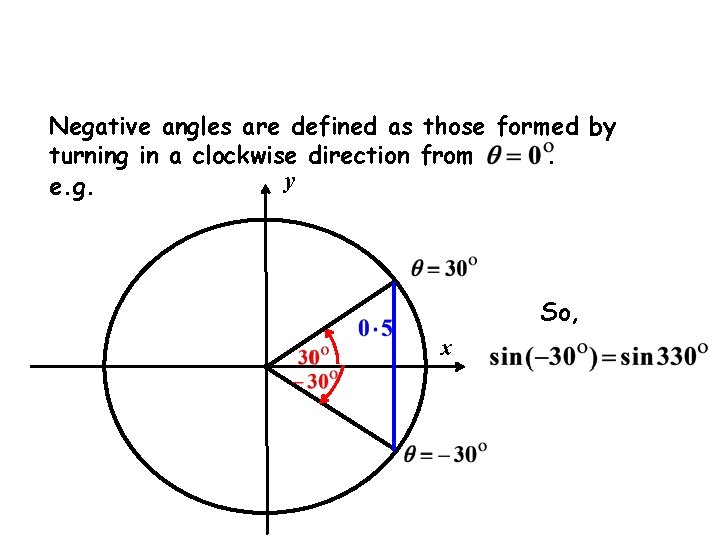
Negative angles are defined as those formed by turning in a clockwise direction from. y e. g. So, x
We can now draw the graph of interval. e. g. for any If you have a graphical calculator, this graph will be one of the standard graphs BUT make sure you can also sketch it without your calculator !
SUMMARY • The trig function angle. is defined for any • The graph of repeats every • The minimum value of maximum is. • The graph for is. . . and must be memorised. is and the .
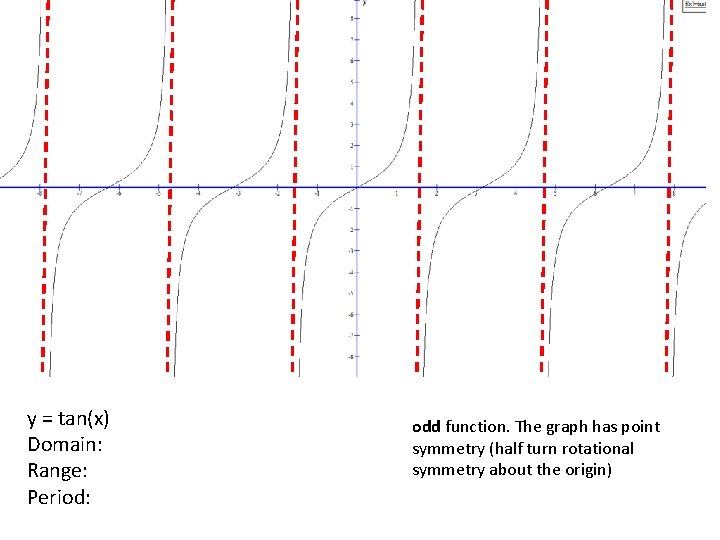
y = tan(x) Domain: Range: Period: odd function. The graph has point symmetry (half turn rotational symmetry about the origin)
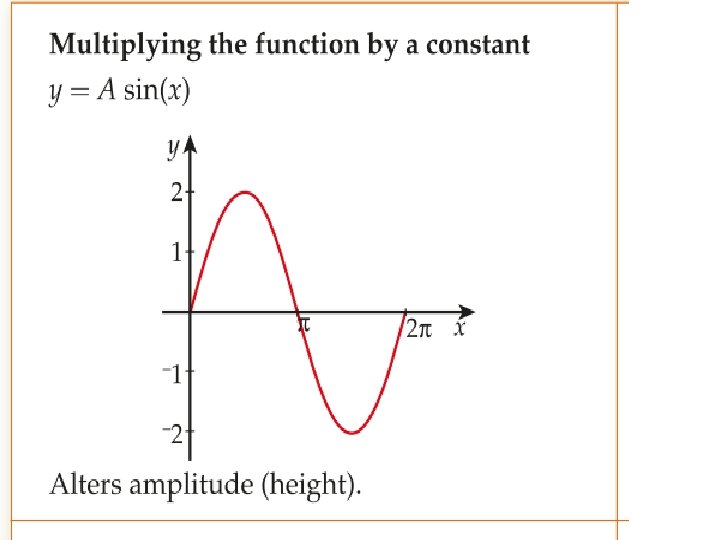
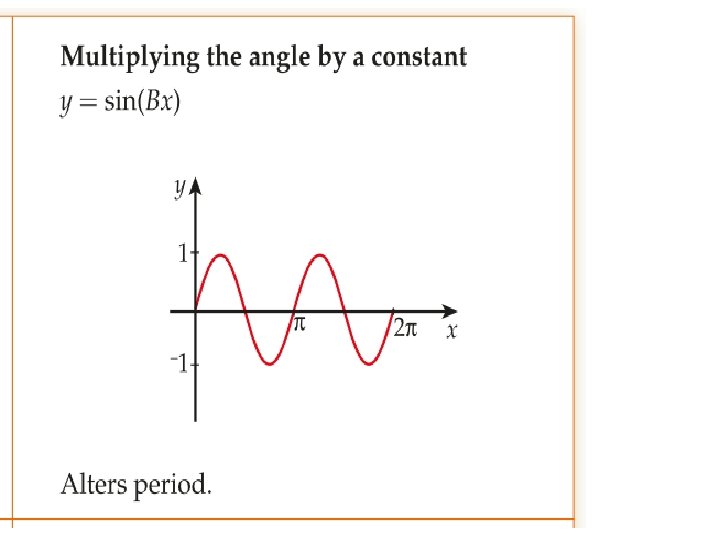
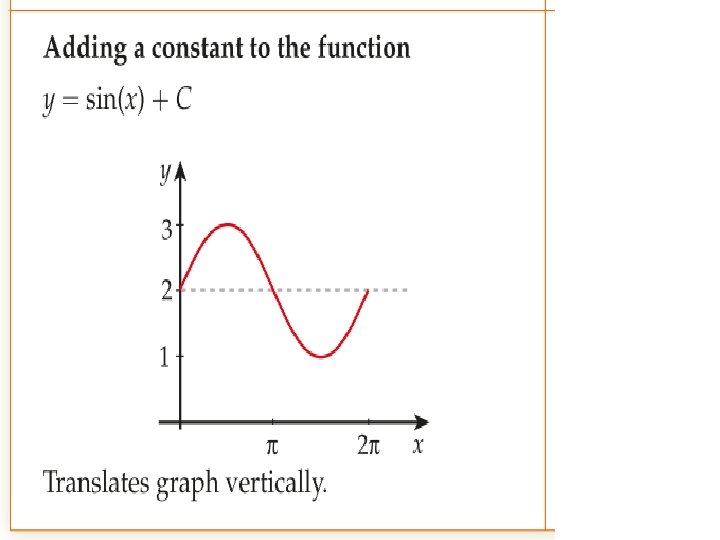
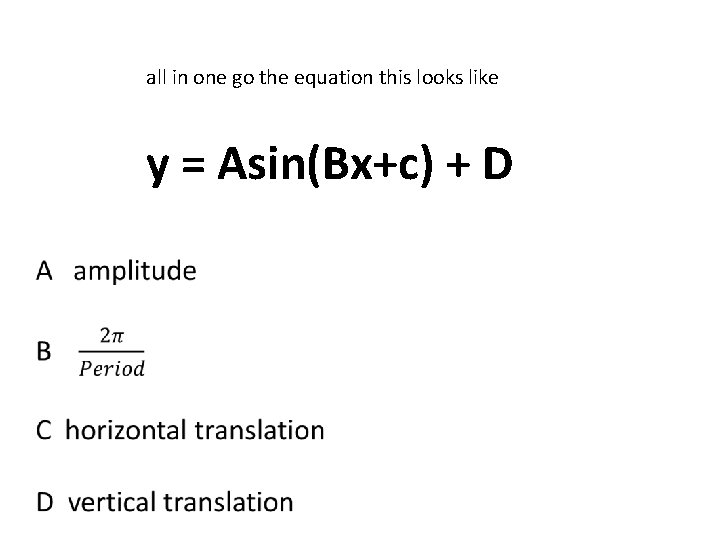
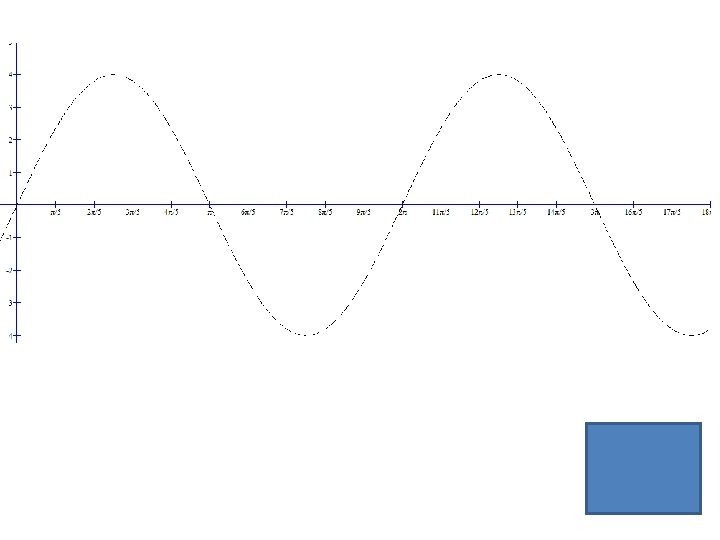
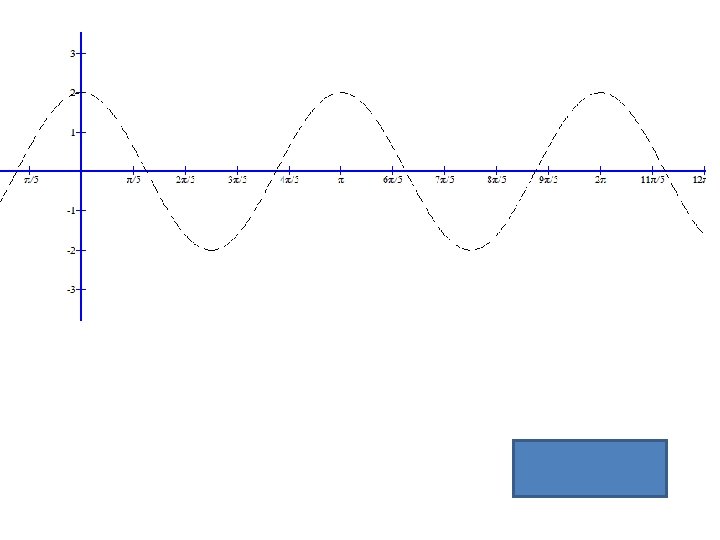
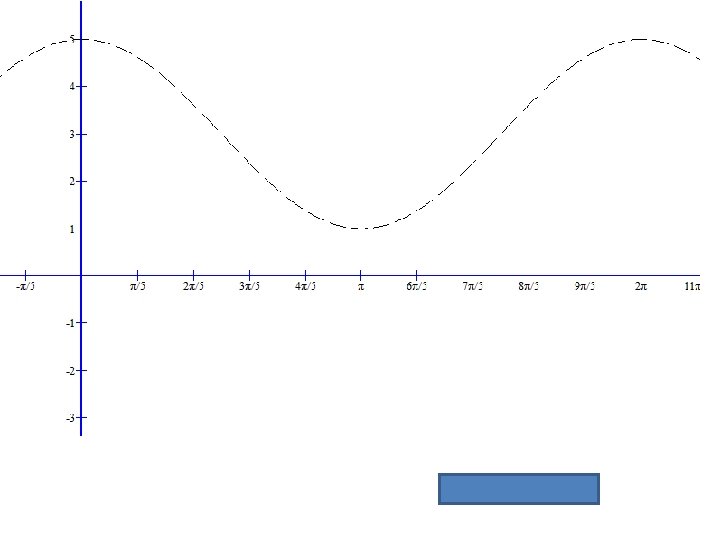
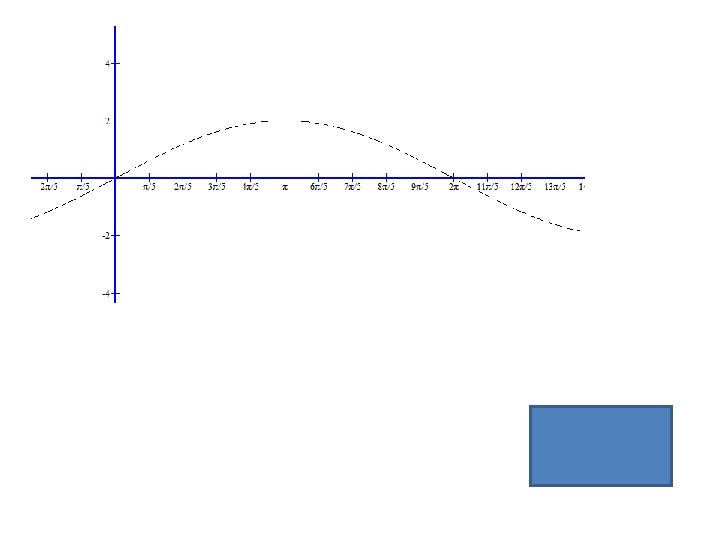
all in one go the equation this looks like y = Asin(Bx+c) + D
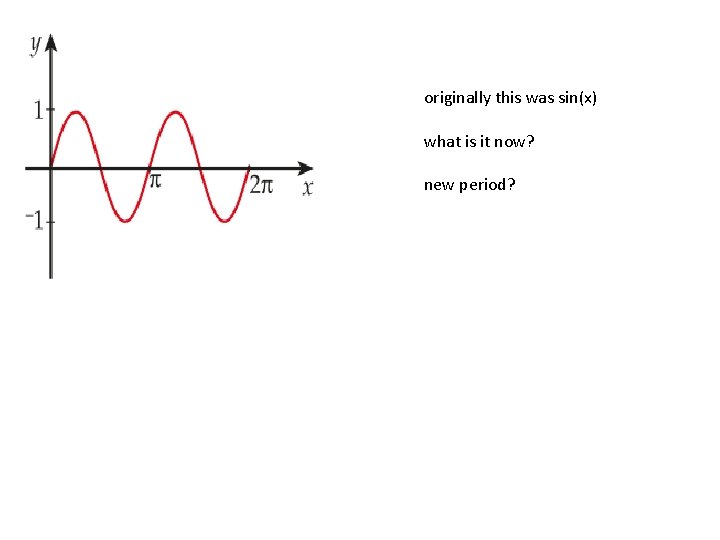
originally this was sin(x) what is it now? new period?
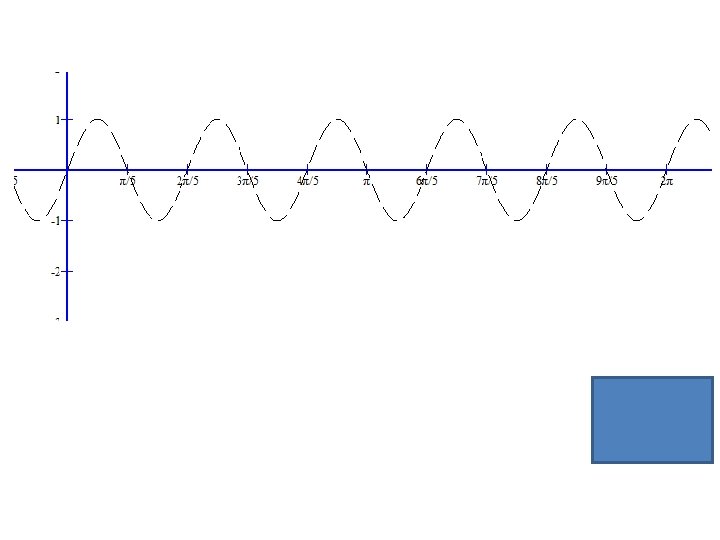
y = sin(5 x)
y = 5 sin(x)
y = 2 cos(2 x)
y = 2 cos(x) + 3
y = 2 sin(0. 5 x)