8 3 Graphing Rational Functions A reciprocal function

 is a linear")

 Determine the values of x for which is not defined. Set")


- Slides: 13
8. 3 Graphing Rational Functions
A reciprocal function has an equation of the form where a(x) is a linear function and a(x) ≠ 0.
The domain of a reciprocal function is limited to values for which the function is defined. Functions:
Example 1: a) Determine the values of x for which is not defined. Set the denominator ≠ 0 and solve. (x + 8)(x – 3) ≠ 0 x+8≠ 0 and x – 3 ≠ 0 x ≠ – 8 and x ≠ 3 Final answer: x ≠ – 8 , x ≠ 3 b) Determine the domain. All reals, x ≠ – 8 or 3
An asymptote is a line which a graph approaches, but never touches. These lines are shown as dotted on a graph, because they shape the graph, but are not truly a part of it.
Example 2: Identify the asymptotes, domain, and range of the function. Hasy: y = 0 Vasy: x = 2 Domain: all reals, x ≠ 2 Range: all reals, y ≠ 0
Example 3: Identify the asymptotes, domain, and range of the function. Hasy: y = 1 Vasy: x = – 2 Domain: all reals, x ≠ – 2 Range: all reals, y ≠ 1
Example 4: Identify the asymptotes, domain, and range of the function. Hasy: y = – 3 Vasy: x = 4 Domain: all reals, x ≠ 4 Range: all reals, y ≠ – 3
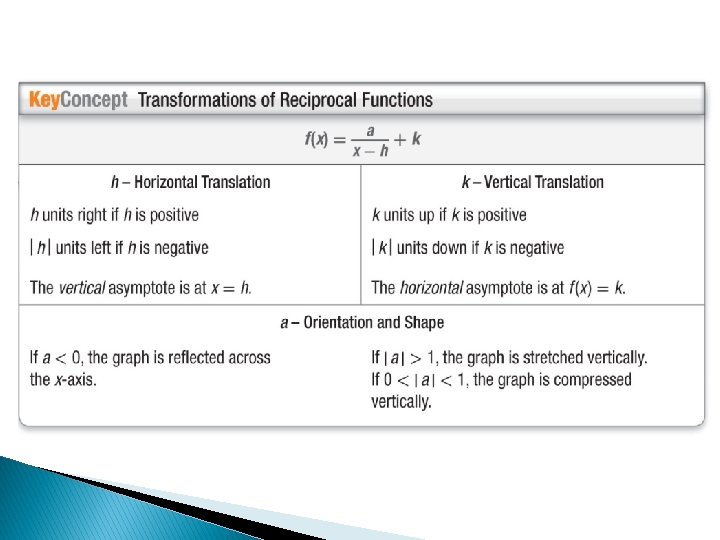
Let’s talk about shifts, summary. Asymptotes: x = h y=k Domain: All reals, x ≠ h Range: All reals, y ≠ k
To graph these functions, *Graph the horizontal and vertical asymptotes. *Plot points on both sides of the vertical asymptote. *Connect the points with a curve, and DO NOT cross the asymptotes.
Example 5: Graph the function State the domain and range. Hasy: y = 3 Vasy: x = – 1 Domain: all reals, x ≠ – 1 Range: all reals, y ≠ 3
Example 6: Graph the function State the domain and range. Hasy: y = – 1 Vasy: x = 2 Domain: all reals, x ≠ 2 Range: all reals, y ≠ – 1