Sampling Frequency and Jump Detection Mike Schwert ECON
- Slides: 11
Sampling Frequency and Jump Detection Mike Schwert ECON 201 FS 2/27/08
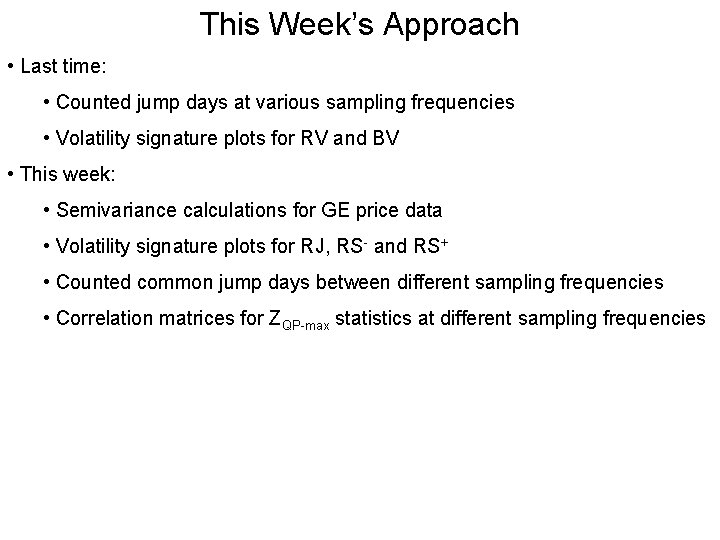
This Week’s Approach • Last time: • Counted jump days at various sampling frequencies • Volatility signature plots for RV and BV • This week: • Semivariance calculations for GE price data • Volatility signature plots for RJ, RS- and RS+ • Counted common jump days between different sampling frequencies • Correlation matrices for ZQP-max statistics at different sampling frequencies
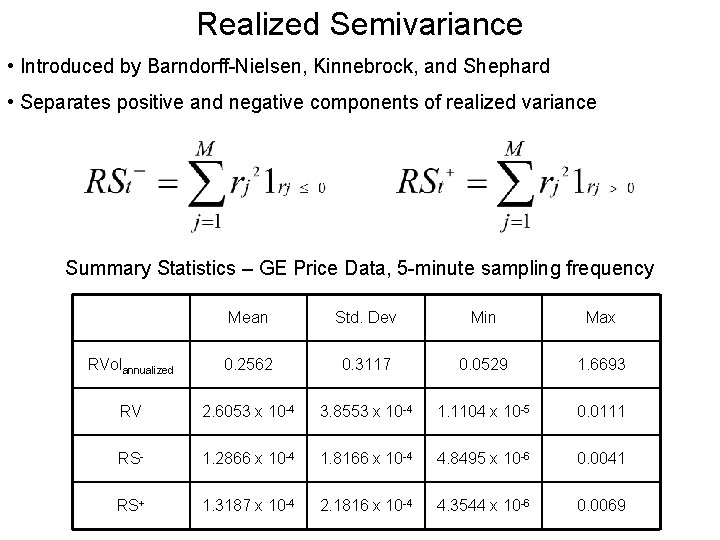
Realized Semivariance • Introduced by Barndorff-Nielsen, Kinnebrock, and Shephard • Separates positive and negative components of realized variance Summary Statistics – GE Price Data, 5 -minute sampling frequency Mean Std. Dev Min Max RVolannualized 0. 2562 0. 3117 0. 0529 1. 6693 RV 2. 6053 x 10 -4 3. 8553 x 10 -4 1. 1104 x 10 -5 0. 0111 RS- 1. 2866 x 10 -4 1. 8166 x 10 -4 4. 8495 x 10 -6 0. 0041 RS+ 1. 3187 x 10 -4 2. 1816 x 10 -4 4. 3544 x 10 -6 0. 0069
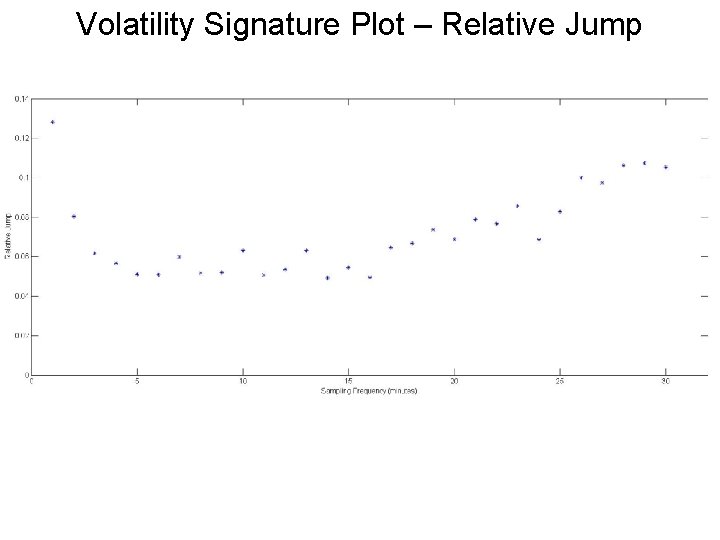
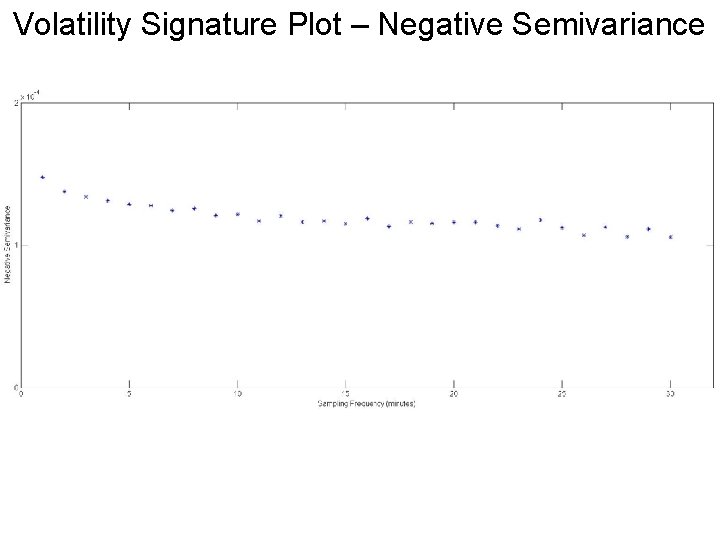
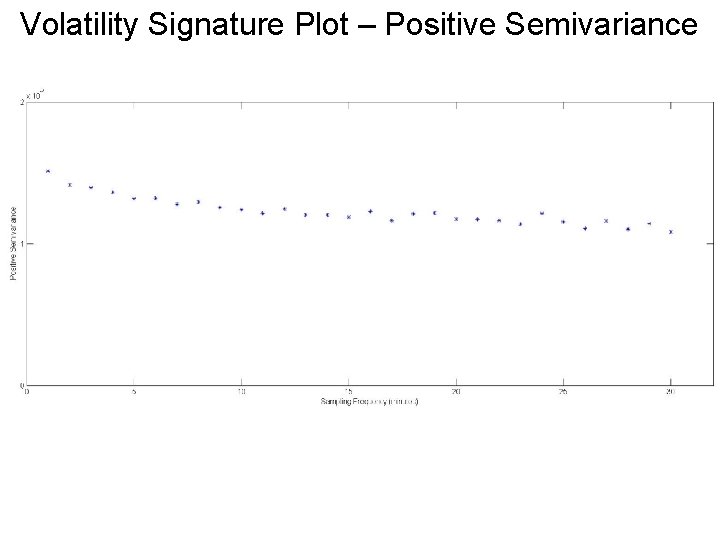
Volatility Signature Plots • Introduced by Andersen, Bollerslev, Diebold, and Labys (1999). • Calculate RJ, RS-, RS+ at 1, 2, …, 30 minute sampling frequencies • Plot relationship between sampling frequency and mean RJ, mean RS • RJ and RS are higher for high-frequency samples because returns are distorted by microstructure noise such as bid-ask bounce • Must be wary of using too low of a sampling frequency, as sampling variation will affect volatility calculations
Volatility Signature Plot – Relative Jump
Volatility Signature Plot – Negative Semivariance
Volatility Signature Plot – Positive Semivariance
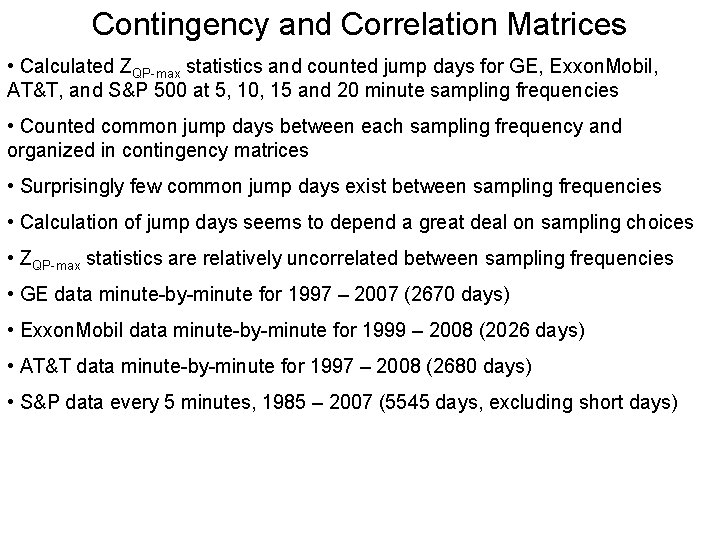
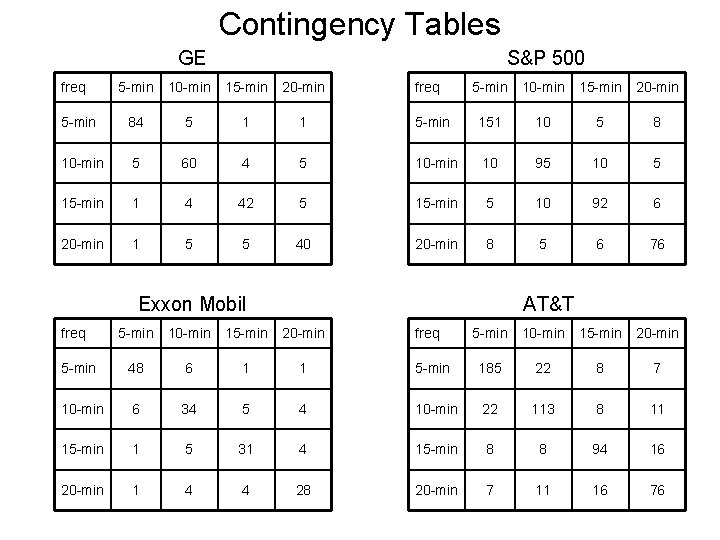
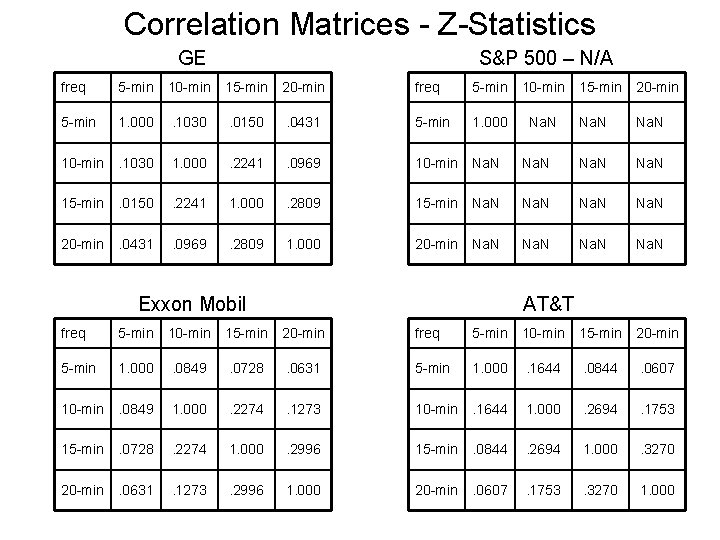
Contingency and Correlation Matrices • Calculated ZQP-max statistics and counted jump days for GE, Exxon. Mobil, AT&T, and S&P 500 at 5, 10, 15 and 20 minute sampling frequencies • Counted common jump days between each sampling frequency and organized in contingency matrices • Surprisingly few common jump days exist between sampling frequencies • Calculation of jump days seems to depend a great deal on sampling choices • ZQP-max statistics are relatively uncorrelated between sampling frequencies • GE data minute-by-minute for 1997 – 2007 (2670 days) • Exxon. Mobil data minute-by-minute for 1999 – 2008 (2026 days) • AT&T data minute-by-minute for 1997 – 2008 (2680 days) • S&P data every 5 minutes, 1985 – 2007 (5545 days, excluding short days)
Contingency Tables GE freq S&P 500 5 -min 10 -min 15 -min 20 -min 5 -min 84 5 1 1 10 -min 5 60 4 15 -min 1 4 20 -min 1 5 freq 5 -min 10 -min 15 -min 20 -min 5 -min 151 10 5 8 5 10 -min 10 95 10 5 42 5 15 -min 5 10 92 6 5 40 20 -min 8 5 6 76 Exxon Mobil freq AT&T 5 -min 10 -min 15 -min 20 -min 5 -min 48 6 1 1 10 -min 6 34 5 15 -min 1 5 20 -min 1 4 freq 5 -min 10 -min 15 -min 20 -min 5 -min 185 22 8 7 4 10 -min 22 113 8 11 31 4 15 -min 8 8 94 16 4 28 20 -min 7 11 16 76
Correlation Matrices - Z-Statistics GE S&P 500 – N/A freq 5 -min 10 -min 15 -min 20 -min 5 -min 1. 000 . 1030 . 0150 . 0431 5 -min 1. 000 Na. N 10 -min . 1030 1. 000 . 2241 . 0969 10 -min Na. N 15 -min . 0150 . 2241 1. 000 . 2809 15 -min Na. N 20 -min . 0431 . 0969 . 2809 1. 000 20 -min Na. N Exxon Mobil AT&T freq 5 -min 10 -min 15 -min 20 -min 5 -min 1. 000 . 0849 . 0728 . 0631 5 -min 1. 000 . 1644 . 0844 . 0607 10 -min . 0849 1. 000 . 2274 . 1273 10 -min . 1644 1. 000 . 2694 . 1753 15 -min . 0728 . 2274 1. 000 . 2996 15 -min . 0844 . 2694 1. 000 . 3270 20 -min . 0631 . 1273 . 2996 1. 000 20 -min . 0607 . 1753 . 3270 1. 000
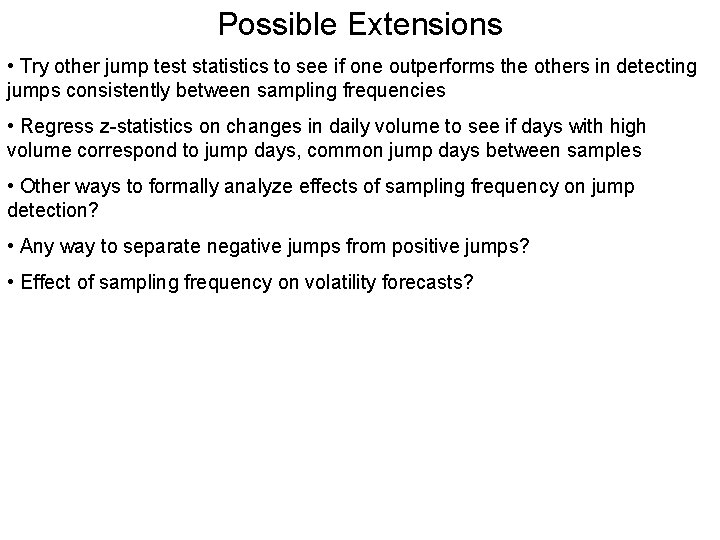
Possible Extensions • Try other jump test statistics to see if one outperforms the others in detecting jumps consistently between sampling frequencies • Regress z-statistics on changes in daily volume to see if days with high volume correspond to jump days, common jump days between samples • Other ways to formally analyze effects of sampling frequency on jump detection? • Any way to separate negative jumps from positive jumps? • Effect of sampling frequency on volatility forecasts?