Regulatory Impact Analysis Exercise Kent Shigetomi Office of

- Slides: 19
Regulatory Impact Analysis Exercise Kent Shigetomi Office of the U. S. Trade Representative Maputo, Mozambique May 21 -22, 2018
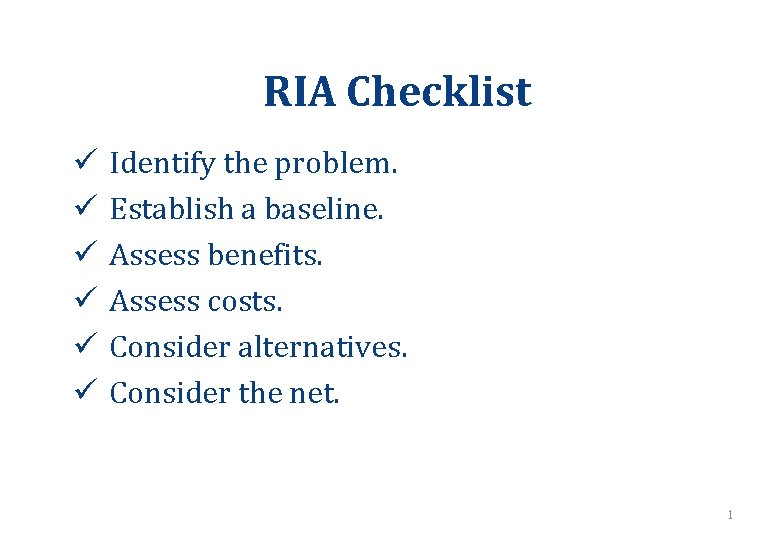
RIA Checklist ü ü ü Identify the problem. Establish a baseline. Assess benefits. Assess costs. Consider alternatives. Consider the net. 1
Identify the problem to establish the need for the regulatory action. 2
RIA Case Study: Warning Labels for Cigarette Packages PROBLEM: Insufficient/ineffective information available to the public regarding the harmful health effects of smoking cigarettes. Market failure: information asymmetry and lack of information salience (lack of attention to and ineffectiveness of existing cigarette health labels). Other examples? Externalities, market collusion 3
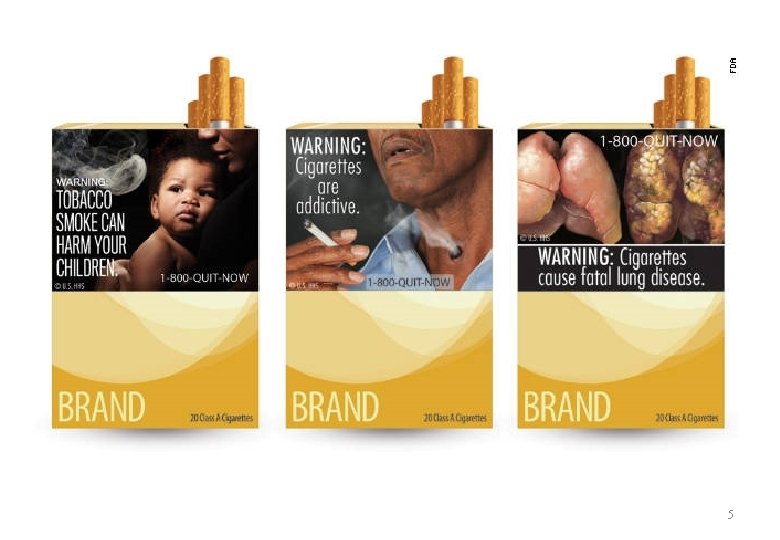
RIA Case Study: Warning Labels for Cigarette Packages • One of nine new health warnings to be displayed directly, and on the upper portion and rear panel of cigarette packages. • Health warnings must be included in advertisements for cigarettes. • Cigarette labels must include information on resources to assist individuals to quit smoking. 4
5
Establish the baseline. What does the world without the regulation look like? 6
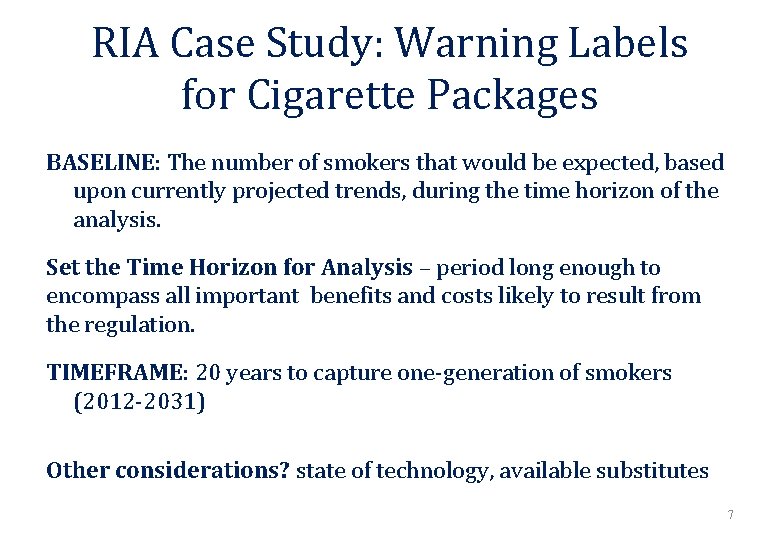
RIA Case Study: Warning Labels for Cigarette Packages BASELINE: The number of smokers that would be expected, based upon currently projected trends, during the time horizon of the analysis. Set the Time Horizon for Analysis – period long enough to encompass all important benefits and costs likely to result from the regulation. TIMEFRAME: 20 years to capture one-generation of smokers (2012 -2031) Other considerations? state of technology, available substitutes 7
Assess the benefits. How do proposed solutions improve on the problem? 8
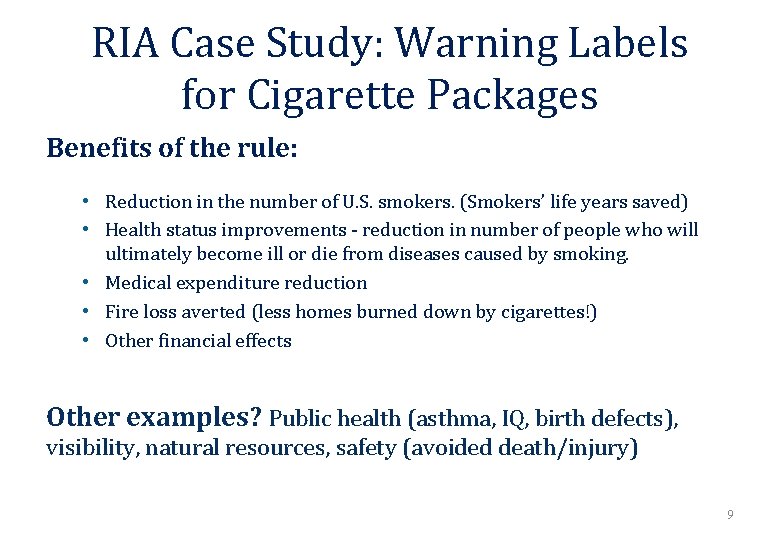
RIA Case Study: Warning Labels for Cigarette Packages Benefits of the rule: • Reduction in the number of U. S. smokers. (Smokers’ life years saved) • Health status improvements - reduction in number of people who will ultimately become ill or die from diseases caused by smoking. • Medical expenditure reduction • Fire loss averted (less homes burned down by cigarettes!) • Other financial effects Other examples? Public health (asthma, IQ, birth defects), visibility, natural resources, safety (avoided death/injury) 9
How much do you think a life is worth? How much do you think a an extra year of life is worth? 10
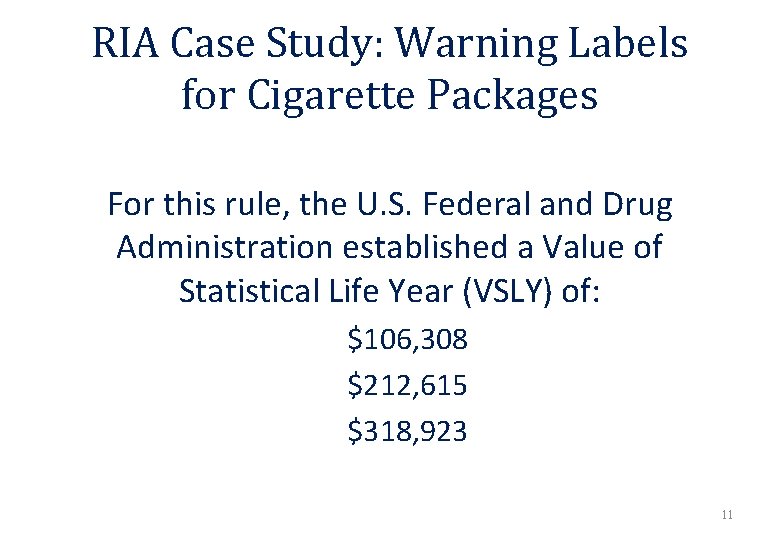
RIA Case Study: Warning Labels for Cigarette Packages For this rule, the U. S. Federal and Drug Administration established a Value of Statistical Life Year (VSLY) of: $106, 308 $212, 615 $318, 923 11
Assess the costs. What costs do the proposed solutions impose? 12
RIA Case Study: Warning Labels for Cigarette Packages Costs of the rule: • Manufacturing costs to change cigarette labels. • Market testing of new cigarette package labels. • Recordkeeping and administrative costs to ensure equal and random display of 9 warning labels over time. • Costs to manufacturers and retailers to remove point of sale advertising that does not comply with the regulation. • Government cost associated with administering and enforcing the regulation. Other examples? Available substitutes? Loss to society? Distributional impacts – who bears costs (e. g. supply chains)? 13
RIA Case Study: Warning Labels for Cigarette Packages Best Practices: • Quantify and Monetize the Benefits and Costs of the Regulation using the best obtainable scientific, technical, economic and other information. • Discount Future Benefits and Costs • Evaluate Non-Quantified and Non-monetized Benefits and Costs (those that are difficult or impossible to quantify/monetize) • Characterize uncertainty in benefits, costs, and net benefits. 14
Consider alternatives. What trade offs do alternate approaches present? 15
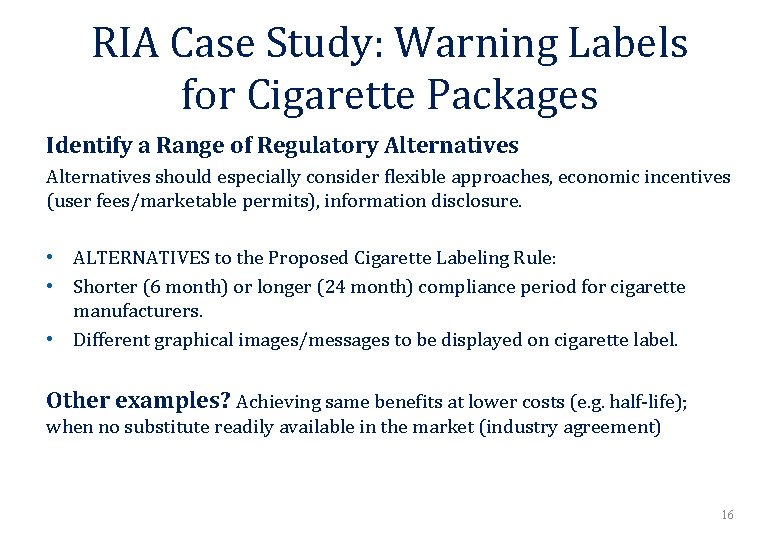
RIA Case Study: Warning Labels for Cigarette Packages Identify a Range of Regulatory Alternatives should especially consider flexible approaches, economic incentives (user fees/marketable permits), information disclosure. • ALTERNATIVES to the Proposed Cigarette Labeling Rule: • Shorter (6 month) or longer (24 month) compliance period for cigarette manufacturers. • Different graphical images/messages to be displayed on cigarette label. Other examples? Achieving same benefits at lower costs (e. g. half-life); when no substitute readily available in the market (industry agreement) 16
Consider the Net. What approach maximizes net benefits? 17
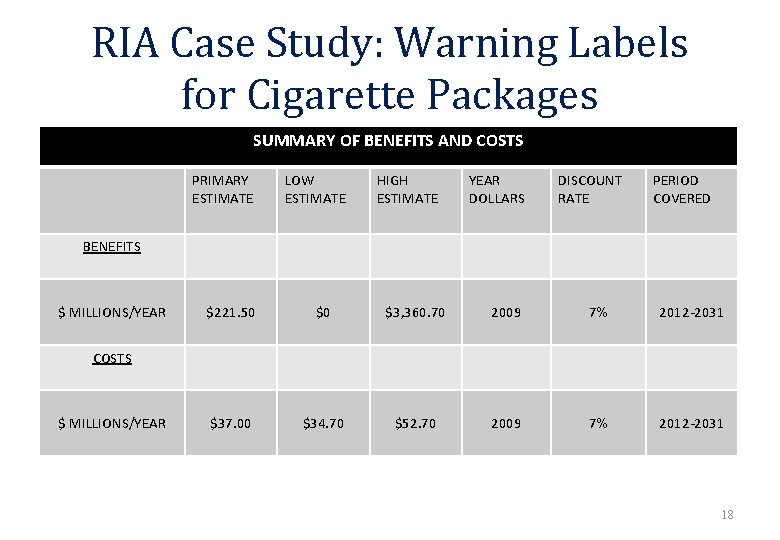
RIA Case Study: Warning Labels for Cigarette Packages SUMMARY OF BENEFITS AND COSTS PRIMARY ESTIMATE LOW ESTIMATE HIGH ESTIMATE YEAR DOLLARS DISCOUNT RATE PERIOD COVERED BENEFITS $ MILLIONS/YEAR $221. 50 $0 $3, 360. 70 2009 7% 2012 -2031 $37. 00 $34. 70 $52. 70 2009 7% 2012 -2031 COSTS $ MILLIONS/YEAR 18