Prominence Eruption and Coronal Mass Ejection A Statistical


 had clear")


: The prominences with large height have")
 and Transverse (active) events Radial")
- Slides: 23
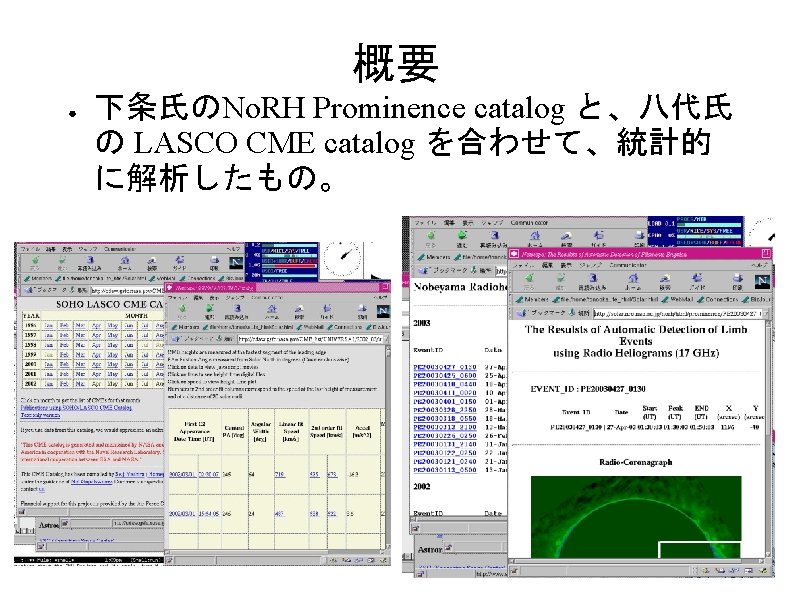
Prominence Eruption and Coronal Mass Ejection: A Statistical Study Using Microwave Observations Gopalswamy, N. ; Shimojo, M. ; Lu, W. ; Yashiro, S. ; Shibasaki, K. ; Howard, R. A. Ap. J, 586, 562 -578, 2003 太陽雑誌会 2003/4/28 殿岡 英顕
2. Data Selection ● ● ● Automatic detection of limb events at No. RH 17 GHz, from 1996 January 1 to 2001 December 31. SOHO LASCO C 2 and C 3, corresponding to the prominence events. 186 events total (excluding SOHO major datagap)
3. 1 Prominence trajectories Fig 1: Typical prominence trajectories
Fig 2. Time-height plot ● ● T for Transvers e, 34/186 R for Radial, 152/186
3. 2 Prominence heights Fig 3. Max height
3. 3 Prominence velocities Fig 4. Average speed
Fig 5. Speed vs. Height
4. Relation between CMEs and PEs Table 1: measured properties
Fig 6. CMEProminence relationship with association ● An eruptive prominence of 2000 Oct 22.
Fig 7. CMEProminence relationship without association ● ● An prominence erupton event of 2001 Aug 29 No discernible change on LASCO observations.
Table 2: Statistical properties
Fig 8. Height histograms ● ● 134/186 PEs were associated with CMEs, 34 no associated CMEs, 11 streamer change. CME+PE events: faster and larger heights
4. 1 Source latitude Fig 9. Latitude distribution ● ● PE distributions: – 2 peaks – events from almost all latitudes – 3 from eqator CME distributions: – One broad peak centered on the equator – almost all latitudes
Fig 10: Solar cycle variation ● ● CME and PE latitude vs Carrington rotation number CME and PE occur at all latitudes during solar maxima and close to equator during solar minimum.
4. 2 Timing relationship Fig 11: The difference between two onset time ● Onset times of PEs and CMEs are roughly the same within +/- 0. 5 hr.
4. 3 Spatial relationship Fig 12: Spatial relationship ● ● The latitude offsets of PEs and CMEs. More events with positive offsets The latitude of CMEs is closer to the equator than that of corresponding prominence. Positive offset before 2000.
4. 4 Core association Fig 13: An example of the prominence. CME association ● ● 2001 Dec 19 -20 Radio+EIT 195+ LASCO
Fig 14: Speed distribution of CME, core and PE ● 98/134 (73%) had clear whitelight cores.
Fig 15: Core speed vs PE speed ● ● Core speed is always greater than PE speed fast PEs associated with fast cores (? )
4. 5 Streamer events Fig 16: An example of streamer event ● ● 1998 June 1 PE 1. 24 Rsun (initial) to 1. 28 Rsun (final) streamer expanded 11/52 = 21% were associated
5. Discussions ● ● Munro et al. (1979): The prominences with large height have better association with CMEs. Gilbert et al. (2000): CME associations are different (They are larger). Hori & Culhane (2002): association with CMEs 92% vs 76%. The difference of selection criteira. Yang & Wang (2002): association rate 10 to 30%, 65% for Gopalswamy's check.
6. Summary and conclusions ● ● ● Radial (eruptive) and Transverse (active) events Radial events showed close relationship to the CMEs (83%). 73% of all the PEs were associated with CMEs. Onsets of PEs and CMEs were nearly simultaneous, within 30 min. CPAs of CMEs and PEs generally did not coincide. CMEs – equator, PEs- AR belt for minimum, no such relationship for solar maximum.