POTENTIAL METHODS 2018 2019 Part 4 Rock Densites


 mineral composition")


")


 From: Allen,")

: Thereby is z the")
 Measure weight of rock in air on the")


. Relation for crystalline rocks M: mean atomic")


- Slides: 32
POTENTIAL METHODS 2018 -2019 Part 4 Rock Densites Carla Braitenberg Trieste University, DMG Home page: http: //www 2. units. it/~braitenberg/ e-mail: berg@units. it Tutor Tommaso Pivetta Email: tommasopivetta@yahoo. it 1
Overview Chapter refers to Chapter 4 of textbook Hinze et al, 2013. The density of earth materials is defined, since it is the basic parameter necessary for modeling. The density is discussed for: rock type, depth dependence, age dependence, temperature and pressure effect.
Density of inomogeneous rock •
Density in earth Interior •
Moment of inertia of the Earth is smaller than expected for a homogeneous sphere os the same mass. therefore mass is concentrated towards the center of the earth.
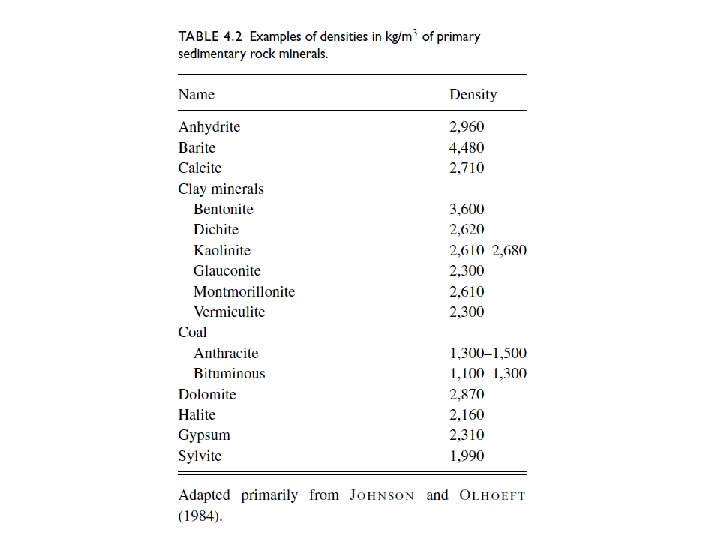
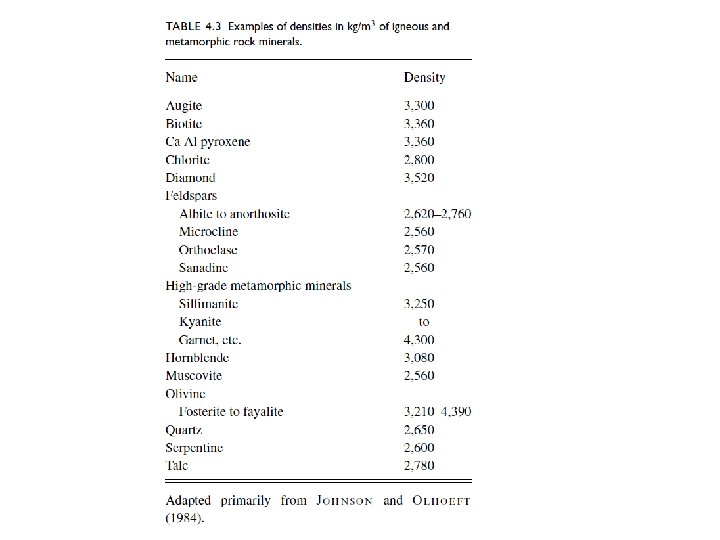
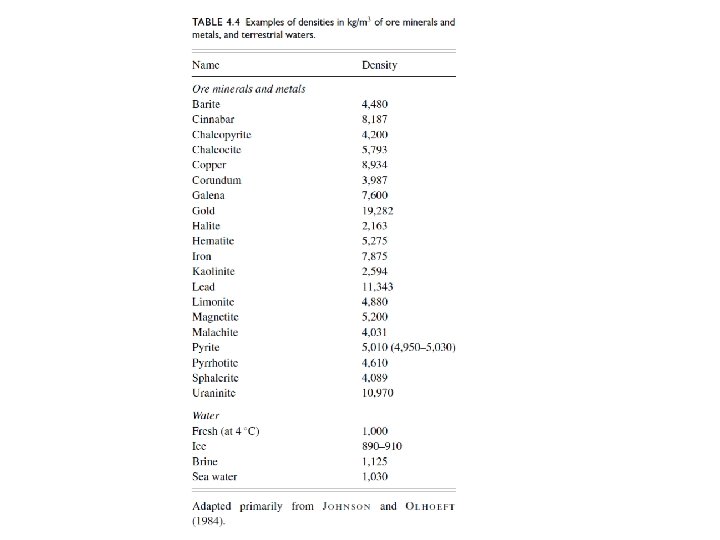
Rock density dependance: which are the primary controls of rock density 1) mineral composition 2) percentage of void space • Depending on: lithology, secondary chemical and physical effects (fracturing, dissolution, chemical alteration of minerals). • Mineral density: majority 2500 to 3500 kg/m 3 • Ore minerals: 4000 -6000 kg/m 3 • Density of minerals decreases with increase of Si. O 2 content. Also decreases with increase of H 2 O content. • Minerals that formed under high pressure in metamorphic rocks have higher density • Non-metalliferous resources (coal, salt, clay) have low density • Metalliferous ores: higher density • Lithostatic pressure increase: higher density • Temperature increase: lower density
Classification of rocks used for density values discussion. Crystalline Rocks Igneous rocks - Plutonic - Volcanic Sedimentary Rocks Metamaorphic Rocks Unconsolidated Sediments
Crystalline Rocks • Unaltered plutonic rocks: only 1% voids, due to weathering, faulting. Fractures close due to lithostatic pressure. Densities and velocities approach constant values at pressures > 600 MPa, reached at 15 -20 km of depth. • Density is governed by the mineral composition. • Felsic to mafic: increase of density, due to smaller portion of Si. O 2, and higher portion of Ca, Fe and Mg.
Crystalline crust- Continental Crust • Composition becomes more mafic with depth, so density increases. This is only a general rule- strong lateral density contrasts can be present also in mid-crust. For instance due to large strike-skip fualts. See example in next slide. Overall average of upper crust is 2670 kg/m 3. therefore this value is used as standard for the topographic reduction to obtain the Bouger anomaly. • According to a global analysis of Christensen and Mooney (1995) the average crustal density is 2830 kg/m 3. • Lower crust: average composition of Gabbro. Base of crust: mafic garnet granulite
Average crustal profile according to Christens and Mooney (1995)
Density for Oceanic crust • Layering: Sediments, mafic extrusive rocks, mafic intrusice rocks. • Variations due to: age, metamorphic grade • Layer below sediments: lavas extruded on seafloor (density 2620 -2690 kg/m 3) • Lowermost crustal layer: 1920 to 2970 kg/m 3
Density of Upper mantle • Ultramafic upper mantle: 3270 -3320 kg/m 3, on average: 3300 kg/m 3 • Peridotite: principal lithology • Eclogite: 3500 kg/m 3 • Depleted mantle rocks, that have undergone partial melting, depleted in Ca, Fe, Al, Ti, and are rich in olivine and Mg content have lower density. • Compositional differences to density variation. Example SW USA, 3% density variation (100 kg/m 3). • Thermal-petrologic-seismological model. Allows to calculate density and seismic velocity for crust and mantleconditions of pressure and temperature: Hacker et al, 2003; 2004; New version: Abers and Hacker, 2016, JGR. https: //agupubs. onlinelibrary. wiley. com/doi/full/10. 1002/2015 GC 0 06171
Illustration of a crustal section with density increase with depth, but also with strong lateral variation due to crustal fault.
Moho- crust-mantle discontinuity • Moho is an important density boundary- it is responsible of a strong gravity signal. • Density jump across boundary: 200 to 450 kg/m 3. • Gravity signal due to depth variations of Moho. Shallow Moho equivalent to mass increasedeep Moho corresponds to mass deficit due to crustal root. Responsible of mass compensation below orogens.
Igneous rocks • Volcanic and extrusive igneous rocks: more fine grained compared to intrusive plutonic rocks. Fine grained texture tends to have lower density, but effect is less than 10% for equal composition. • Volcanic ash: highly porous. Deeper levels are more compacted (see figure of nevada tuffs)
Density increase due to compaction.
Metamorphic rocks • Density reflects original mineral composition of rocks • Depends also on T and P conditions that rock underwent. • In general the higher content in iron and calcium increases density.
Sedimentary rocks and unconsolidated sediments • Density of sediments is controlled by the amount of void space. • Overburden leads to compaction and pore and cracks closure. • The variation of density is well represented by an exponential function. For shallow depths it is approximated by a linear variation. The linear variation should not be extrapolated to depths higher than a few km.
DENSITY AS A FUNCTION OF DEPTH Density driven by compaction, not lithology Due to the depositional environment and tectonic history of the Gulf of Mexico (and other similar basins), rock densities of the sedimentary section have been found to vary primarily as a function of burial depth. This density-depth relationship is attributed to the very thick (~6000 m) pile of clastic sediments that comprise the Gulf basin onshore and offshore. This density-depth relationships have been extensively used to model gravity anomalies and to identify salt structures in the subsurface. DENSITY VS. DEPTH CROSSPLOT FOR OFFSHORE GULF OF MEXICO STUDY AREA. NOTE THE PRESENCE OF SALT AT 750 TO 1000 METERS DEPTH.
Porosity= pore volume / bulk volume Density= bulk density * (1 -porosity) From: Allen, P. A. and Allen, J. R. , 2005. Basin Analysis: Principles and Applications, 2. ed. , Blackwell Publishing, 549 pp.
Giles, M. R. , 1997. Diagenesis: A quantitative perspective. For basin modeling and rock property prediction. Kluwer academic Publisher, Dordrecht. Copied from Allen, P. A. and Allen, J. R. , 2005. Basin Analysis: Principles and Applications, 2. ed. , Blackwell Publishing, 549 pp.
In Litho. Flex (after Braitenberg et al. 2006, Wienecke 2006): Thereby is z the depth and Ф 0 the initial [Porosity] of the sediments at the surface. The bulk density of a rock is composed of the [Fluid density] ρf and the [Grain/Rock density] ρs related to the porosity of the sediments.
Measurements of Rocks’ density Procedure: 1) Measure weight of rock in air on the plate of the scale Weight=P 1 2) Measure weight of rock in water by hanging it with a chain below the scale Weight=P 2 3) Repeat the measurements so as to able to calculate the repeatability of the measurement through the standard deviation. Note: P 2 is lighter due to Archimede’s force. The equivalent weight is equal to the weight of the water displaced by the rock. P 2 is equal to the rock’s volume (V) multiplied by the water density (ρ w) P 2=P 1 -Vρacqua The precision of the density measurement is inversely proportional to the volume of the rock sample and proportional to the precision of the scale.
Density dependence on temperature and pressure • Lithostatic pressure has effect of increasing density also in crystalline rocks. Increase is related to elastic bulk modulus • Rho(P 2)=Rho(P 1)(1+(P 2 -P 1)/K) • P 2, P 1: pressure values. K: bulk modulus in Gpa (for upper crust: K=52 Gpa, lower crust: 75 Gpa, upper mantle: 130 GPa, Dziewonski and Anderson, 1981). • Temperature has a minor role. Volume thermal expansion coefficients are 20 -40 10^-6/°C. • One example of modification of the pressure equation, taking into account the temperature variation: • Rho(P 2)=Rho(P 1)( 1+ (P 2 -P 1)/K – α ΔT) • α is the coefficient of thermal expanion, and ΔT is the change in temperature. (After Ravat et al. 1999)
Density from seismic methods • Seismic models are used to constrain density models due to the good correlation between density and seismic velocity. • The relation between density and velocity is described with empirical relations based on laboratory measurements of rock specimens. In practice it is necessary to correct the density for the in situ cinditions of temperature and pressure. • The empricial relations have been compiled for certain rocks by different authors. Care should be taken to analyze the probable rocks present in the model and choose the right relation.
Examples of famous relations • Birch (1961). Relation for crystalline rocks M: mean atomic weight of rock. A(M) and b are the parameters. Vp: compressional velocity in km/sec Ρ: density in kg/m^3 Christensen and Mooney (1995). Very important paper. Crustal rocks linear relation: Dortmann(1976). Compilation of igneous and metamorphic rocks. Linear relation by Schön (1996): Brocher(2005) made an important paper with a broad compilation of existing relations and defined a new relation for the velocity range 1. 5 to 8. 5 km/s. Garnder et al. (1974) defined a relation for sedimentary rocks:
Non-linear relation between density and velocity for igneous and metamoprohic rocks.
Density vs. velocity after Brocher Density ρ and velocity have in isotrope, elastic media simple relations: κ: compressibility modus μ: shear (rigidity) modus E: elasticity module ν: Poisson ratio Brocher 2005
Natural density (saturated bulk density of igneous, metamorphic, sedimentary rocks, and sediments and soils.