Nora Schindler M Sc WU The Missing Money



- Slides: 17
Nora Schindler, M. Sc. (WU) The Missing Money Problem The effect of diminishing wholesale prices on investments in power generating plants 26 th of October 2015 “The Dynamic Energy Landscape” USAEE Pittsburgh
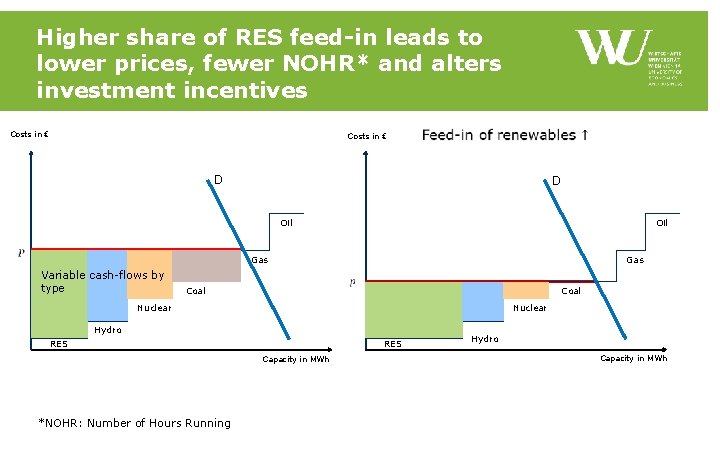
Higher share of RES feed-in leads to lower prices, fewer NOHR* and alters investment incentives Costs in € D D Oil Gas Variable cash-flows by type Gas Coal Nuclear Hydro RES Capacity in MWh *NOHR: Number of Hours Running Hydro Capacity in MWh
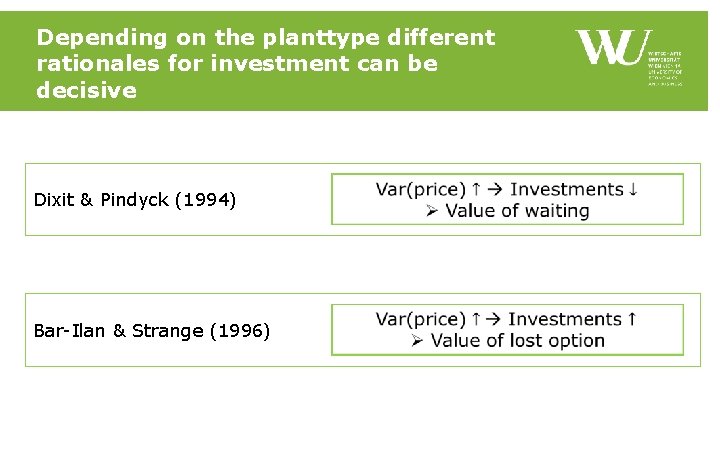
Depending on the planttype different rationales for investment can be decisive Dixit & Pindyck (1994) Bar-Ilan & Strange (1996)
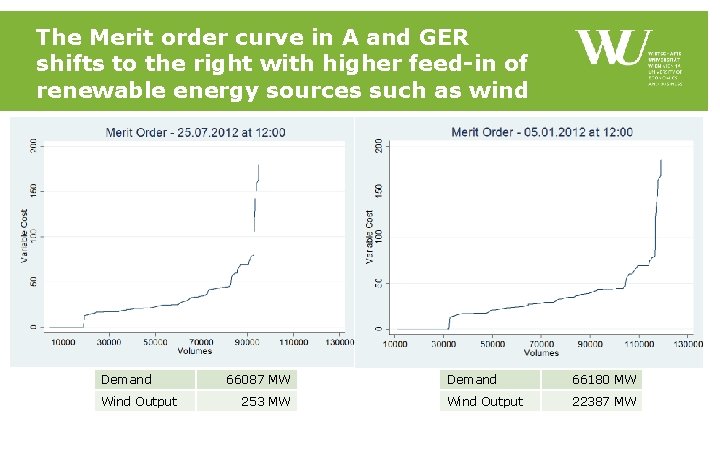
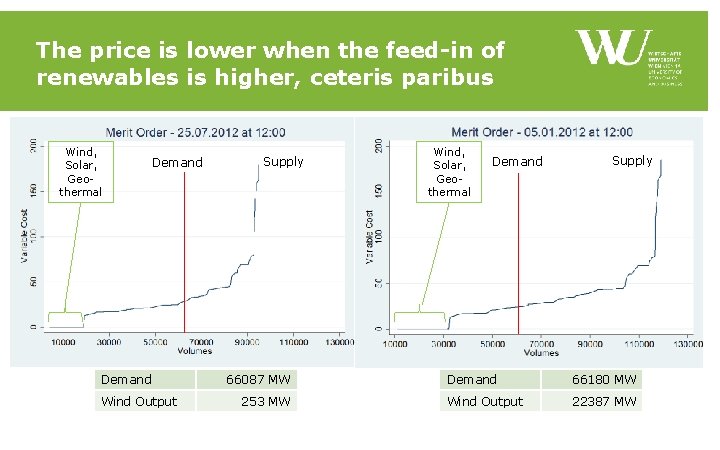
The Merit order curve in A and GER shifts to the right with higher feed-in of renewable energy sources such as wind Demand Wind Output 66087 MW 253 MW Demand 66180 MW Wind Output 22387 MW
The price is lower when the feed-in of renewables is higher, ceteris paribus Wind, Solar, Geothermal Demand Wind Output Supply 66087 MW 253 MW Wind, Solar, Geothermal Demand Supply Demand 66180 MW Wind Output 22387 MW
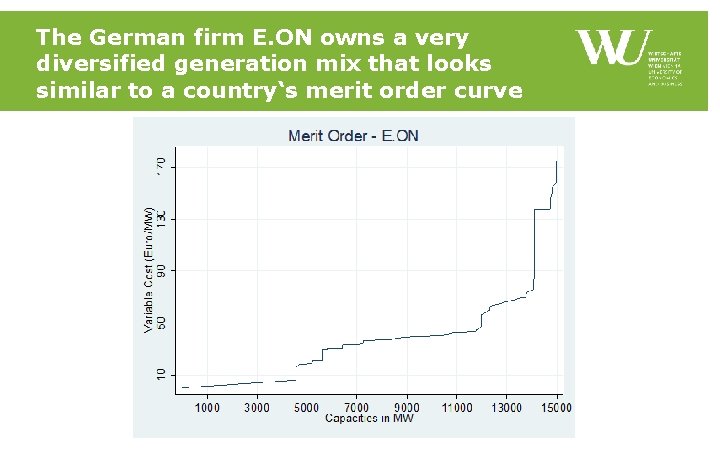
The German firm E. ON owns a very diversified generation mix that looks similar to a country‘s merit order curve
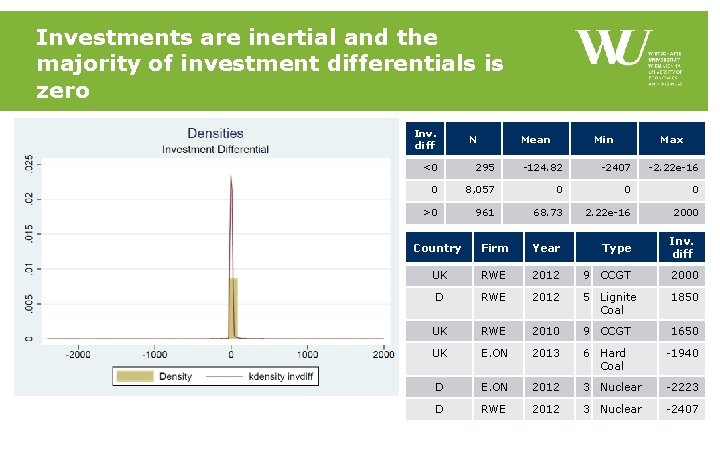
Investments are inertial and the majority of investment differentials is zero Inv. diff N Mean Min Max <0 295 -124. 82 -2407 -2. 22 e-16 0 8, 057 0 0 0 >0 961 68. 73 2. 22 e-16 2000 Inv. diff Country Firm Year Type UK RWE 2012 9 CCGT 2000 D RWE 2012 5 Lignite Coal 1850 UK RWE 2010 9 CCGT 1650 UK E. ON 2013 6 Hard Coal -1940 D E. ON 2012 3 Nuclear -2223 D RWE 2012 3 Nuclear -2407
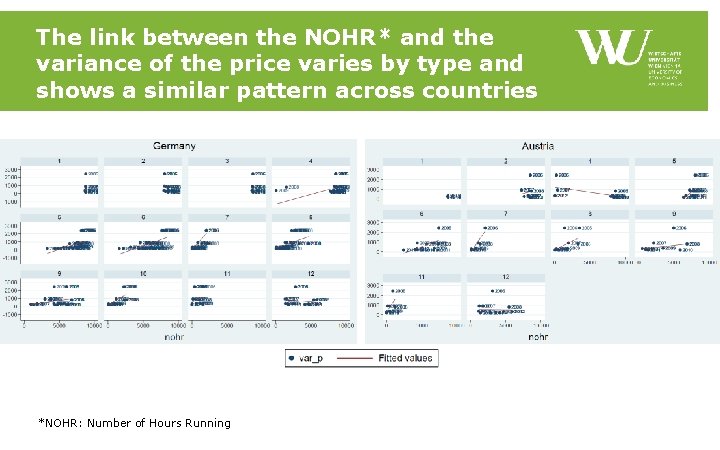
The link between the NOHR* and the variance of the price varies by type and shows a similar pattern across countries *NOHR: Number of Hours Running
Scatterplots by generation type suggest different investment incentives • Disinvestment • No change in investment • Investment
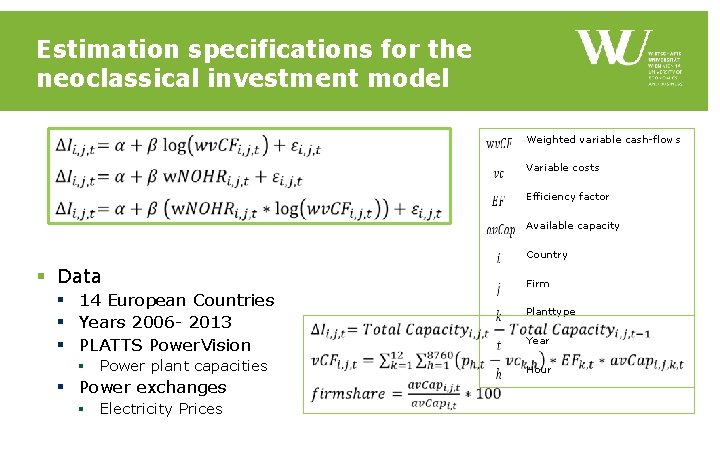
Estimation specifications for the neoclassical investment model Weighted variable cash-flows Variable costs Efficiency factor Available capacity Country § Data § 14 European Countries § Years 2006 - 2013 § PLATTS Power. Vision § Power plant capacities § Power exchanges § Electricity Prices Firm Planttype Year Hour
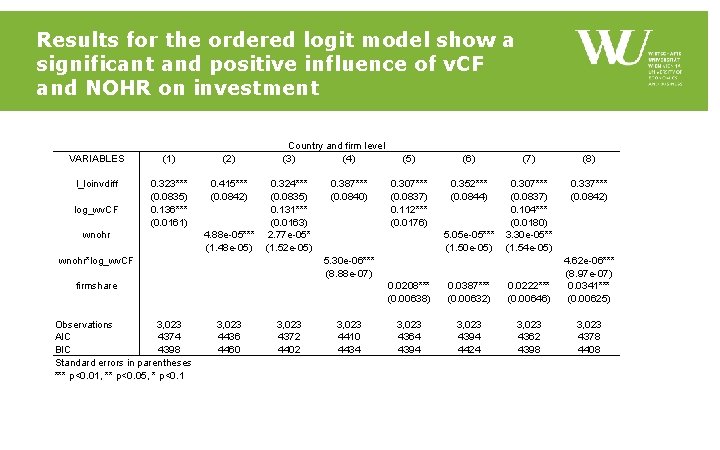
Results for the ordered logit model show a significant and positive influence of v. CF and NOHR on investment VARIABLES (1) (2) l_loinvdiff 0. 323*** (0. 0835) 0. 136*** (0. 0161) 0. 415*** (0. 0842) log_wv. CF wnohr 4. 88 e-05*** (1. 48 e-05) Country and firm level (3) (4) 0. 324*** (0. 0835) 0. 131*** (0. 0163) 2. 77 e-05* (1. 52 e-05) wnohr*log_wv. CF 0. 387*** (0. 0840) (6) (7) (8) 0. 307*** (0. 0837) 0. 112*** (0. 0176) 0. 352*** (0. 0844) 0. 307*** (0. 0837) 0. 104*** (0. 0180) 3. 30 e-05** (1. 54 e-05) 0. 337*** (0. 0842) 5. 05 e-05*** (1. 50 e-05) 5. 30 e-06*** (8. 88 e-07) firmshare Observations 3, 023 AIC 4374 BIC 4398 Standard errors in parentheses *** p<0. 01, ** p<0. 05, * p<0. 1 (5) 3, 023 4436 4460 3, 023 4372 4402 3, 023 4410 4434 0. 0208*** (0. 00638) 0. 0387*** (0. 00632) 0. 0222*** (0. 00646) 4. 62 e-06*** (8. 97 e-07) 0. 0341*** (0. 00625) 3, 023 4364 4394 3, 023 4394 4424 3, 023 4362 4398 3, 023 4378 4408
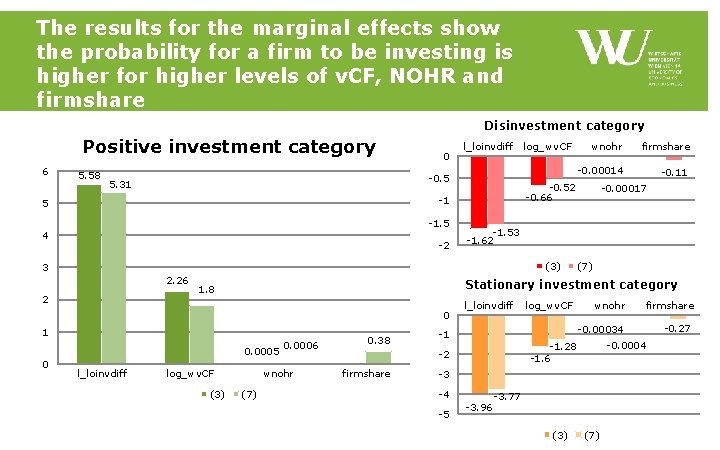
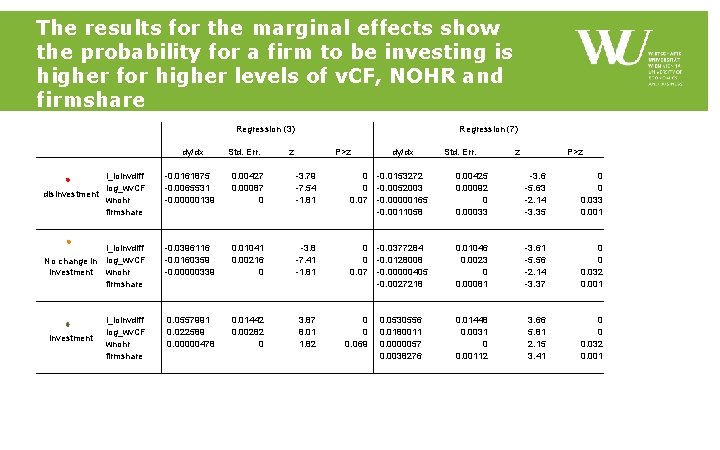
The results for the marginal effects show the probability for a firm to be investing is higher for higher levels of v. CF, NOHR and firmshare Disinvestment category Positive investment category 6 5. 58 0 l_loinvdiff -0. 5 5. 31 -1. 5 4 -2 (3) 2 1 0. 0005 l_loinvdiff log_wv. CF (3) -0. 00014 -0. 11 -0. 00017 (7) Stationary investment category 1. 8 0 0 firmshare -1. 53 -1. 62 3 2. 26 wnohr -0. 52 -0. 66 -1 5 log_wv. CF 0. 0006 wnohr (7) 0. 38 l_loinvdiff -1 wnohr firmshare -0. 00034 -0. 27 -0. 0004 -1. 28 -1. 6 -2 firmshare log_wv. CF -3 -4 -5 -3. 96 -3. 77 (3) (7)
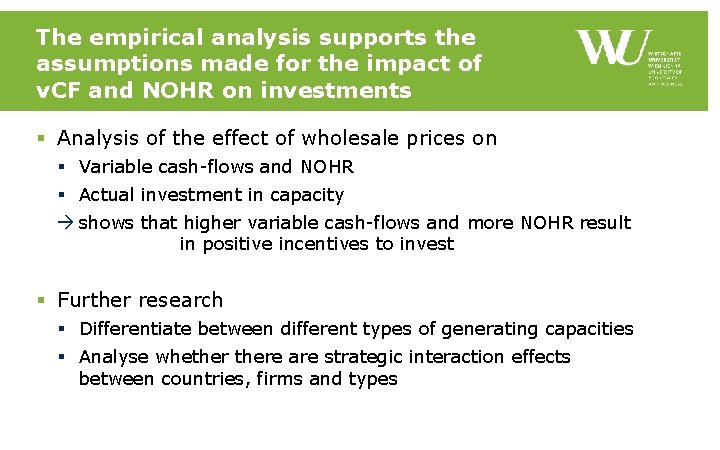
The empirical analysis supports the assumptions made for the impact of v. CF and NOHR on investments § Analysis of the effect of wholesale prices on § Variable cash-flows and NOHR § Actual investment in capacity à shows that higher variable cash-flows and more NOHR result in positive incentives to invest § Further research § Differentiate between different types of generating capacities § Analyse whethere are strategic interaction effects between countries, firms and types
Thank you for your attention! FORSCHUNGSINSTITUT FÜR REGULIERUNGSÖKONOMIE RESEARCH INSTITUTE FOR REGULATORY ECONOMICS Welthandelsplatz 1, 1020 Vienna, Austria Nora Schindler, M. Sc. , MSc(WU) T +43 -1 -313 36 -5898 Nora. Schindler@wu. ac. at www. wu. ac. at
The results for the marginal effects show the probability for a firm to be investing is higher for higher levels of v. CF, NOHR and firmshare Regression (3) dy/dx Std. Err. Regression (7) z P>z dy/dx Std. Err. z P>z l_loinvdiff log_wv. CF disinvestment wnohr firmshare -0. 0161875 -0. 0065531 -0. 00000139 0. 00427 0. 00087 0 -3. 79 -7. 54 -1. 81 0 0 0. 07 -0. 0153272 -0. 0052003 -0. 00000165 -0. 0011058 0. 00425 0. 00092 0 0. 00033 -3. 6 -5. 63 -2. 14 -3. 35 0 0 0. 033 0. 001 l_loinvdiff No change in log_wv. CF investment wnohr firmshare -0. 0396116 -0. 0160359 -0. 00000339 0. 01041 0. 00216 0 -3. 8 -7. 41 -1. 81 0 0 0. 07 -0. 0377284 -0. 0128008 -0. 00000405 -0. 0027218 0. 01046 0. 0023 0 0. 00081 -3. 61 -5. 56 -2. 14 -3. 37 0 0 0. 032 0. 001 l_loinvdiff log_wv. CF wnohr firmshare 0. 0557991 0. 022589 0. 00000478 0. 01442 0. 00282 0 3. 87 8. 01 1. 82 0 0 0. 069 0. 0530556 0. 0180011 0. 0000057 0. 0038276 0. 01448 0. 0031 0 0. 00112 3. 66 5. 81 2. 15 3. 41 0 0 0. 032 0. 001 investment
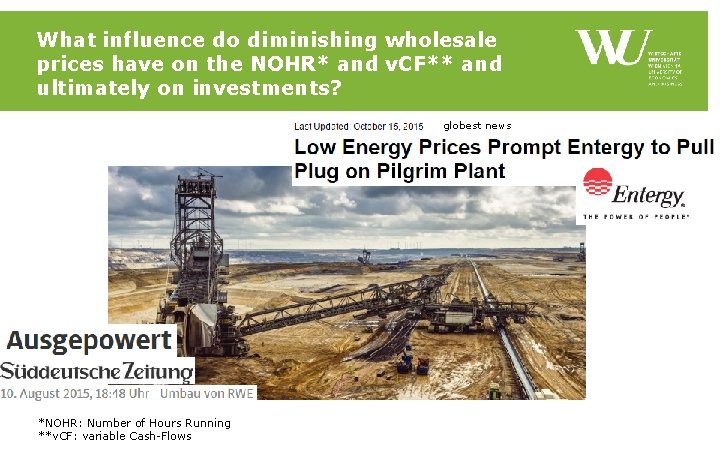
What influence do diminishing wholesale prices have on the NOHR* and v. CF** and ultimately on investments? globest news *NOHR: Number of Hours Running **v. CF: variable Cash-Flows
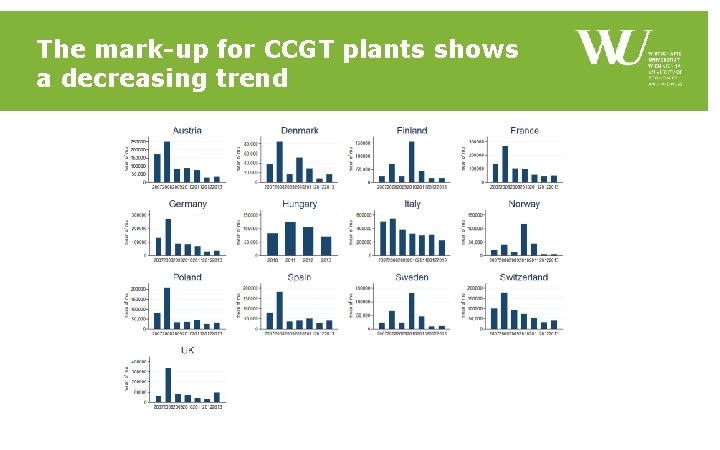
The mark-up for CCGT plants shows a decreasing trend