NonUS Supranational Panel Margaret Kerins CFA Head of


- Slides: 16
Non-US Supranational Panel Margaret Kerins, CFA Head of Fixed Income Strategy Margaret. Kerins@bmo. com 312 -845 -2687 Dan Krieter, CFA Dan. Krieter@bmo. com 312 -845 -4015 October 27, 2020 0
1
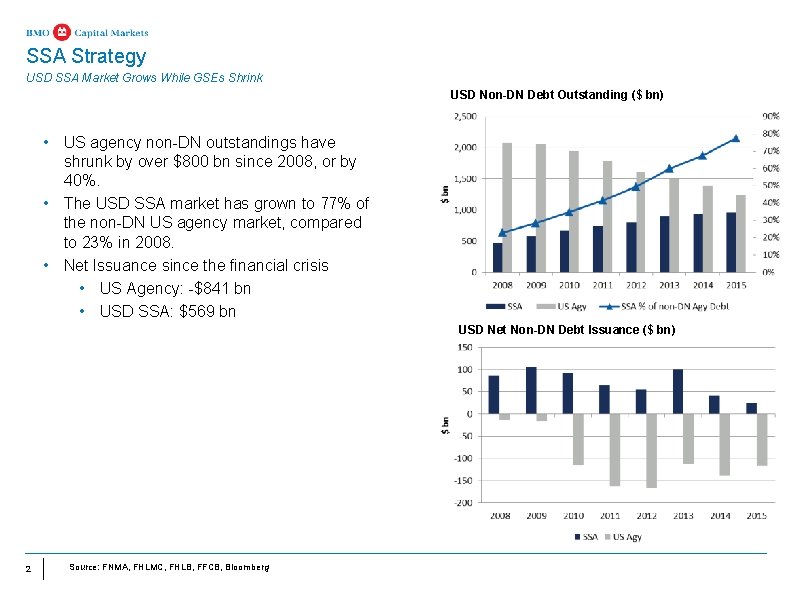
SSA Strategy USD SSA Market Grows While GSEs Shrink USD Non-DN Debt Outstanding ($ bn) • US agency non-DN outstandings have shrunk by over $800 bn since 2008, or by 40%. • The USD SSA market has grown to 77% of the non-DN US agency market, compared to 23% in 2008. • Net Issuance since the financial crisis • US Agency: -$841 bn • USD SSA: $569 bn USD Net Non-DN Debt Issuance ($ bn) 2 Source: FNMA, FHLMC, FHLB, FFCB, Bloomberg
SSA Strategy Agency Issuance Declining • FHLB and FFCB now the dominant issuers in the agency market • DN and floater issuance has increased while the bullet and callable markets shrink at all four GSEs • Bullet issuance difficult to find in the agency market. Likely diversification needs as FHLB and FFCB represent the best way to add term debt. 2015 Net Agy Issuance ($ bn) 3 Source: FNMA, FHLMC, FHLB, FFCB 2015 Net Agy Issuance ($ bn)
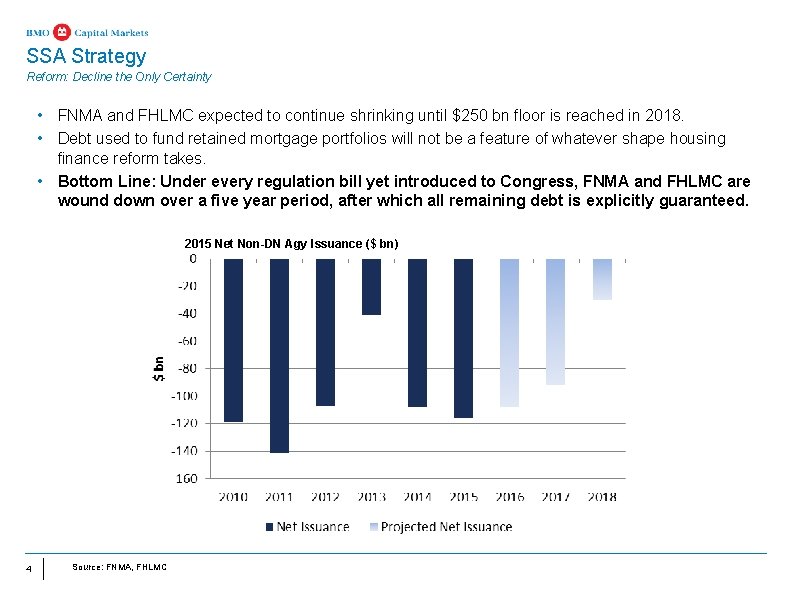
SSA Strategy Reform: Decline the Only Certainty • FNMA and FHLMC expected to continue shrinking until $250 bn floor is reached in 2018. • Debt used to fund retained mortgage portfolios will not be a feature of whatever shape housing finance reform takes. • Bottom Line: Under every regulation bill yet introduced to Congress, FNMA and FHLMC are wound down over a five year period, after which all remaining debt is explicitly guaranteed. 2015 Net Non-DN Agy Issuance ($ bn) 4 Source: FNMA, FHLMC
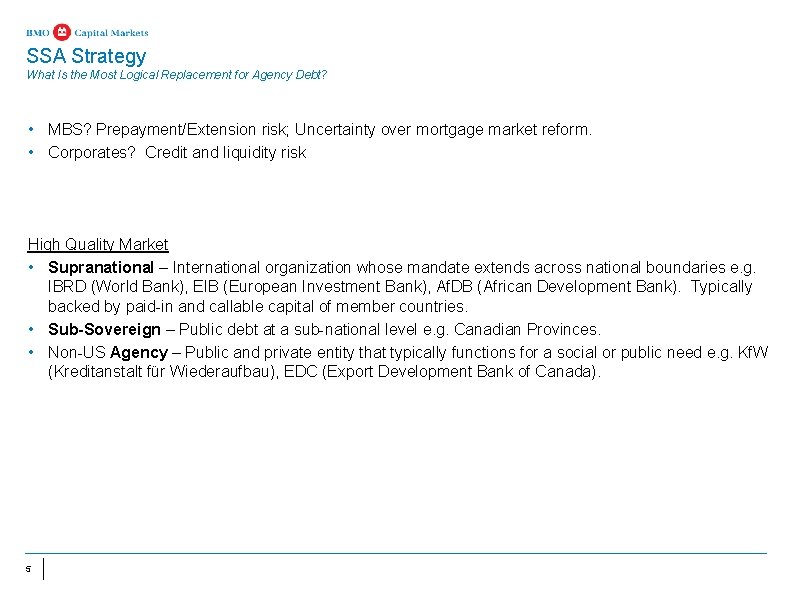
SSA Strategy What Is the Most Logical Replacement for Agency Debt? • MBS? Prepayment/Extension risk; Uncertainty over mortgage market reform. • Corporates? Credit and liquidity risk High Quality Market • Supranational – International organization whose mandate extends across national boundaries e. g. IBRD (World Bank), EIB (European Investment Bank), Af. DB (African Development Bank). Typically backed by paid-in and callable capital of member countries. • Sub-Sovereign – Public debt at a sub-national level e. g. Canadian Provinces. • Non-US Agency – Public and private entity that typically functions for a social or public need e. g. Kf. W (Kreditanstalt für Wiederaufbau), EDC (Export Development Bank of Canada). 5
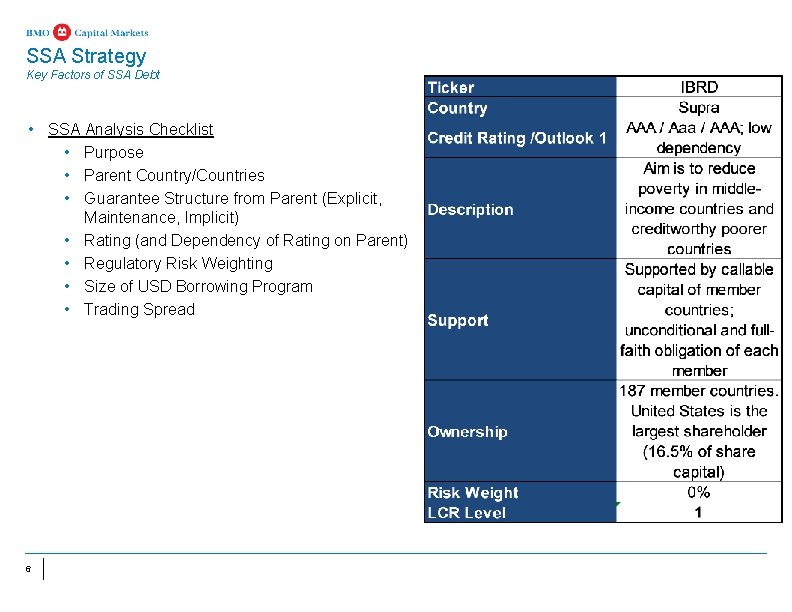
SSA Strategy Key Factors of SSA Debt • SSA Analysis Checklist • Purpose • Parent Country/Countries • Guarantee Structure from Parent (Explicit, Maintenance, Implicit) • Rating (and Dependency of Rating on Parent) • Regulatory Risk Weighting • Size of USD Borrowing Program • Trading Spread 6
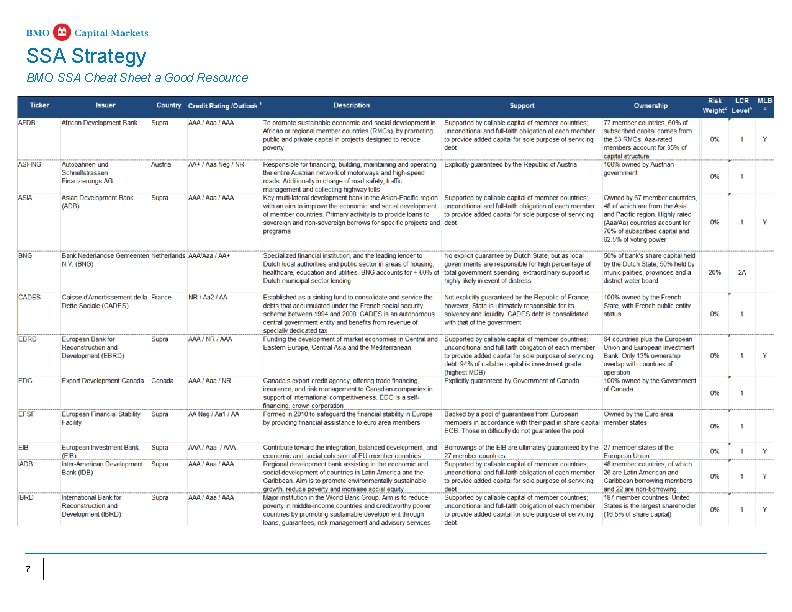
SSA Strategy BMO SSA Cheat Sheet a Good Resource 7
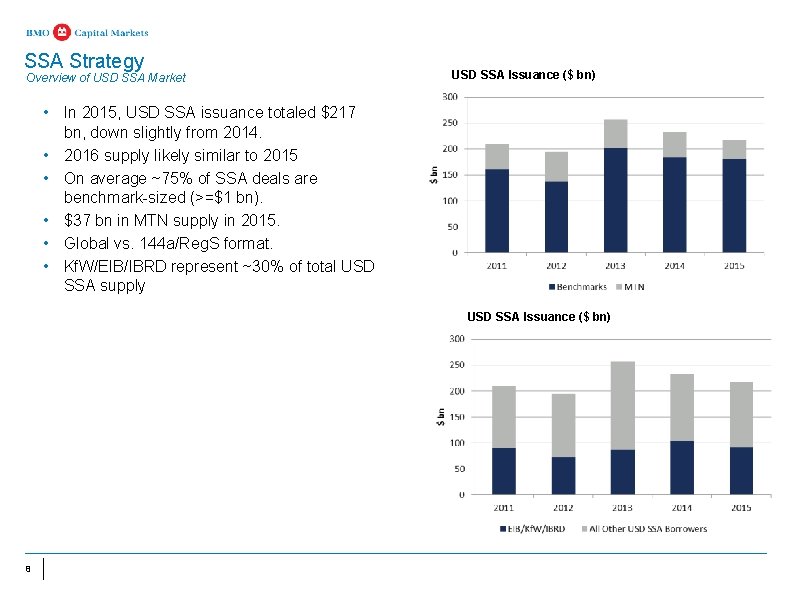
SSA Strategy Overview of USD SSA Market USD SSA Issuance ($ bn) • In 2015, USD SSA issuance totaled $217 bn, down slightly from 2014. • 2016 supply likely similar to 2015 • On average ~75% of SSA deals are benchmark-sized (>=$1 bn). • $37 bn in MTN supply in 2015. • Global vs. 144 a/Reg. S format. • Kf. W/EIB/IBRD represent ~30% of total USD SSA supply USD SSA Issuance ($ bn) 8
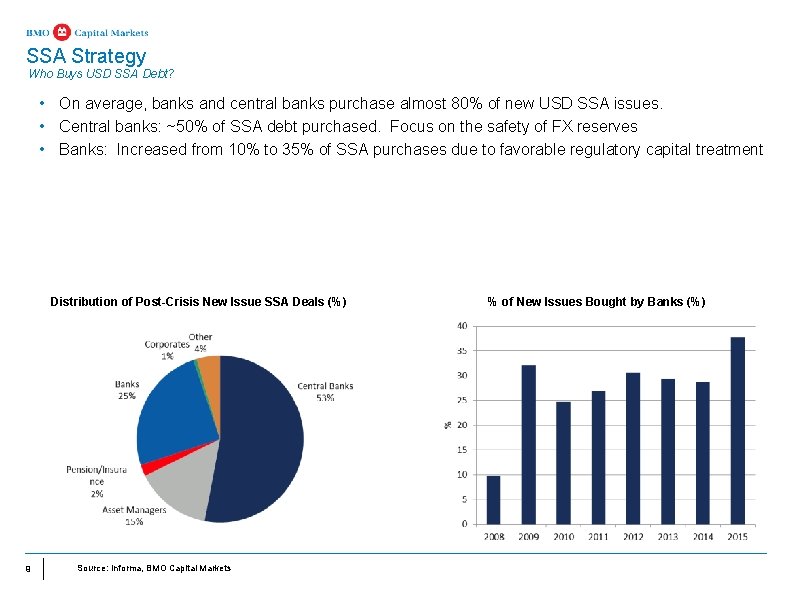
SSA Strategy Who Buys USD SSA Debt? • On average, banks and central banks purchase almost 80% of new USD SSA issues. • Central banks: ~50% of SSA debt purchased. Focus on the safety of FX reserves • Banks: Increased from 10% to 35% of SSA purchases due to favorable regulatory capital treatment Distribution of Post-Crisis New Issue SSA Deals (%) 9 Source: Informa, BMO Capital Markets % of New Issues Bought by Banks (%)
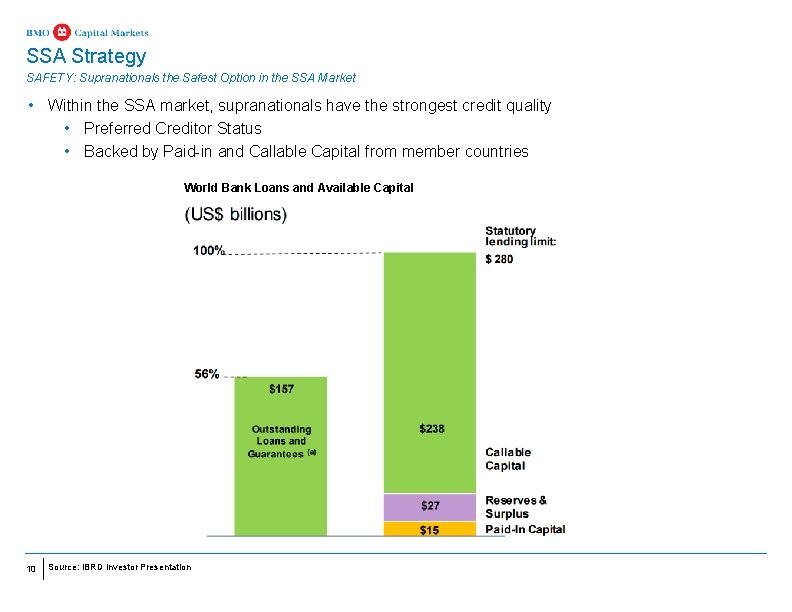
SSA Strategy SAFETY: Supranationals the Safest Option in the SSA Market • Within the SSA market, supranationals have the strongest credit quality • Preferred Creditor Status • Backed by Paid-in and Callable Capital from member countries World Bank Loans and Available Capital 10 Source: IBRD Investor Presentation
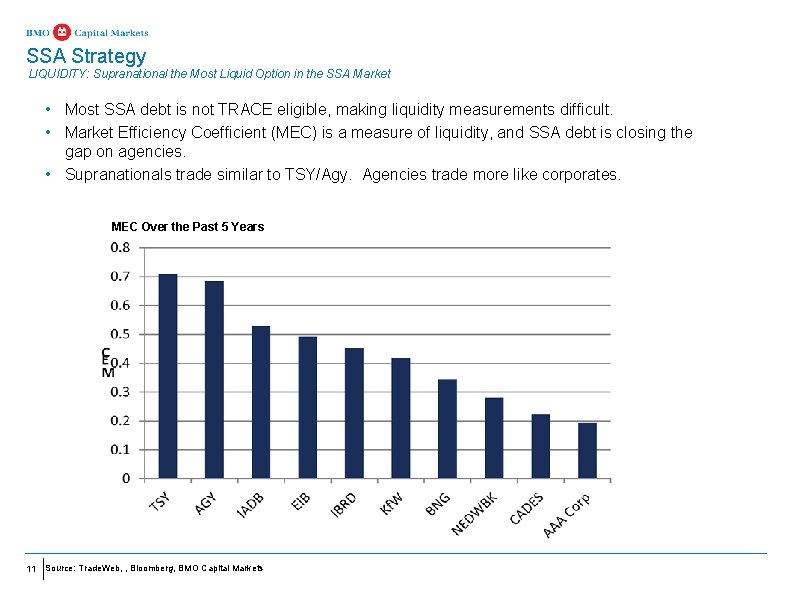
SSA Strategy LIQUIDITY: Supranational the Most Liquid Option in the SSA Market • Most SSA debt is not TRACE eligible, making liquidity measurements difficult. • Market Efficiency Coefficient (MEC) is a measure of liquidity, and SSA debt is closing the gap on agencies. • Supranationals trade similar to TSY/Agy. Agencies trade more like corporates. MEC Over the Past 5 Years 11 Source: Trade. Web, , Bloomberg, BMO Capital Markets
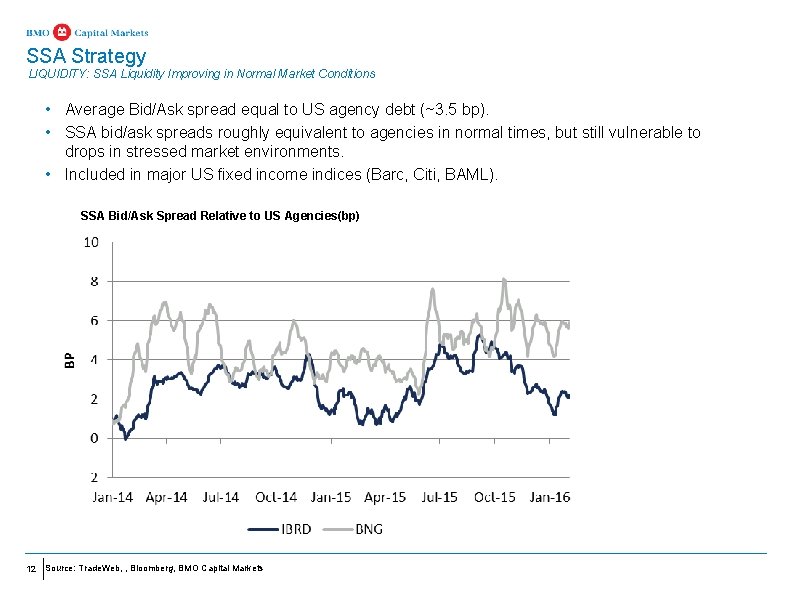
SSA Strategy LIQUIDITY: SSA Liquidity Improving in Normal Market Conditions • Average Bid/Ask spread equal to US agency debt (~3. 5 bp). • SSA bid/ask spreads roughly equivalent to agencies in normal times, but still vulnerable to drops in stressed market environments. • Included in major US fixed income indices (Barc, Citi, BAML). SSA Bid/Ask Spread Relative to US Agencies(bp) 12 Source: Trade. Web, , Bloomberg, BMO Capital Markets
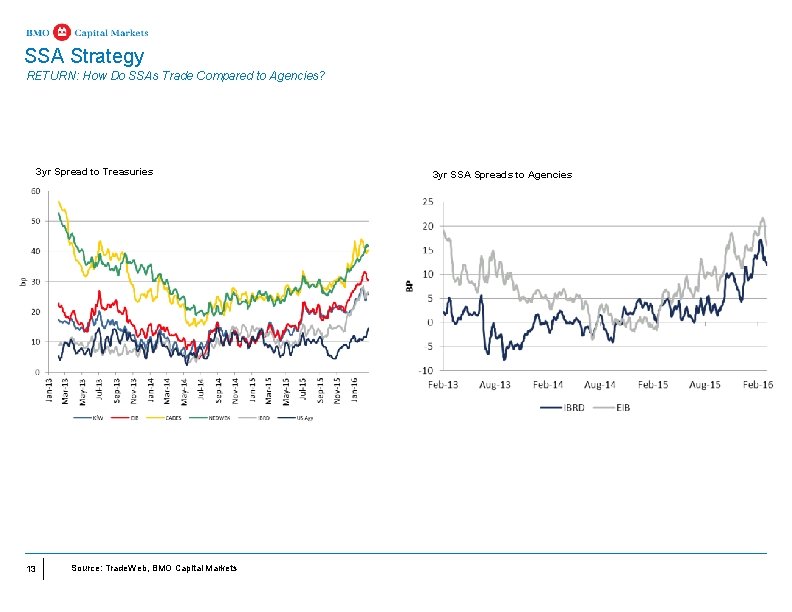
SSA Strategy RETURN: How Do SSAs Trade Compared to Agencies? 3 yr Spread to Treasuries 13 Source: Trade. Web, BMO Capital Markets 3 yr SSA Spreads to Agencies
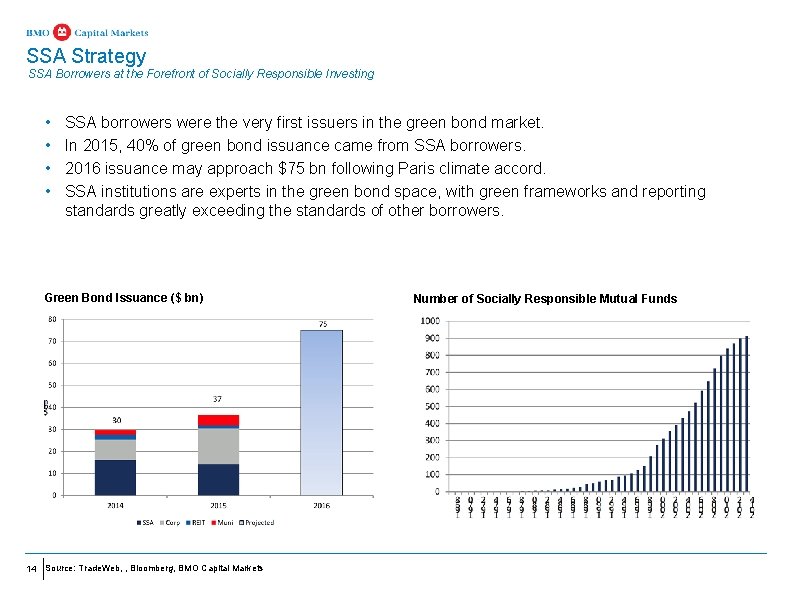
SSA Strategy SSA Borrowers at the Forefront of Socially Responsible Investing • • SSA borrowers were the very first issuers in the green bond market. In 2015, 40% of green bond issuance came from SSA borrowers. 2016 issuance may approach $75 bn following Paris climate accord. SSA institutions are experts in the green bond space, with green frameworks and reporting standards greatly exceeding the standards of other borrowers. Green Bond Issuance ($ bn) 14 Source: Trade. Web, , Bloomberg, BMO Capital Markets Number of Socially Responsible Mutual Funds
Disclaimer These materials are confidential and proprietary to, and may not be reproduced, disseminated or referred to, in whole or in part without the prior consent of BMO CM (“BMO”). These materials have been prepared exclusively for the BMO client or potential client to which such materials are delivered and may not be used for any purpose other than as authorized in writing by BMO assumes no responsibility for verification of the information in these materials, and no representation or warranty is made as to the accuracy or completeness of such information. BMO assumes no obligation to correct or update these materials. These materials do not contain all information that may be required to evaluate, and do not constitute a recommendation with respect to, any transaction or matter. Any recipient of these materials should conduct its own independent analysis of the matters referred to herein. “BMO CM” is a trade name used by BMO Financial Group for the wholesale banking businesses of Bank of Montreal, BMO Harris Bank N. A. (formerly Harris N. A. ) and Bank of Montreal Ireland p. l. c, and the institutional broker dealer businesses of BMO CM Corp. and BMO CM GKST Inc. in the U. S. , BMO Nesbitt Burns Inc. (Member – Canadian Investor Protection Fund) in Canada, Europe and Asia, BMO Nesbitt Burns Securities Limited (registered in the United States and a member of FINRA), BMO CM Limited in Europe, Asia and Australia and BMO Advisors Private Limited in India. BMO does not provide tax or legal advice. Any discussion of tax matters in these materials (i) is not intended to be used, and cannot be used or relied upon, for the purposes of avoiding any tax penalties and (ii) may have been written in connection with the “promotion or marketing” of the transaction or matter described herein. Accordingly, the recipient should seek advice based on its particular circumstances from an independent tax advisor. All values in this document are in C$ / US$ / A$ / € / £ / ¥ / ₹ unless otherwise specified 15