Newtonian noise from the underground water TAUP 2019

 is small in")

![Amount of water at Yend [information provided by Ohashi and Furuta] Exceeded this level](https://slidetodoc.com/presentation_image_h/cb482665d3c5112174105f127d6efa8b/image-4.jpg "Amount of water at Yend [information provided by Ohashi and Furuta] Exceeded this level")
![How does the water flow cause NN? [Y. Chen] [A. Nishizawa] H axa mesh](https://slidetodoc.com/presentation_image_h/cb482665d3c5112174105f127d6efa8b/image-5.jpg "How does the water flow cause NN? [Y. Chen] [A. Nishizawa] H axa mesh")
 Model")

![CFD simulation [T. Inoue, thesis ‘ 19] We created a model with a 20](https://slidetodoc.com/presentation_image_h/cb482665d3c5112174105f127d6efa8b/image-8.jpg "CFD simulation [T. Inoue, thesis ‘ 19] We created a model with a 20")
![Preliminary result of our simulation [T. Inoue, thesis ‘ 19] The light blue curve](https://slidetodoc.com/presentation_image_h/cb482665d3c5112174105f127d6efa8b/image-9.jpg "Preliminary result of our simulation [T. Inoue, thesis ‘ 19] The light blue curve")


- Slides: 12
Newtonian noise from the underground water TAUP 2019 @Toyama Intl. Conf. Center Tokyo Tech , U Tokyo. A, Fukuoka Univ. B K. Somiya, T. Inoue, A. Nishizawa. A, K. Hayama. B, and Y. Liu
KAGRA and Newtonian noise • Seismic Newtonian noise (gravity gradient noise) is small in KAGRA for its distance from the ground surface • However, there is a lot of water flowing behind the rock, which may or may not cause excess fluctuation of the gravity gradient Can we estimate NN from the spring water?
Water flow in KAGRA Yend chamber mass fault Xend water drain floor pipe • The tunnel is made tilted by 1/300 to drain water (X->Center->Y) • Main drainage pipe is located under the floor • The largest water flow at the Yend We built a bypass system and compulosory drainage pipes to decrease the amount of water underneath the Yend.
Amount of water at Yend [information provided by Ohashi and Furuta] Exceeded this level in ’ 15 & ‘ 17 • <400 t/h thru compulsory pipe (~5 m from test mass) • <450 t/h thru bypass pipe • <400 t/h thru main pipe (~2 m from test mass) MAX 1250 t/h
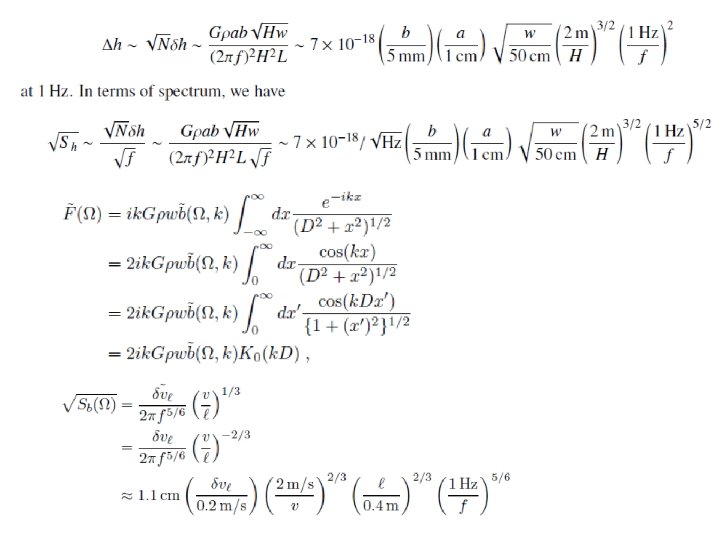
How does the water flow cause NN? [Y. Chen] [A. Nishizawa] H axa mesh Spatial spectrum of height H b w v H Model 2: static pattern flowing at a constant velocity Model 1: uncorrelated height fluctuation Modified Bessel function Model 1 is probably highly overestimate the noise level. An actual noise level would be somewhere in-between.
Estimated noise spectrum Model 1 (H=2 m, a=10 cm, b=5 mm, w=40 cm) Model 2 If the actual spectrum is close the one with model 1, the KAGRA sensitivity could be limted by water Newtonian noise.
CFD simulation We used Autodesk CFD to simulate the water flow in a pipe. (i) Initial height of the water and (ii) initial speed of the flow are given and they converge to final values; the combination of the values give the final amount of the water flow. In our simulation the water flow is ~100 t/h.
CFD simulation [T. Inoue, thesis ‘ 19] We created a model with a 20 -m pipe and reservoir at the end. After making sure that the water flow converges, data in a section at L=13~15 m are used. We then (i) recorded the surface location of each point at different time (ii) calculated the gravity on the test mass (iii) Fourier transformed the data to obtain the noise spectrum
Preliminary result of our simulation [T. Inoue, thesis ‘ 19] The light blue curve represents the result for a pipe 2 -m distant from the test mass (main pipe). The result is rather close to that for Model 1. The exponential decay in Model 2 requires a static water flow in a wider range. The current simulation may not be good enough to see such a decay.
Sumary and outlook • Our simulation shows a significant influence of the water Newtonian noise. • Our simulation, however, is with 100 t/h of water in the main pipe, which happens with 1050 t/h total water. • A better simulation with more data is necessary to see the exponential decay at high frequencies. • We should test the case with less water (~10 t/h).
supplementary slides