New concept and theory of Myopia development J

 (2) (3) (4) (5) (6) Human eye optics New concept of myopia")

 S X L P 2 P 1 CORNEA LENS")
 (1) Axial growth is triggered by (a) : retina")
, axial growth rate (per year) > 0. 12 mm Olson")
 - 0. 23(P")

 Age 6 -12 De =44. 7 – 15. 1 (L /r)")
 De =")
 Age L (mm) Cornea Lens 0 16. 8 51 34 Age")
![Higher lens power in [short] eye hyperopes lower lens power in hyperopes with eyes](https://slidetodoc.com/presentation_image/2a159f77fc6800b8e343177126225eb6/image-13.jpg "Higher lens power in [short] eye hyperopes lower lens power in hyperopes with eyes")
 Garner (2002, data), axial growth rate (per year) N >")
, (Data: Lam, 2002) De 3. 5 De drops")
 L, Dj 24 Axial length Corneal")
 +4. 0 +2. 0 Presbyopia emmetropia")


 Axial growth is trigered by (a) : retina defocusing. (b) lens accommondation")
 Refractive changes with (dashed) and without cataract Hashemi et")
 A = A")
- Slides: 24
New concept and theory of Myopia development ______________ J. T. Lin, Ph. D New Vision, Inc. Taiwan Beijing-8 -
Summary (1) (2) (3) (4) (5) (6) Human eye optics New concept of myopia The ratio: L/r =3. 0 The growth rate theory The lens paradox Axial growth factors (defocusing, accommod) (7) Myopia predictor
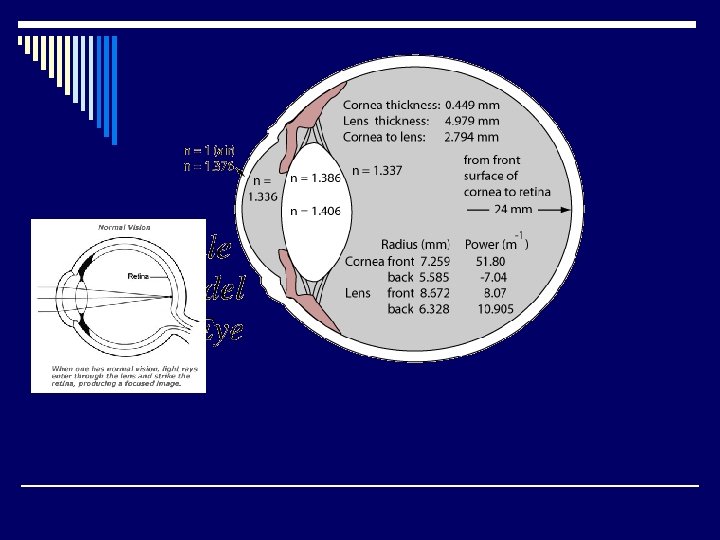
Human eye optics S X Myopia F D 1 CORNEA D 2 LENS Hyperopia Retina
Effective eye model (Lin, 2005) S X L P 2 P 1 CORNEA LENS L = S + X + a. T 2 De = z [ P 3 – P 1/z – P 2 ] z = (1 - S/f) = 1 - S P 1/1336 = 0. 8 to 0. 85
The basic myopic-theory (Lin, 2005) (1) Axial growth is triggered by (a) : retina defocusing, (b) (lens) accommondation (deshaping and translation). (2) Refractive errors resulted from the mismatching of ocular components growth rates De = Do + (d. D 1 + z 2 d. D 2) - md. L initial cornea lens axial m=4. 0 to 2. 5 D/mm, (depnding on age) Conditions of emmetropization: (a) Do >2. 0 ; (b) md. L < Do + [d. D 1 + z 2 d. D 2 ] Otherwise, myopia [De<0] will develop due to anormal axial growth. (md. L)
Myopia predictor Garner (2002), axial growth rate (per year) > 0. 12 mm Olson (2007) regression Eq, (data, mean value) De= 110 – 2. 43 L – 0. 89 P 1 - 0. 62 P 2 De=0, for L= 23, P 1=43, need P 2=24. 8 D. Lin (2005), rate theory for L = 24 = S 1 + S 2 + T. De= 1. 39 (S 1 - 3. 3) – 2. 76 (S 2 - 16. 7) – 2. 9 (T – 4. 0) – 1. 0 (43 - P 1) – 0. 75 (23 -P 2) 0
New criterion for myopia-axial length L*=24 - 0. 36(P 1 -43) - 0. 23(P 2 -23) - 0. 5(So-3. 3) - 0. 35(T-4. 0) L*=24, for (P 1, P 2, So, T)=(43, 23, 3. 3, 4. 0) Example: L=26 mm could be myop or hyper, D= -1. 5, if L*=25 D=+2. 5, if L*=27 ). * JT Lin (Chin J O P, 2005, 145 -151). CK Chang, JT Lin, IJO (8/2017 0
New definition of Refractive States Emmetropic has been defined by ratios: H/L =1. 0, L/r =3. 0 , New ratios: C 1=L/r , C 2=L/R L r H L R (1) C 1=L/r=3. 0 – 0. 0036 De (2) 0. 25 C 1 +0. 126 C 2 = 1+2. 97/L –L De * JT Lin (Chin J Oph opt. 2005, 1 - 6; and 145 -151). 0
Shanghai/2005, N=3922 (data) Age 6 -12 De =44. 7 – 15. 1 (L /r) L /r = 2. 96 – 0066 De Lin (theory, 2005) L /r = 3. 0 – (0. 003 L) De =3. 0 – 0. 066 De, for L = 22 mm.
N=167, age>40 De= 35. 8 - 1. 59 L Lin (theory, 2005) De = 62 – (2. 76 L – 1. 37 d. S)
Iribarren (Review, 2016) Age L (mm) Cornea Lens 0 16. 8 51 34 Age 0 10 -20 20 -80 T 4. 0 3. 8 – 4. 8 n 1. 45 1. 44 1. 435 c- 1. 415 Lens paradox resolved by the index decrease by age, compensates the power increase due to thickness increase. 10 -20 23. 6 43 19 50 - 80 43 21 - 19
Higher lens power in [short] eye hyperopes lower lens power in hyperopes with eyes with similar length as emmetropes. Refractive group AL/CR Mean SE Lens power Hyperopes with 75 low L/r 2. 86* 2. 89* 23. 13* Hyperopes with 193 normal L/r 3. 0 1. 54* 21. 96* Emmetropes 3. 03 0. 22 22. 54 n= 528 Irribennar (2015)
Myopia predictor (Lin, 2005) Garner (2002, data), axial growth rate (per year) N > 0. 12 mm Lin (2005, theory), d. De/d. A = -m(d. L/d. A) – z 2 (d. D 2/d. A) axial lens = m. N - z 2 M solve for myopic predictor rate N = -z 2 M/m. (012, Garner, 2002) Myopia onset age (A*) A* = A + (L 23)/N
Growth (age 0 to 3 yrs), (Data: Lam, 2002) De 3. 5 De drops fast by age 1. 0 0 0 3 Age (year) 6
Ocular power growth (age 0 to 60 yrs) L, Dj 24 Axial length Corneal power Lens power 17 0 3 20 40 Age (year) 60
Ocular power growth (age 0 to 60 yrs) +4. 0 +2. 0 Presbyopia emmetropia 0 0 3 20 40 Age (year) 60
Conclusions (1) Axial growth is trigered by (a) : retina defocusing. (b) lens accommondation (deshaping and translation). (2) Refractive errors resulted from the mismatching of ocular components growth rates De = Do + (d. D 1 + z 2 d. D 2) - md. L initial cornea lens axial (4) Conditions of emmetropization: (a) initial hyperopic [Do > +2. 0 ]; (b) axial power growth larger than the [corneal+ lens] power decrease, with a PERFECT match to the age-0 power. (Do) (5) Myopic on-set can be predicted, but it requires both age growth rate of the axial-length (N) and lens (M). . Garner predictor (N>0. 12 mm) is not sufficient. (6) L/r ration of 3. 0 needs revision to: 3. 0 + 0. 03 L De.
Lens paradox (preby with age) Refractive changes with (dashed) and without cataract Hashemi et al, Cli Exp Ophal (2015) Jongenelen et al, Vis Psy Phys Opt ( 2015)
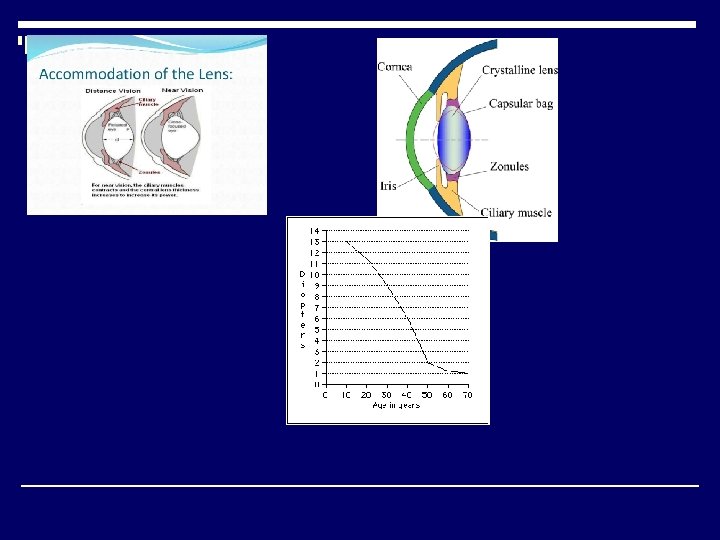
Eye-Accommodation d. S o Lin’s 2 -component theory (Lin, JRS, 2005) A = A 1 + A 2 A 1 = M d. S A 2 = 83 (1/R’ – 1/R) S M = (0. 9 – 1. 5) (D/mm) A 2 = 1. 6 D (for d. R= 1. 0 mm) R’