NATURE OR NURTURE JEWISH CHILDCARE AND POPULATION GROWTH

- Slides: 40
NATURE OR NURTURE? JEWISH CHILDCARE AND POPULATION GROWTH IN EASTERN AND CENTRAL EUROPE, 1500 -1930 Maristella Botticini, Zvi Eckstein and Anat Vaturi Northwestern University, September 28, 2017 1
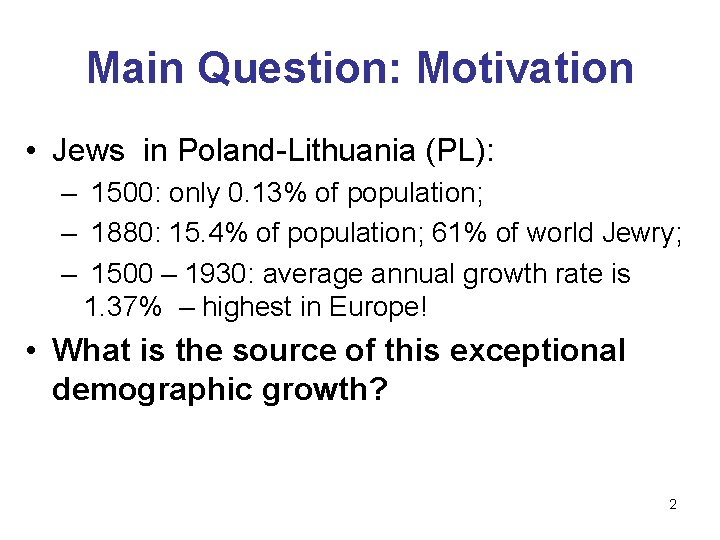
Main Question: Motivation • Jews in Poland-Lithuania (PL): – 1500: only 0. 13% of population; – 1880: 15. 4% of population; 61% of world Jewry; – 1500 – 1930: average annual growth rate is 1. 37% – highest in Europe! • What is the source of this exceptional demographic growth? 2
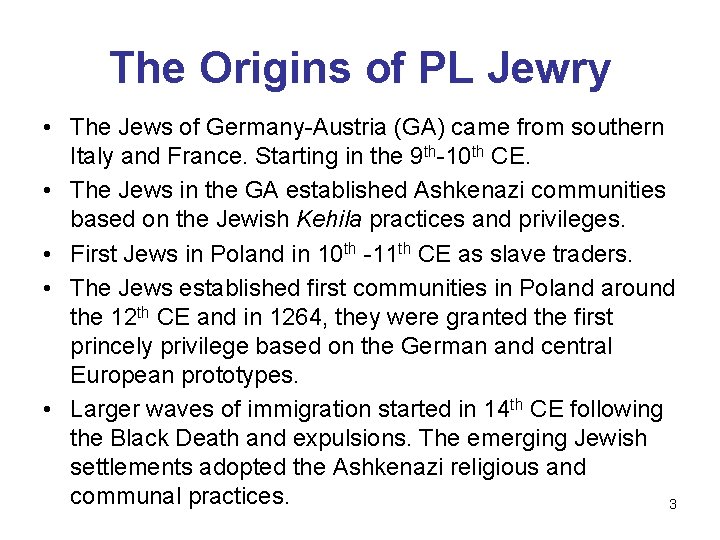
The Origins of PL Jewry • The Jews of Germany-Austria (GA) came from southern Italy and France. Starting in the 9 th-10 th CE. • The Jews in the GA established Ashkenazi communities based on the Jewish Kehila practices and privileges. • First Jews in Poland in 10 th -11 th CE as slave traders. • The Jews established first communities in Poland around the 12 th CE and in 1264, they were granted the first princely privilege based on the German and central European prototypes. • Larger waves of immigration started in 14 th CE following the Black Death and expulsions. The emerging Jewish settlements adopted the Ashkenazi religious and communal practices. 3
The Origin (cont. ) • Evidence from names, privileges, commerce, language, communal organization and religious practices link the Jews in PL to the Jews in GA. • What about the Khazarian hypothesis? – No evidence of their presence in terms of privileges and taxes after 1500. – Other ethnic Jews (Sephardi and Karaites) continued to keep their distinctive religious practices within the Jewish community • Conclusion – no evidence for this potential source 4
Road Map • Data on Jews and total population in GA and PL from 1500 -1800 and then from 1800 -1930 – Areas in two sub-periods kept the same • Data on the differences in population growth by birth and death rates of Jews and total: consider main immigration trends. • Finding: 70% of higher population growth rate is due to lower infant and child mortality among Jews. • Why? Jewish care for infants and children due to their investment in education 5
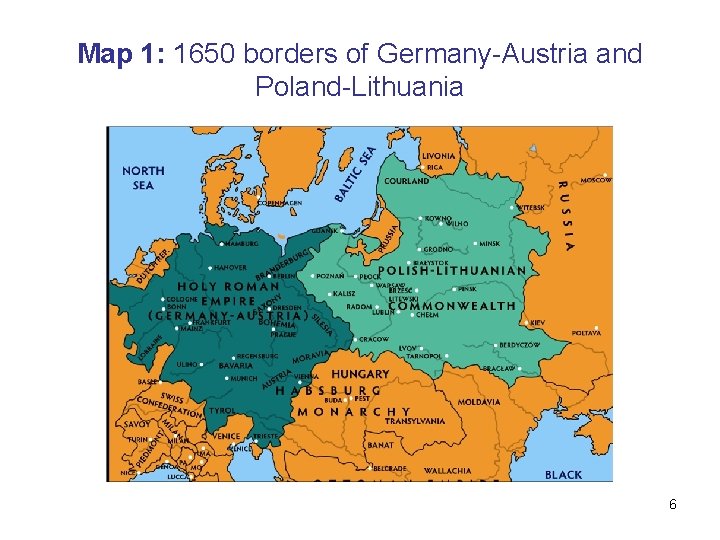
Map 1: 1650 borders of Germany-Austria and Poland-Lithuania 6
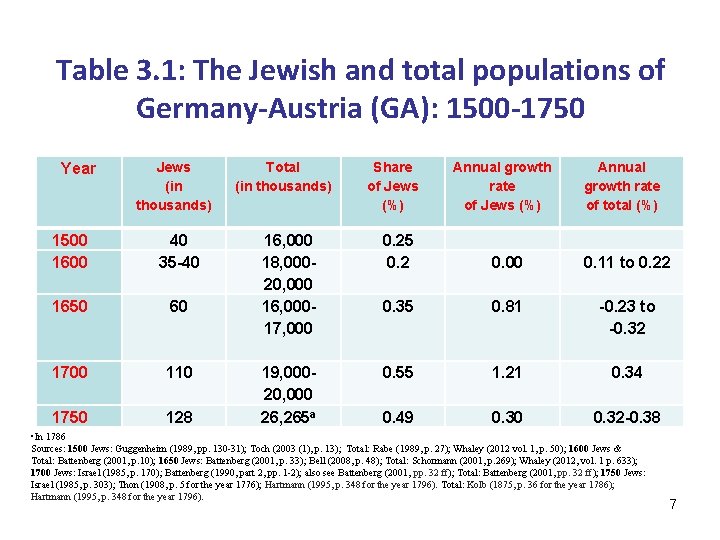
Table 3. 1: The Jewish and total populations of Germany-Austria (GA): 1500 -1750 Year Jews (in thousands) 1500 1600 40 35 -40 1650 60 1700 110 1750 128 Total (in thousands) Share of Jews (%) Annual growth rate of total (%) 16, 000 18, 00020, 000 16, 00017, 000 0. 25 0. 2 0. 00 0. 11 to 0. 22 0. 35 0. 81 19, 00020, 000 26, 265 a 0. 55 1. 21 -0. 23 to -0. 32 0. 34 0. 49 0. 30 0. 32 -0. 38 • In 1786 Sources: 1500 Jews: Guggenheim (1989, pp. 130 -31); Toch (2003 (1), p. 13); Total: Rabe (1989, p. 27); Whaley (2012 vol. 1, p. 50); 1600 Jews & Total: Battenberg (2001, p. 10); 1650 Jews: Battenberg (2001, p. 33); Bell (2008, p. 48); Total: Schormann (2001, p. 269); Whaley (2012, vol. 1 p. 633); 1700 Jews: Israel (1985, p. 170); Battenberg (1990, part 2, pp. 1 -2); also see Battenberg (2001, pp. 32 ff); Total: Battenberg (2001, pp. 32 ff); 1750 Jews: Israel (1985, p. 303); Thon (1908, p. 5 for the year 1776); Hartmann (1995, p. 348 for the year 1796). Total: Kolb (1875, p. 36 for the year 1786); Hartmann (1995, p. 348 for the year 1796). 7
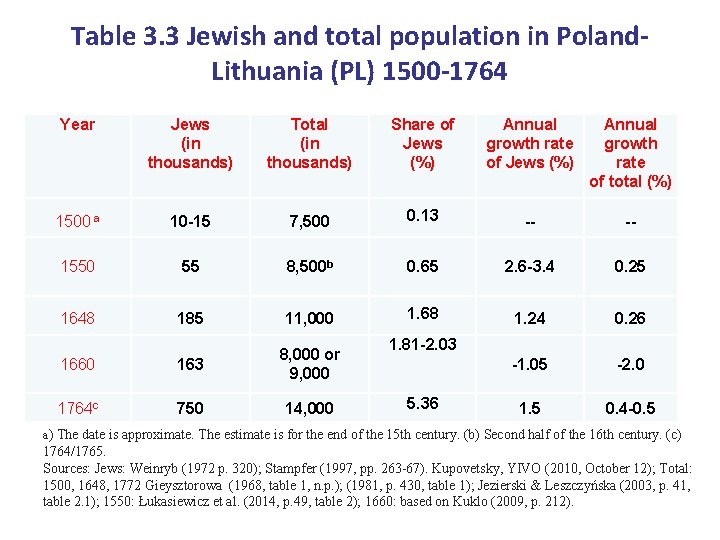
Table 3. 3 Jewish and total population in Poland. Lithuania (PL) 1500 -1764 Year Jews (in thousands) Total (in thousands) Share of Jews (%) Annual growth rate of total (%) 1500 a 10 -15 7, 500 0. 13 -- -- 1550 55 8, 500 b 0. 65 2. 6 -3. 4 0. 25 1648 185 11, 000 1. 68 1. 24 0. 26 1660 163 8, 000 or 9, 000 1. 81 -2. 03 -1. 05 -2. 0 1764 c 750 14, 000 5. 36 1. 5 0. 4 -0. 5 a) The date is approximate. The estimate is for the end of the 15 th century. (b) Second half of the 16 th century. (c) 1764/1765. Sources: Jews: Weinryb (1972 p. 320); Stampfer (1997, pp. 263 -67). Kupovetsky, YIVO (2010, October 12); Total: 1500, 1648, 1772 Gieysztorowa (1968, table 1, n. p. ); (1981, p. 430, table 1); Jezierski & Leszczyńska (2003, p. 41, table 2. 1); 1550: Łukasiewicz et al. (2014, p. 49, table 2); 1660: based on Kuklo (2009, p. 212). 8
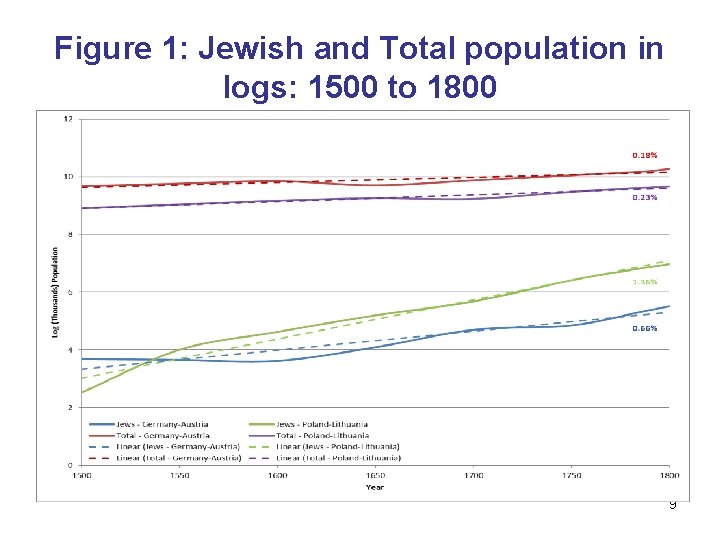
Figure 1: Jewish and Total population in logs: 1500 to 1800 9
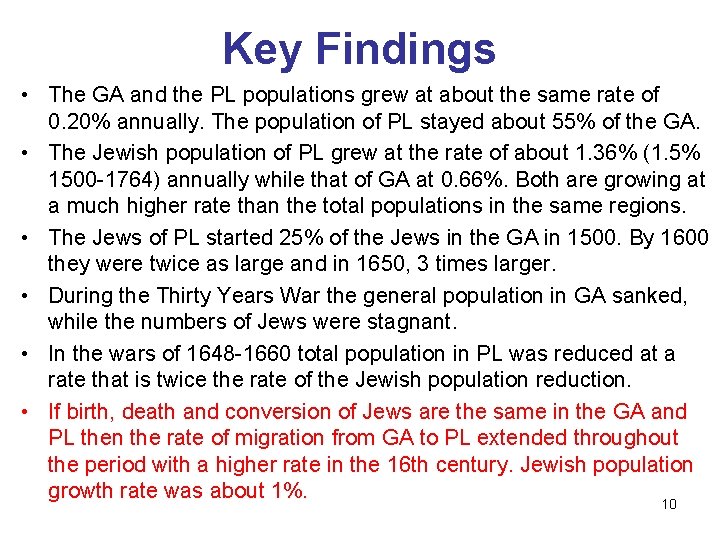
Key Findings • The GA and the PL populations grew at about the same rate of 0. 20% annually. The population of PL stayed about 55% of the GA. • The Jewish population of PL grew at the rate of about 1. 36% (1. 5% 1500 -1764) annually while that of GA at 0. 66%. Both are growing at a much higher rate than the total populations in the same regions. • The Jews of PL started 25% of the Jews in the GA in 1500. By 1600 they were twice as large and in 1650, 3 times larger. • During the Thirty Years War the general population in GA sanked, while the numbers of Jews were stagnant. • In the wars of 1648 -1660 total population in PL was reduced at a rate that is twice the rate of the Jewish population reduction. • If birth, death and conversion of Jews are the same in the GA and PL then the rate of migration from GA to PL extended throughout the period with a higher rate in the 16 th century. Jewish population growth rate was about 1%. 10
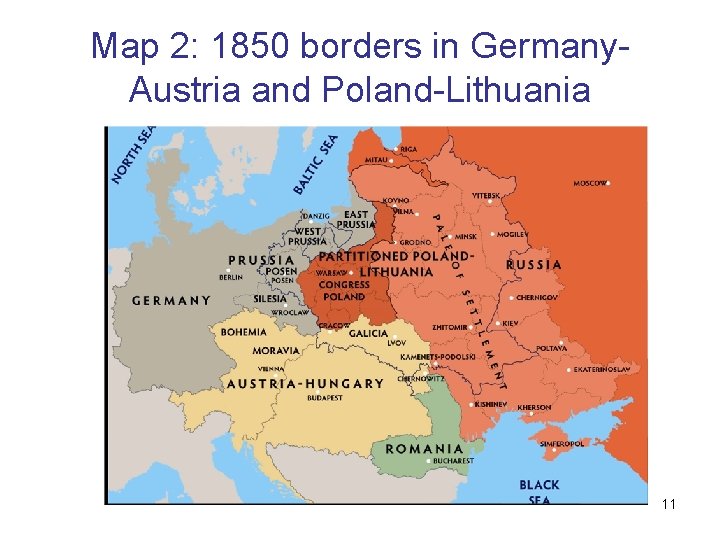
Map 2: 1850 borders in Germany. Austria and Poland-Lithuania 11
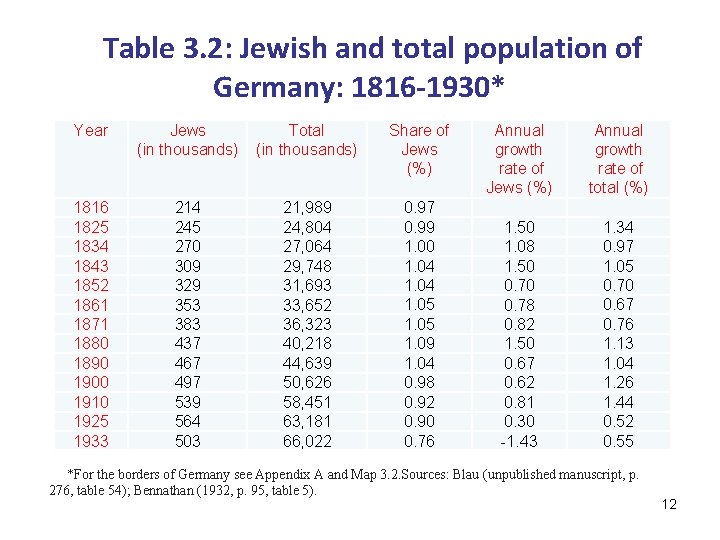
Table 3. 2: Jewish and total population of Germany: 1816 -1930* Year Jews (in thousands) Total (in thousands) Share of Jews (%) 1816 1825 1834 1843 1852 1861 1871 1880 1890 1900 1910 1925 1933 214 245 270 309 329 353 383 437 467 497 539 564 503 21, 989 24, 804 27, 064 29, 748 31, 693 33, 652 36, 323 40, 218 44, 639 50, 626 58, 451 63, 181 66, 022 0. 97 0. 99 1. 00 1. 04 1. 05 1. 09 1. 04 0. 98 0. 92 0. 90 0. 76 Annual growth rate of Jews (%) 1. 50 1. 08 1. 50 0. 78 0. 82 1. 50 0. 67 0. 62 0. 81 0. 30 -1. 43 Annual growth rate of total (%) 1. 34 0. 97 1. 05 0. 70 0. 67 0. 76 1. 13 1. 04 1. 26 1. 44 0. 52 0. 55 *For the borders of Germany see Appendix A and Map 3. 2. Sources: Blau (unpublished manuscript, p. 276, table 54); Bennathan (1932, p. 95, table 5). 12
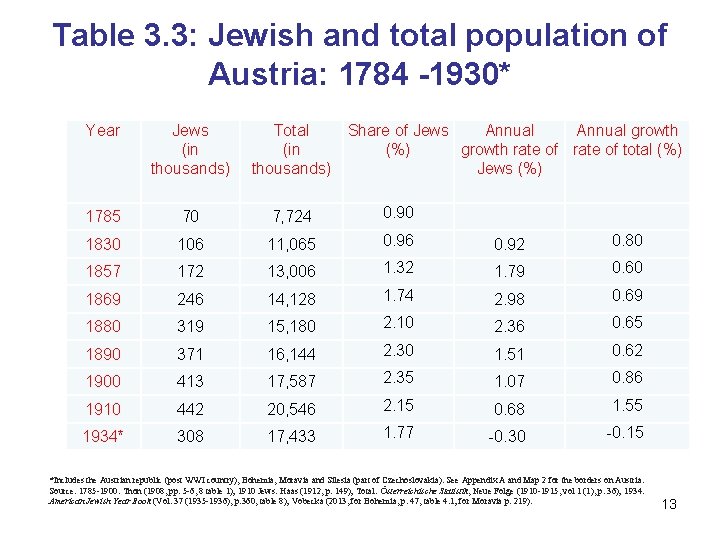
Table 3. 3: Jewish and total population of Austria: 1784 -1930* Year Jews (in thousands) Total (in thousands) Share of Jews Annual growth (%) growth rate of total (%) Jews (%) 1785 70 7, 724 0. 90 1830 106 11, 065 0. 96 0. 92 0. 80 1857 172 13, 006 1. 32 1. 79 0. 60 1869 246 14, 128 1. 74 2. 98 0. 69 1880 319 15, 180 2. 10 2. 36 0. 65 1890 371 16, 144 2. 30 1. 51 0. 62 1900 413 17, 587 2. 35 1. 07 0. 86 1910 442 20, 546 2. 15 0. 68 1. 55 1934* 308 17, 433 1. 77 -0. 30 -0. 15 *Includes the Austrian republic (post WWI country), Bohemia, Moravia and Silesia (part of Czechoslovakia). See Appendix A and Map 2 for the borders on Austria. Source: 1785 -1900: Thon (1908, pp. 5 -6, 8 table 1); 1910 Jews: Haas (1912, p. 149); Total: Österreichische Statistik, Neue Folge (1910 -1915, vol 1 (1), p. 36); 1934: American Jewish Year Book (Vol. 37 (1935 -1936), p. 360, table 8); Vobecka (2013, for Bohemia, p. 47, table 4. 1; for Moravia p. 219). 13
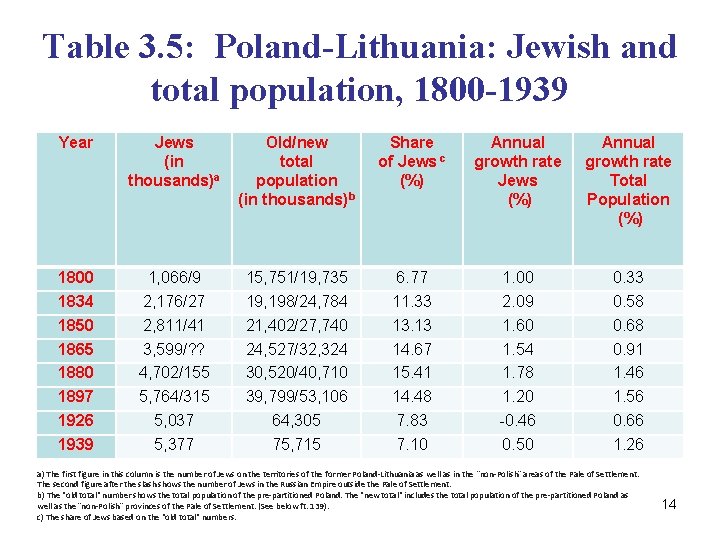
Table 3. 5: Poland-Lithuania: Jewish and total population, 1800 -1939 Year Jews (in thousands)a Old/new total population (in thousands)b Share of Jews c (%) Annual growth rate Jews (%) Annual growth rate Total Population (%) 1800 1834 1850 1865 1880 1897 1926 1939 1, 066/9 2, 176/27 2, 811/41 3, 599/? ? 4, 702/155 5, 764/315 5, 037 5, 377 15, 751/19, 735 19, 198/24, 784 21, 402/27, 740 24, 527/32, 324 30, 520/40, 710 39, 799/53, 106 64, 305 75, 715 6. 77 11. 33 13. 13 14. 67 15. 41 14. 48 7. 83 7. 10 1. 00 2. 09 1. 60 1. 54 1. 78 1. 20 -0. 46 0. 50 0. 33 0. 58 0. 68 0. 91 1. 46 1. 56 0. 66 1. 26 a) The first figure in this column is the number of Jews on the territories of the former Poland-Lithuania as well as in the “non-Polish” areas of the Pale of Settlement. The second figure after the slash shows the number of Jews in the Russian Empire outside the Pale of Settlement. b) The "old total" number shows the total population of the pre-partitioned Poland. The "new total" includes the total population of the pre-partitioned Poland as well as the “non-Polish” provinces of the Pale of Settlement. (See below ft. 139). c) The share of Jews based on the "old total" numbers. 14
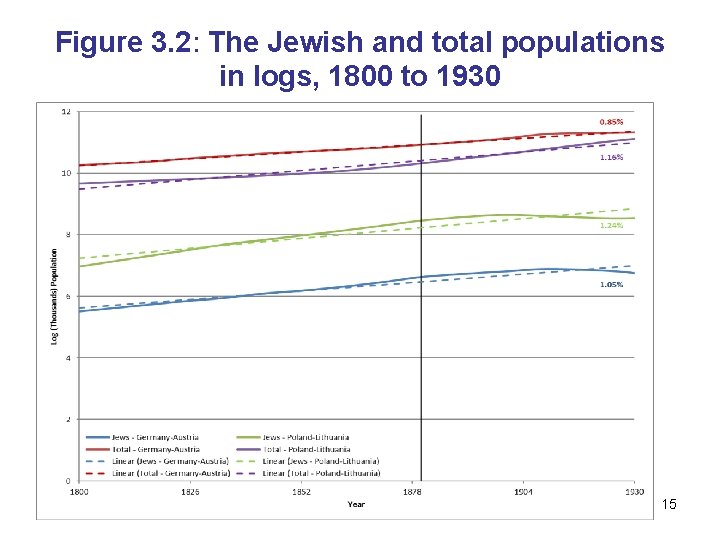
Figure 3. 2: The Jewish and total populations in logs, 1800 to 1930 15
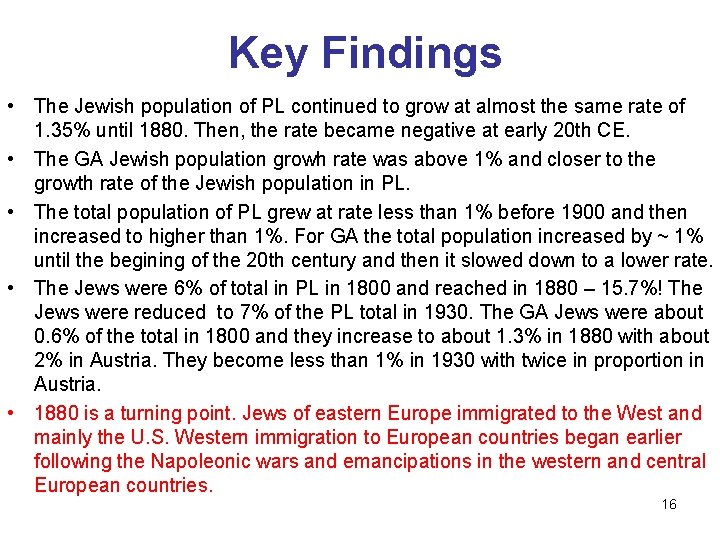
Key Findings • The Jewish population of PL continued to grow at almost the same rate of 1. 35% until 1880. Then, the rate became negative at early 20 th CE. • The GA Jewish population growh rate was above 1% and closer to the growth rate of the Jewish population in PL. • The total population of PL grew at rate less than 1% before 1900 and then increased to higher than 1%. For GA the total population increased by ~ 1% until the begining of the 20 th century and then it slowed down to a lower rate. • The Jews were 6% of total in PL in 1800 and reached in 1880 – 15. 7%! The Jews were reduced to 7% of the PL total in 1930. The GA Jews were about 0. 6% of the total in 1800 and they increase to about 1. 3% in 1880 with about 2% in Austria. They become less than 1% in 1930 with twice in proportion in Austria. • 1880 is a turning point. Jews of eastern Europe immigrated to the West and mainly the U. S. Western immigration to European countries began earlier following the Napoleonic wars and emancipations in the western and central European countries. 16
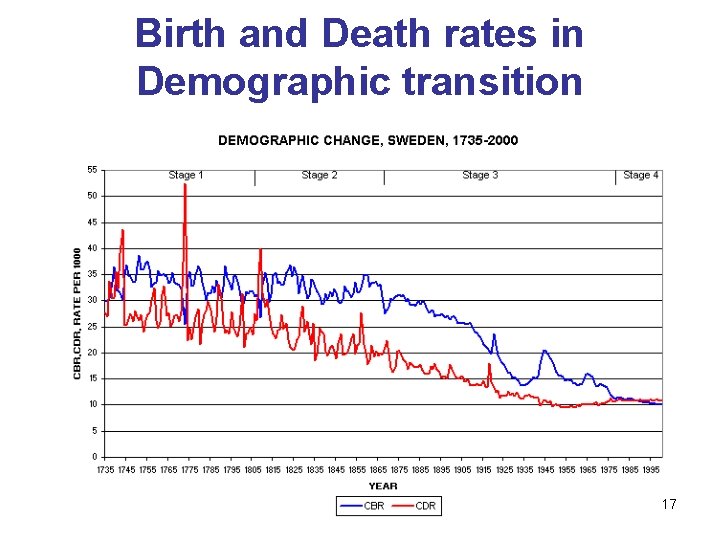
Birth and Death rates in Demographic transition 17
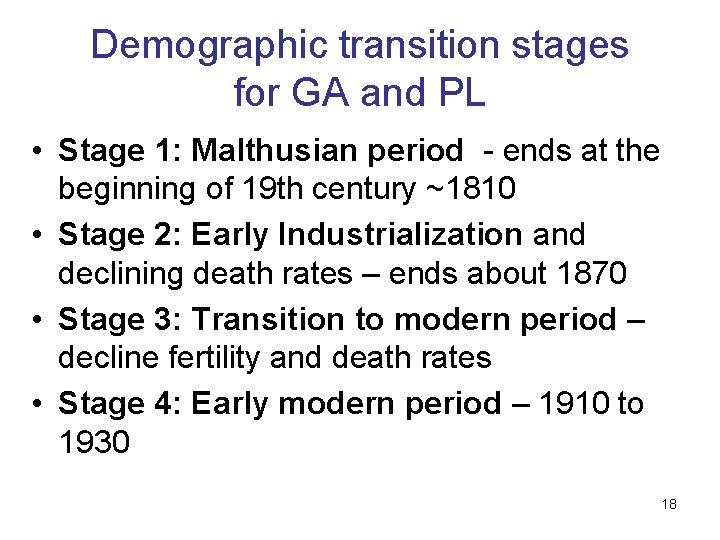
Demographic transition stages for GA and PL • Stage 1: Malthusian period - ends at the beginning of 19 th century ~1810 • Stage 2: Early Industrialization and declining death rates – ends about 1870 • Stage 3: Transition to modern period – decline fertility and death rates • Stage 4: Early modern period – 1910 to 1930 18
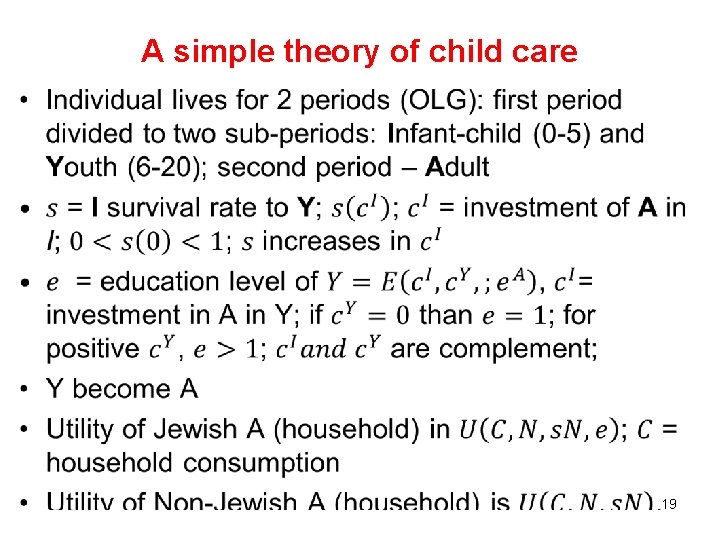
A simple theory of child care • 19
A simple theory of child care (cont. ) • 20
A simple theory of child care (cont. ) • 21
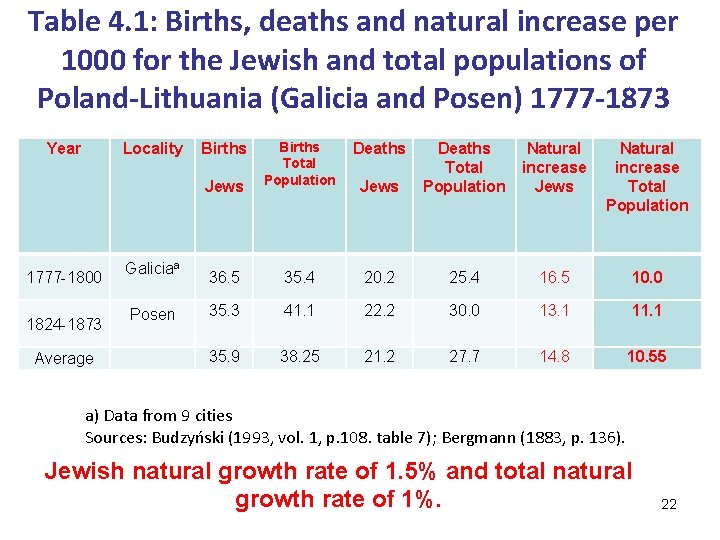
Table 4. 1: Births, deaths and natural increase per 1000 for the Jewish and total populations of Poland-Lithuania (Galicia and Posen) 1777 -1873 Year Locality Births Jews Births Total Population 36. 5 Deaths Jews Deaths Total Population Natural increase Jews Natural increase Total Population 35. 4 20. 2 25. 4 16. 5 10. 0 1777 -1800 Galiciaa 1824 -1873 Posen 35. 3 41. 1 22. 2 30. 0 13. 1 11. 1 Average 35. 9 38. 25 21. 2 27. 7 14. 8 10. 55 a) Data from 9 cities Sources: Budzyński (1993, vol. 1, p. 108. table 7); Bergmann (1883, p. 136). Jewish natural growth rate of 1. 5% and total natural growth rate of 1%. 22
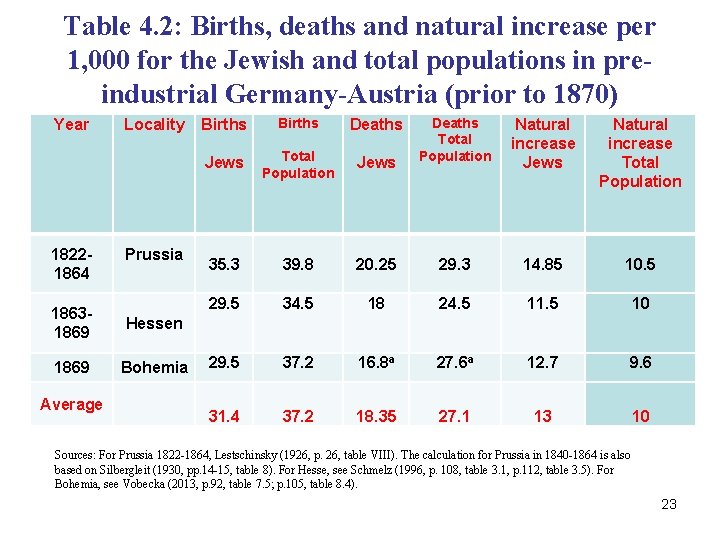
Table 4. 2: Births, deaths and natural increase per 1, 000 for the Jewish and total populations in preindustrial Germany-Austria (prior to 1870) Year Locality Births Jews Births Total Population Deaths Total Jews Population Natural increase Jews Natural increase Total Population 18221864 Prussia 18631869 Hessen 1869 Bohemia Average 35. 3 39. 8 20. 25 29. 3 14. 85 10. 5 29. 5 34. 5 18 24. 5 11. 5 10 29. 5 37. 2 16. 8 a 27. 6 a 12. 7 9. 6 31. 4 37. 2 18. 35 27. 1 13 10 Sources: For Prussia 1822 -1864, Lestschinsky (1926, p. 26, table VIII). The calculation for Prussia in 1840 -1864 is also based on Silbergleit (1930, pp. 14 -15, table 8). For Hesse, see Schmelz (1996, p. 108, table 3. 1, p. 112, table 3. 5). For Bohemia, see Vobecka (2013, p. 92, table 7. 5; p. 105, table 8. 4). 23
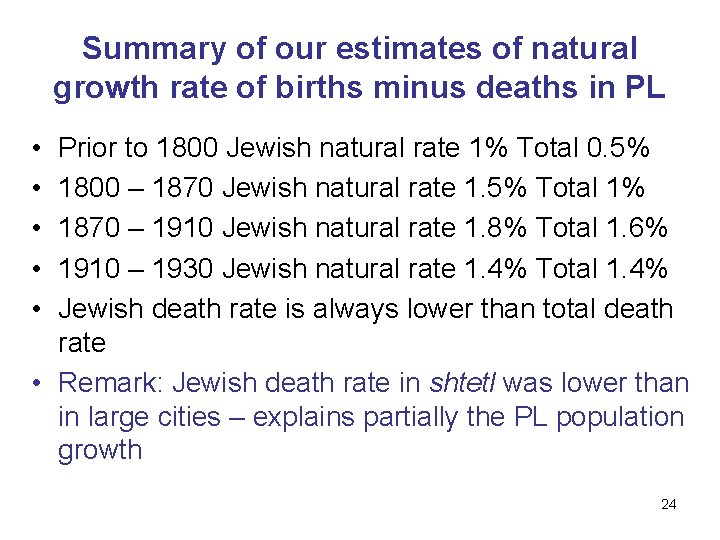
Summary of our estimates of natural growth rate of births minus deaths in PL • • • Prior to 1800 Jewish natural rate 1% Total 0. 5% 1800 – 1870 Jewish natural rate 1. 5% Total 1% 1870 – 1910 Jewish natural rate 1. 8% Total 1. 6% 1910 – 1930 Jewish natural rate 1. 4% Total 1. 4% Jewish death rate is always lower than total death rate • Remark: Jewish death rate in shtetl was lower than in large cities – explains partially the PL population growth 24
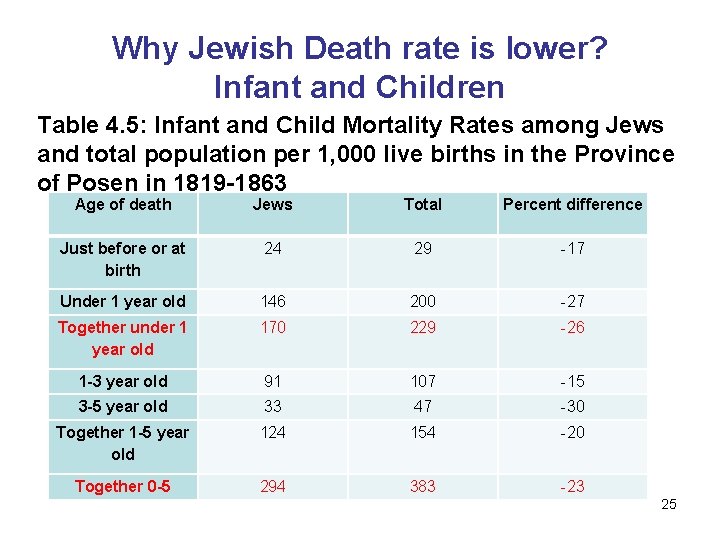
Why Jewish Death rate is lower? Infant and Children Table 4. 5: Infant and Child Mortality Rates among Jews and total population per 1, 000 live births in the Province of Posen in 1819 -1863 Age of death Jews Total Percent difference Just before or at birth 24 29 -17 Under 1 year old 146 200 -27 Together under 1 year old 170 229 -26 1 -3 year old 91 107 -15 3 -5 year old 33 47 -30 Together 1 -5 year old 124 154 -20 Together 0 -5 294 383 -23 25
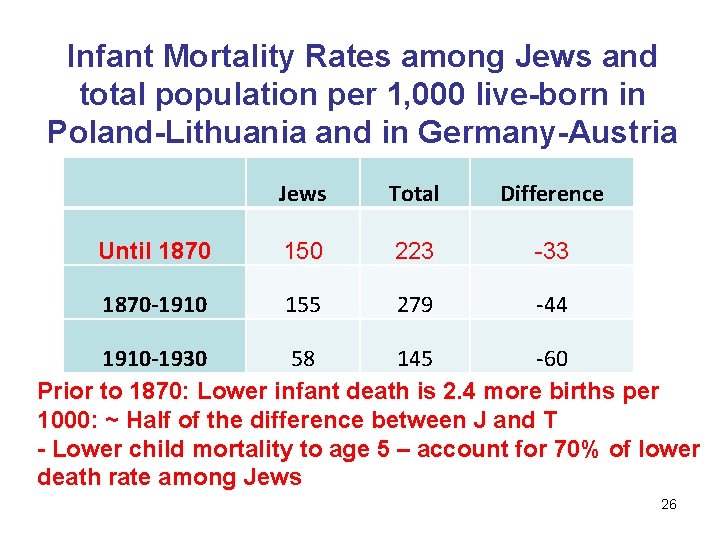
Infant Mortality Rates among Jews and total population per 1, 000 live-born in Poland-Lithuania and in Germany-Austria Jews Total Difference Until 1870 150 223 -33 1870 -1910 155 279 -44 1910 -1930 58 145 -60 Prior to 1870: Lower infant death is 2. 4 more births per 1000: ~ Half of the difference between J and T - Lower child mortality to age 5 – account for 70% of lower death rate among Jews 26
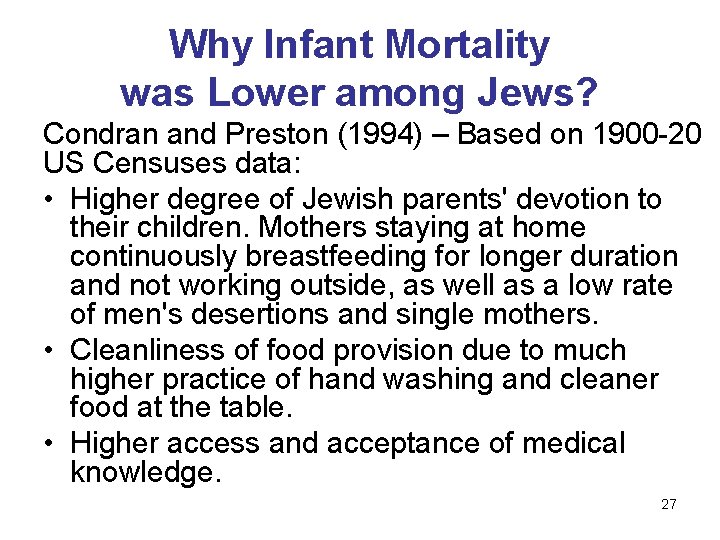
Why Infant Mortality was Lower among Jews? Condran and Preston (1994) – Based on 1900 -20 US Censuses data: • Higher degree of Jewish parents' devotion to their children. Mothers staying at home continuously breastfeeding for longer duration and not working outside, as well as a low rate of men's desertions and single mothers. • Cleanliness of food provision due to much higher practice of hand washing and cleaner food at the table. • Higher access and acceptance of medical knowledge. 27
Child Care among Jews and Gentiles • " Different breast-feeding cutoms [. . . ] may in themselves explain most of [. . . ] the different characteristic patterns of infant mortality. “ Lithell (1981) • Talmud reflects a most positive attitude to breastfeeding and rules that breastfeeding must be sustained for an extended period if one wishes to guarantee the optimal health and development of the newborn infant. (Eidelman, 2006). • The Talmud in general prescribed that a baby should nurse for 24 months. • Modern research underline the importance of frequent and prolonged breastfeeding. 28
Child care (cont. ): Talmud • "If the mother was nursing – the amount of handiwork should be reduced and the amount for her maintenance should be increased“ (Mishna) • Care for living baby was more important than procreation commandment on men or new pregnancy – spacing between children improve their development • The nursing woman was not allowed to remarry until 24 months have elapsed for fear she become pregnant again and her milk would deteriorate or she would care for new husband • Wet nursing in mother’s home without changing breastfeeding source • Rabbinic discussion of re-marriage and family obligations shows that the child's welfare and care is more important than parental interest and it’s central to family concerns • Talmud recognizes changes in child's cognitive skills and uses them as a basis for stages in education. Childhood is viewed as a dynamic and unique process. 29
Childcare in Ashkenaz in the Middle Ages • Duration of breastfeeding and obligation to children were an important topic in sages’ writings. • Medieval sages accepted the ancient ruling of 24 months as a period of breastfeeding and enhanced it. • Wet nursing was common and was supervised by the mother; Among Jews: wet-nurse contract for 2 years at home. • Jews were permitted to use contraception to prolong breastfeeding and avoid new pregancy. • Sages emphasized the need to keep the same milk source and use contraception to keep high quality breastfeeding. 30
Childcare Middle Ages (cont. ) • Christians: some use same practice as Jews but Church did not insist on duration breastfeeding, wet-nursing at home and health of the baby at center. It insisted on procreation. • Centuries of Childhood, P. Ariès argued that in the Middle Ages childhood was not recognized as a distinct phase in human life. • Ariès (p. 411); “. . no idea of education, " and only with decrease in child's mortality, the affection and interest in children increased, and schooling began the production of childhood culture. • Recent historians find that Ariès’s argument it too extreme; families that educated the children did care for the children. 31
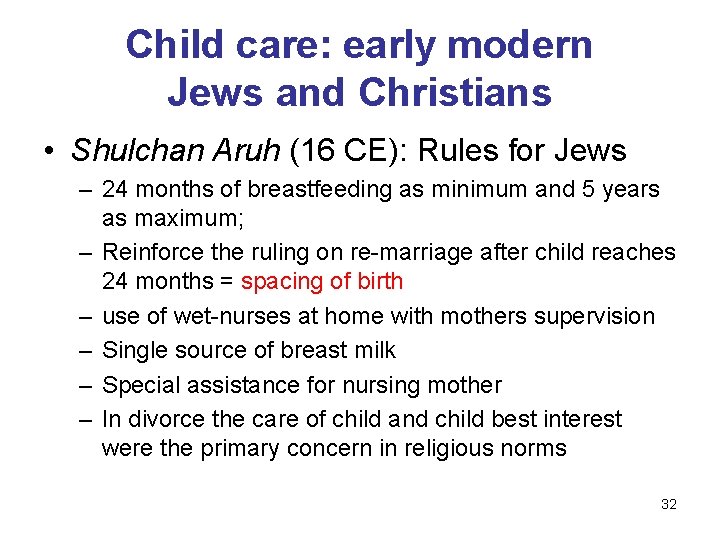
Child care: early modern Jews and Christians • Shulchan Aruh (16 CE): Rules for Jews – 24 months of breastfeeding as minimum and 5 years as maximum; – Reinforce the ruling on re-marriage after child reaches 24 months = spacing of birth – use of wet-nurses at home with mothers supervision – Single source of breast milk – Special assistance for nursing mother – In divorce the care of child and child best interest were the primary concern in religious norms 32
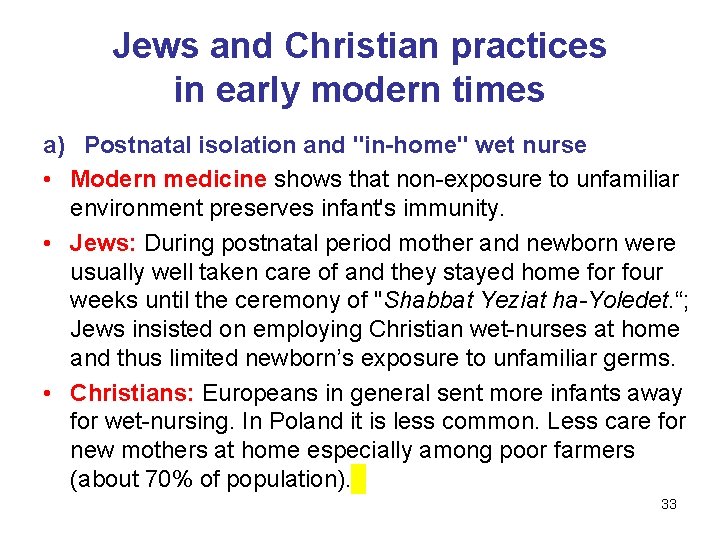
Jews and Christian practices in early modern times a) Postnatal isolation and "in-home" wet nurse • Modern medicine shows that non-exposure to unfamiliar environment preserves infant's immunity. • Jews: During postnatal period mother and newborn were usually well taken care of and they stayed home for four weeks until the ceremony of "Shabbat Yeziat ha-Yoledet. “; Jews insisted on employing Christian wet-nurses at home and thus limited newborn’s exposure to unfamiliar germs. • Christians: Europeans in general sent more infants away for wet-nursing. In Poland it is less common. Less care for new mothers at home especially among poor farmers (about 70% of population). 33
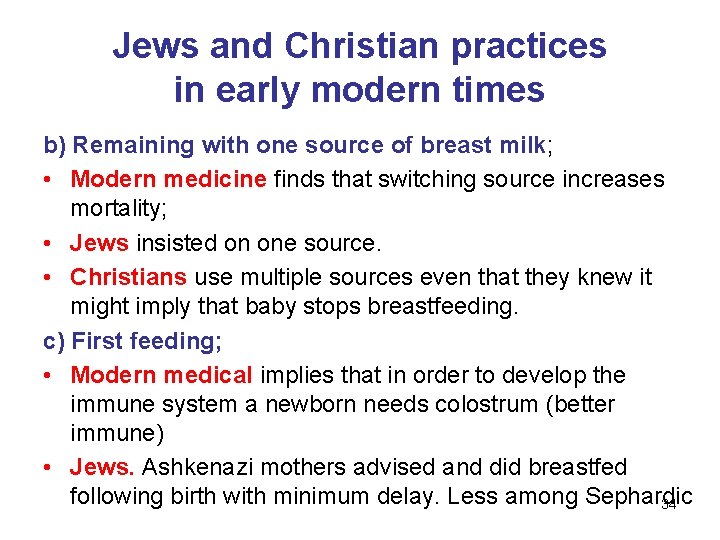
Jews and Christian practices in early modern times b) Remaining with one source of breast milk; • Modern medicine finds that switching source increases mortality; • Jews insisted on one source. • Christians use multiple sources even that they knew it might imply that baby stops breastfeeding. c) First feeding; • Modern medical implies that in order to develop the immune system a newborn needs colostrum (better immune) • Jews. Ashkenazi mothers advised and did breastfed following birth with minimum delay. Less among Sephardic 34
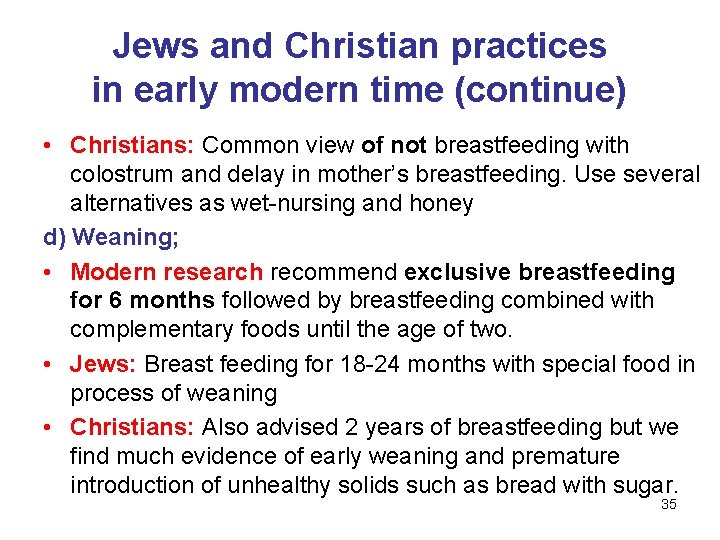
Jews and Christian practices in early modern time (continue) • Christians: Common view of not breastfeeding with colostrum and delay in mother’s breastfeeding. Use several alternatives as wet-nursing and honey d) Weaning; • Modern research recommend exclusive breastfeeding for 6 months followed by breastfeeding combined with complementary foods until the age of two. • Jews: Breast feeding for 18 -24 months with special food in process of weaning • Christians: Also advised 2 years of breastfeeding but we find much evidence of early weaning and premature introduction of unhealthy solids such as bread with sugar. 35
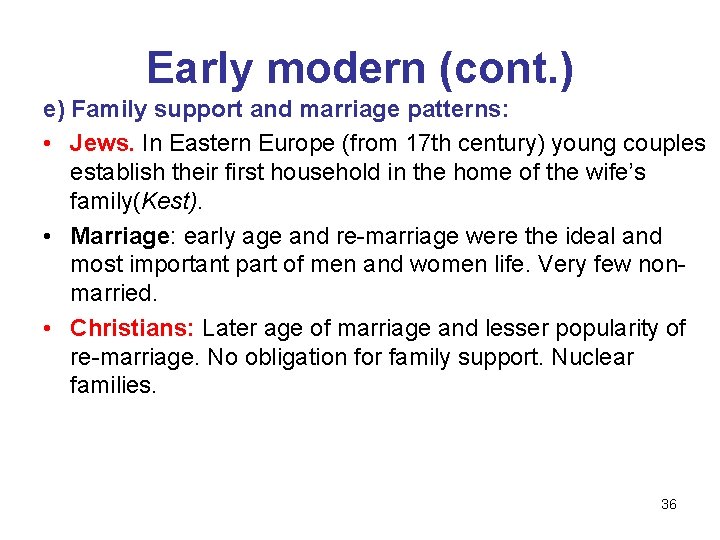
Early modern (cont. ) e) Family support and marriage patterns: • Jews. In Eastern Europe (from 17 th century) young couples establish their first household in the home of the wife’s family(Kest). • Marriage: early age and re-marriage were the ideal and most important part of men and women life. Very few nonmarried. • Christians: Later age of marriage and lesser popularity of re-marriage. No obligation for family support. Nuclear families. 36
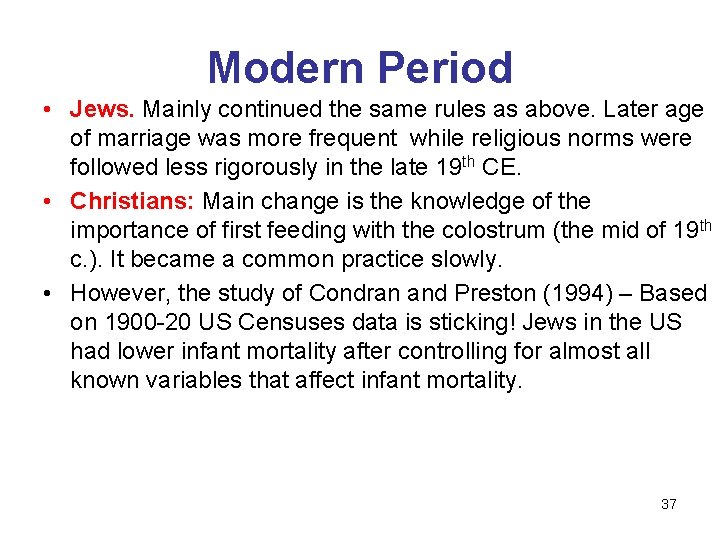
Modern Period • Jews. Mainly continued the same rules as above. Later age of marriage was more frequent while religious norms were followed less rigorously in the late 19 th CE. • Christians: Main change is the knowledge of the importance of first feeding with the colostrum (the mid of 19 th c. ). It became a common practice slowly. • However, the study of Condran and Preston (1994) – Based on 1900 -20 US Censuses data is sticking! Jews in the US had lower infant mortality after controlling for almost all known variables that affect infant mortality. 37
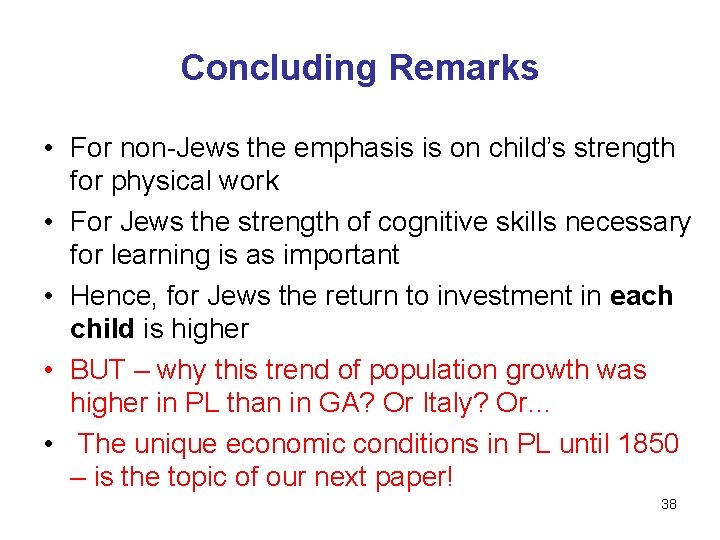
Concluding Remarks • For non-Jews the emphasis is on child’s strength for physical work • For Jews the strength of cognitive skills necessary for learning is as important • Hence, for Jews the return to investment in each child is higher • BUT – why this trend of population growth was higher in PL than in GA? Or Italy? Or… • The unique economic conditions in PL until 1850 – is the topic of our next paper! 38
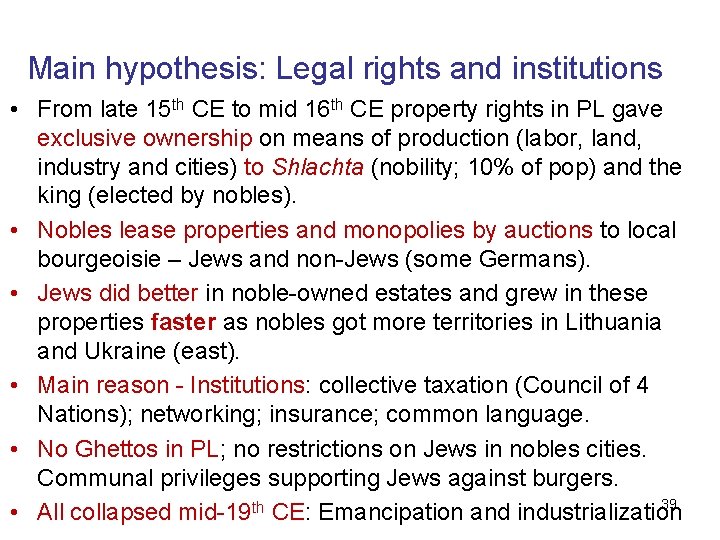
Main hypothesis: Legal rights and institutions • From late 15 th CE to mid 16 th CE property rights in PL gave exclusive ownership on means of production (labor, land, industry and cities) to Shlachta (nobility; 10% of pop) and the king (elected by nobles). • Nobles lease properties and monopolies by auctions to local bourgeoisie – Jews and non-Jews (some Germans). • Jews did better in noble-owned estates and grew in these properties faster as nobles got more territories in Lithuania and Ukraine (east). • Main reason - Institutions: collective taxation (Council of 4 Nations); networking; insurance; common language. • No Ghettos in PL; no restrictions on Jews in nobles cities. Communal privileges supporting Jews against burgers. 39 • All collapsed mid-19 th CE: Emancipation and industrialization
Thank you!! 40