Natasha Weaver Ph D School of Medicine and





- Slides: 16
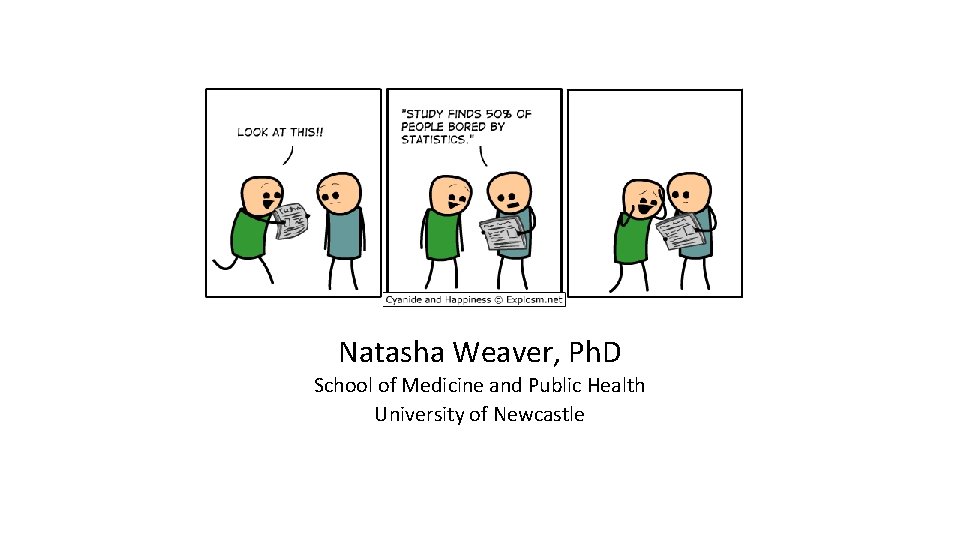
Natasha Weaver, Ph. D School of Medicine and Public Health University of Newcastle
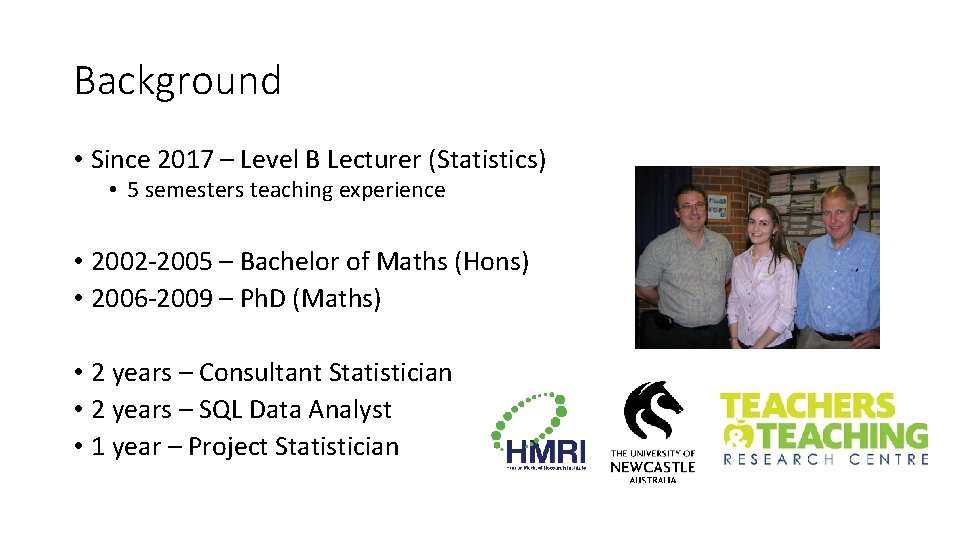
Background • Since 2017 – Level B Lecturer (Statistics) • 5 semesters teaching experience • 2002 -2005 – Bachelor of Maths (Hons) • 2006 -2009 – Ph. D (Maths) • 2 years – Consultant Statistician • 2 years – SQL Data Analyst • 1 year – Project Statistician
Teaching - service courses • BIOS 6910 (Bios A) ~250 students per year (25% Public Health) • BIOS 6920 (Bios B) ~70 students per year (50% Public Health) • Postgraduate students (Master or Ph. D) from many different subject areas across School/Faculty • Diverse backgrounds • Face-to-face or online/distance
Teaching - curriculum development • Master of Medical Statistics • 8 courses (1 year FT, 2 year PT) • Online only • All new courses development from scratch since 2017: • BIOS 6040 – Mathematics for Applied Statistics • BIOS 6170 – Foundations of Probability Theory • STAT 6001 – Data Wrangling and Visualisation • Some modelling courses are electives offered to PH students
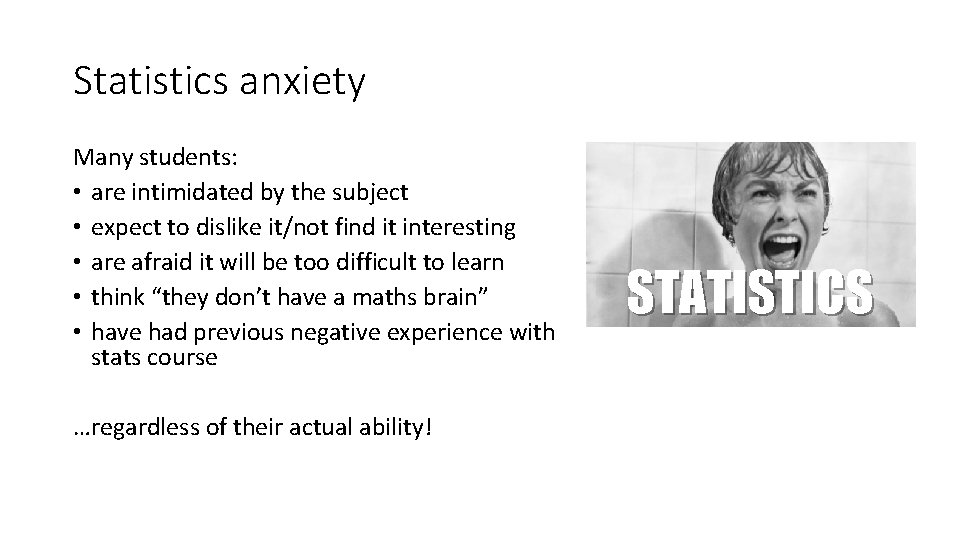
Statistics anxiety Many students: • are intimidated by the subject • expect to dislike it/not find it interesting • are afraid it will be too difficult to learn • think “they don’t have a maths brain” • have had previous negative experience with stats course …regardless of their actual ability! STATISTICS
Approach • Enthusiasm for the subject & its importance • Growth mindset: praise effort & sticking with it • “Borrowed” self-efficacy • Recognise individual abilities and goals • Cater to diverse needs (mix of practice and theory, mix of content media)
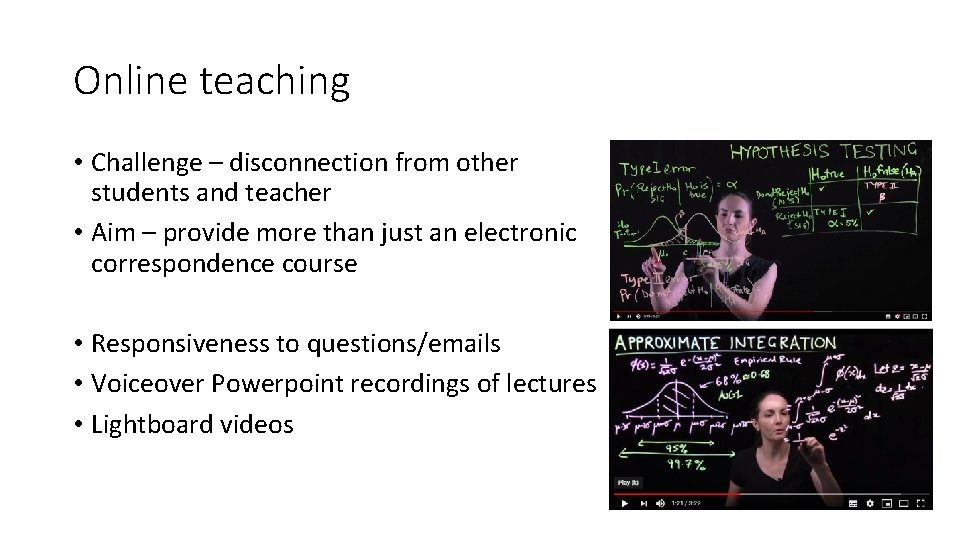
Online teaching • Challenge – disconnection from other students and teacher • Aim – provide more than just an electronic correspondence course • Responsiveness to questions/emails • Voiceover Powerpoint recordings of lectures • Lightboard videos
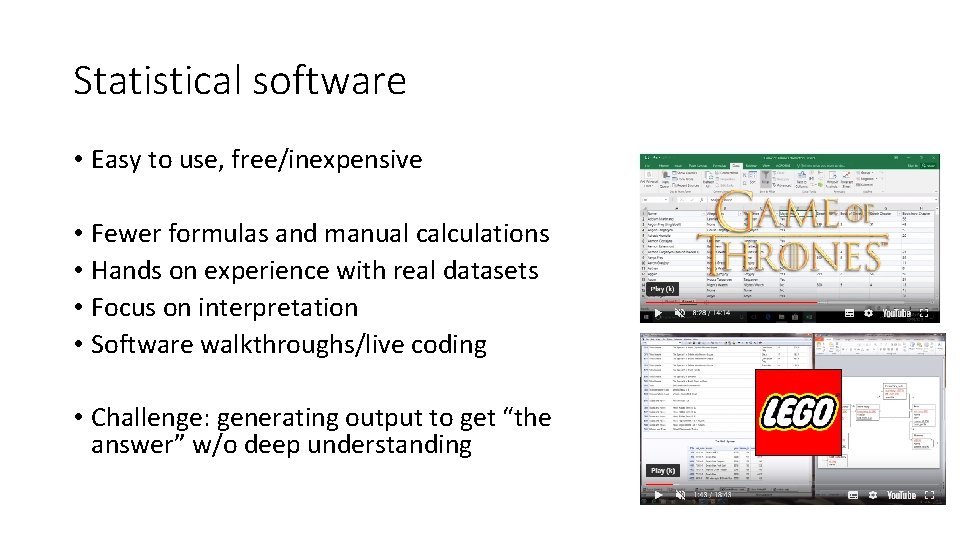
Statistical software • Easy to use, free/inexpensive • Fewer formulas and manual calculations • Hands on experience with real datasets • Focus on interpretation • Software walkthroughs/live coding • Challenge: generating output to get “the answer” w/o deep understanding
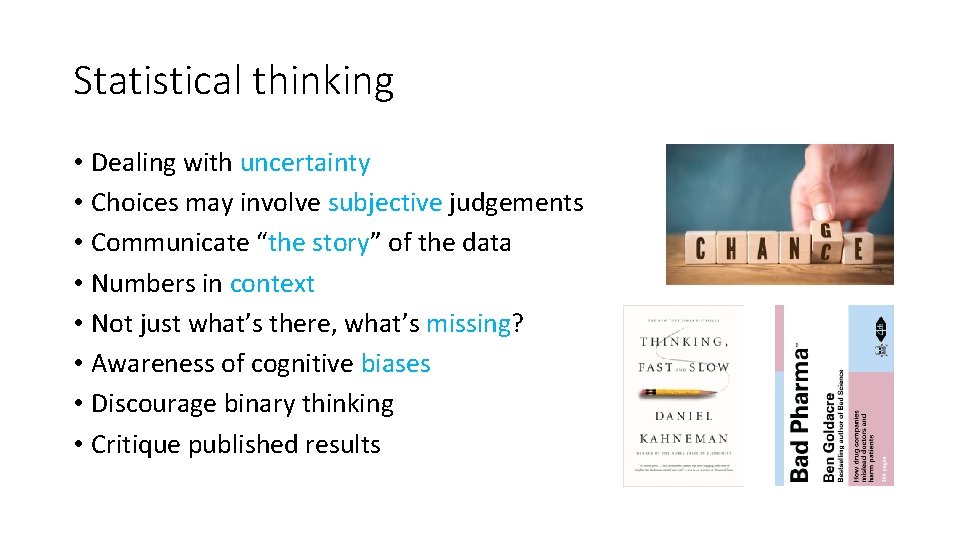
Statistical thinking • Dealing with uncertainty • Choices may involve subjective judgements • Communicate “the story” of the data • Numbers in context • Not just what’s there, what’s missing? • Awareness of cognitive biases • Discourage binary thinking • Critique published results
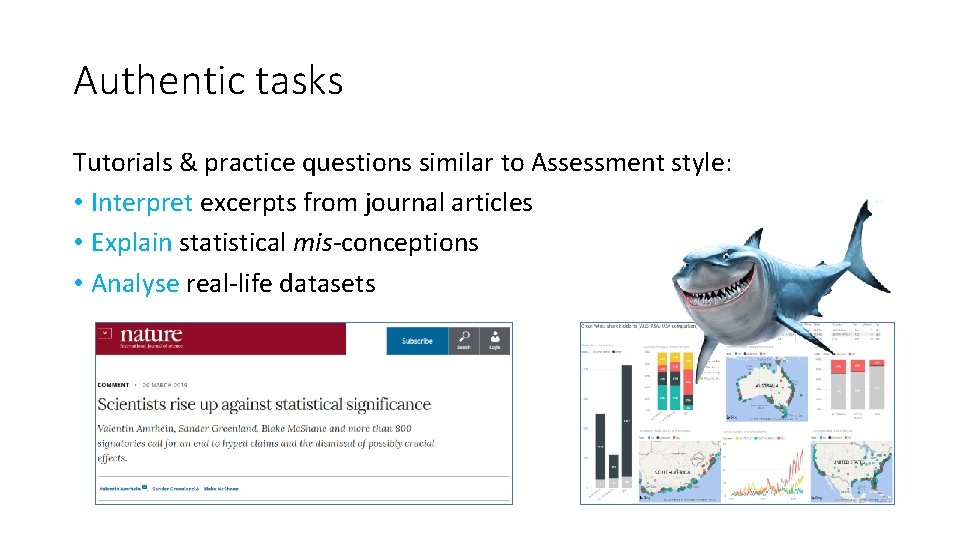
Authentic tasks Tutorials & practice questions similar to Assessment style: • Interpret excerpts from journal articles • Explain statistical mis-conceptions • Analyse real-life datasets
Multiple testing https: //xkcd. com/882/
Odds Ratio & Relative Risk Ticket img source
Correlation vs. Causation https: //xkcd. com/552/ Source
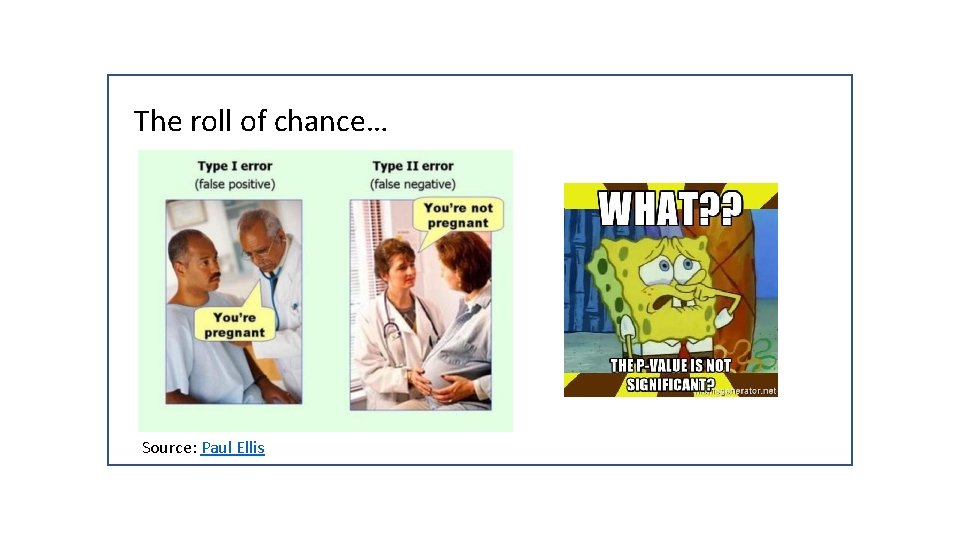
The roll of chance… Source: Paul Ellis