MSA SANJAY KUMAR DEO 1 INDIAN INSTITUTE OF
- Slides: 17
MSA • SANJAY KUMAR DEO 1 • INDIAN INSTITUTE OF TECHNOLOGY ROORKEE 2 • PROJECT REPORT 2016 • MEASUREMENT SYSTEM ANALYSIS • PROJECT GUIDEs 3 • Mr. R a m durai • Mr. G u n j e s h K u m a r • Mr. S a r f r a z A h m e d
• 1. Determine which measurement system will be studied ACCORDING TO MSA PLAN AND THE STUDY OF GAGE R & r. • 2. Establish test procedure IN DIFFERENT DEPARTMENTS FOR GAGE R & r. • 3. Establish the number of sample parts, the number of repeated readings, and the number of operators that will be used. • 4. Choose operators and sample parts.
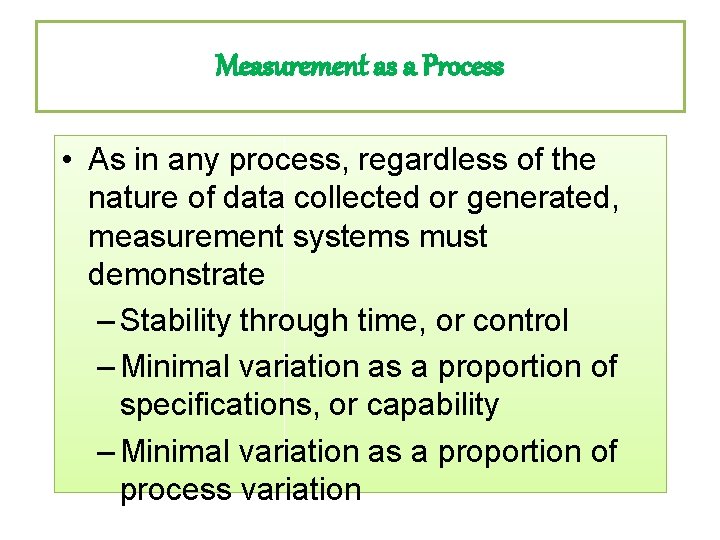
Measurement as a Process • As in any process, regardless of the nature of data collected or generated, measurement systems must demonstrate – Stability through time, or control – Minimal variation as a proportion of specifications, or capability – Minimal variation as a proportion of process variation
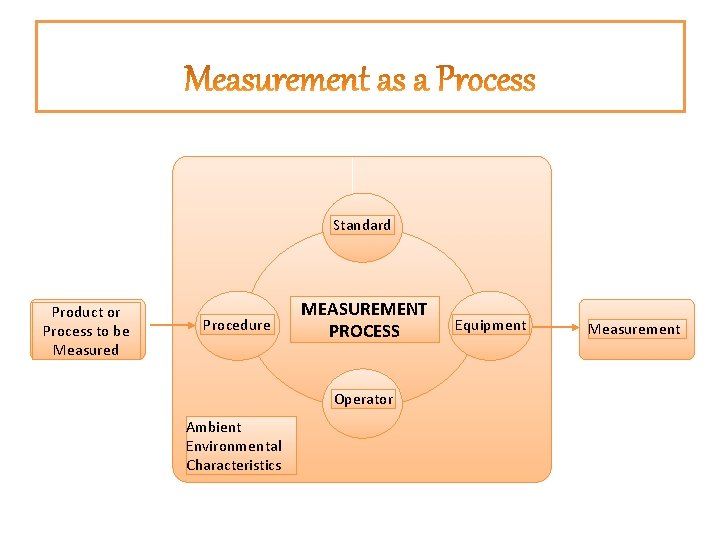
Standard Product or Process to be Measured Procedure MEASUREMENT PROCESS Operator Ambient Environmental Characteristics Equipment Measurement
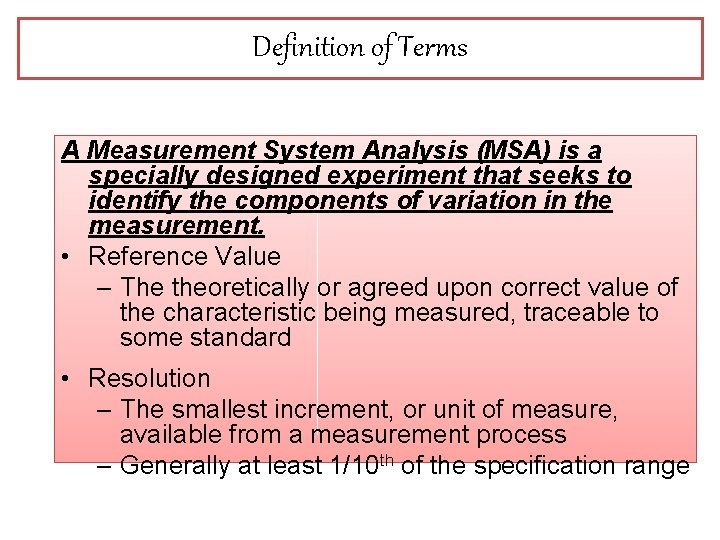
Definition of Terms A Measurement System Analysis (MSA) is a specially designed experiment that seeks to identify the components of variation in the measurement. • Reference Value – The theoretically or agreed upon correct value of the characteristic being measured, traceable to some standard • Resolution – The smallest increment, or unit of measure, available from a measurement process – Generally at least 1/10 th of the specification range
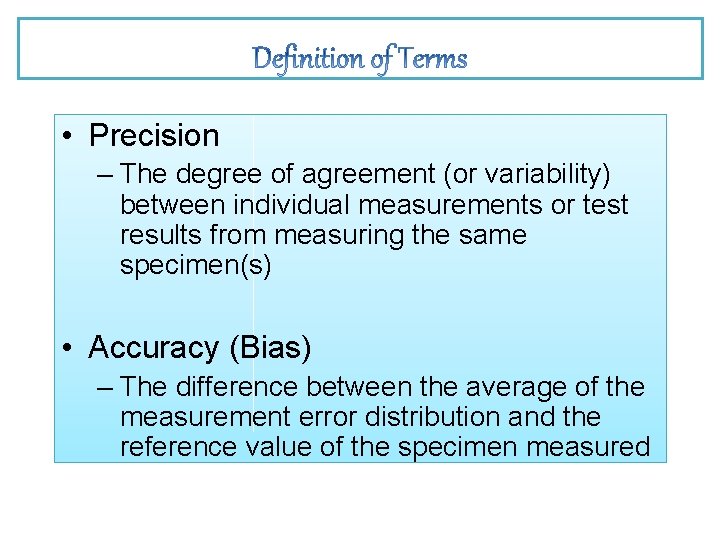
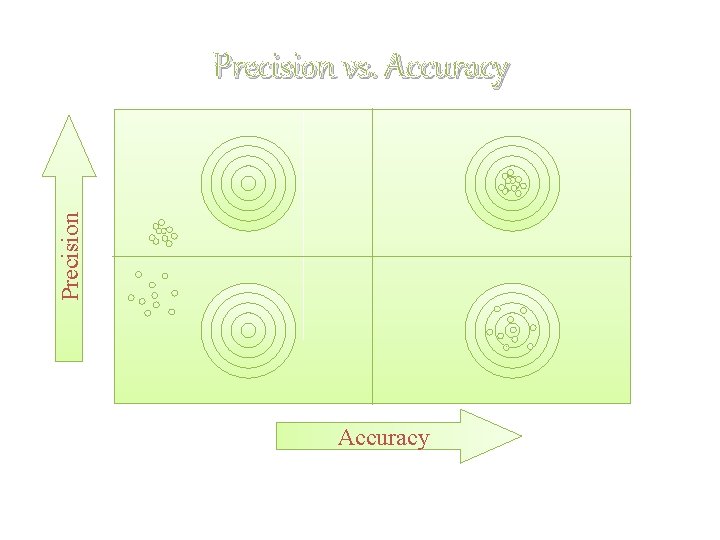
• Precision – The degree of agreement (or variability) between individual measurements or test results from measuring the same specimen(s) • Accuracy (Bias) – The difference between the average of the measurement error distribution and the reference value of the specimen measured
Precision vs. Accuracy
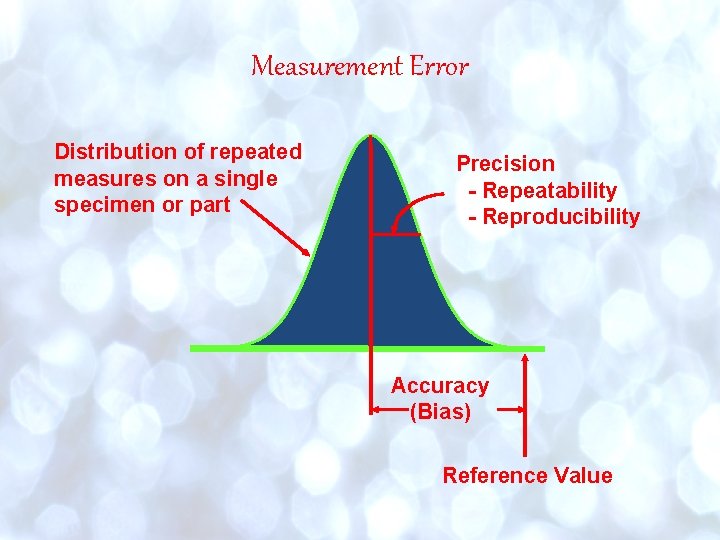
Measurement Error Distribution of repeated measures on a single specimen or part Precision - Repeatability - Reproducibility Accuracy (Bias) Reference Value
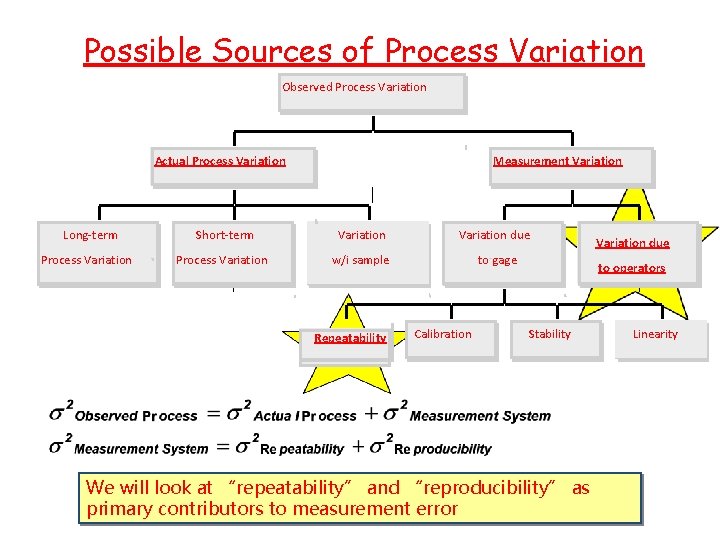
Possible Sources of Process Variation Observed Process Variation Actual Process Variation Long-term Process Variation Measurement Variation Short-term Variation due Process Variation w/i sample to gage Repeatability Calibration Variation due to operators Stability We will look at “repeatability” and “reproducibility” as primary contributors to measurement error Linearity
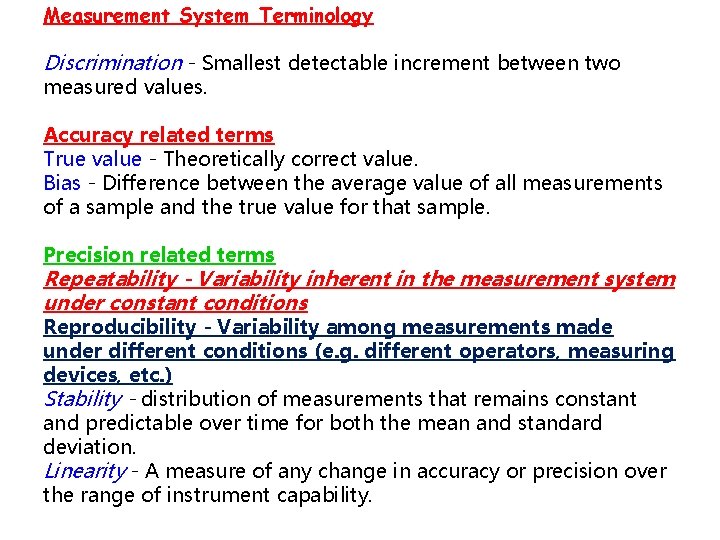
Measurement System Terminology Discrimination - Smallest detectable increment between two measured values. Accuracy related terms True value - Theoretically correct value. Bias - Difference between the average value of all measurements of a sample and the true value for that sample. Precision related terms Repeatability - Variability inherent in the measurement system under constant conditions Reproducibility - Variability among measurements made under different conditions (e. g. different operators, measuring devices, etc. ) Stability - distribution of measurements that remains constant and predictable over time for both the mean and standard deviation. Linearity - A measure of any change in accuracy or precision over the range of instrument capability.
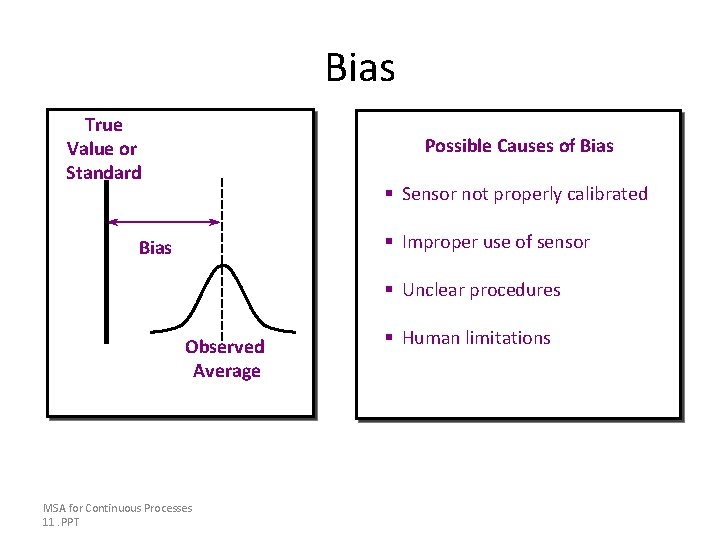
Bias True Value or Standard Possible Causes of Bias § Sensor not properly calibrated § Improper use of sensor Bias § Unclear procedures Observed Average MSA for Continuous Processes 11. PPT § Human limitations
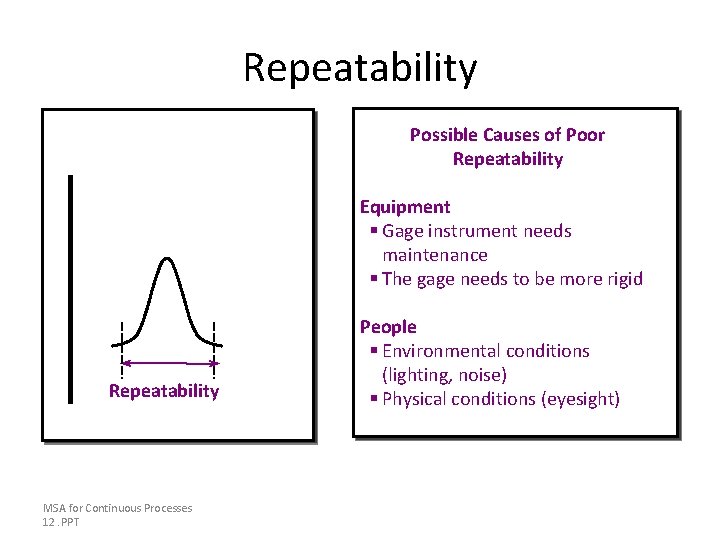
Repeatability Possible Causes of Poor Repeatability Equipment § Gage instrument needs maintenance § The gage needs to be more rigid Repeatability MSA for Continuous Processes 12. PPT People § Environmental conditions (lighting, noise) § Physical conditions (eyesight)
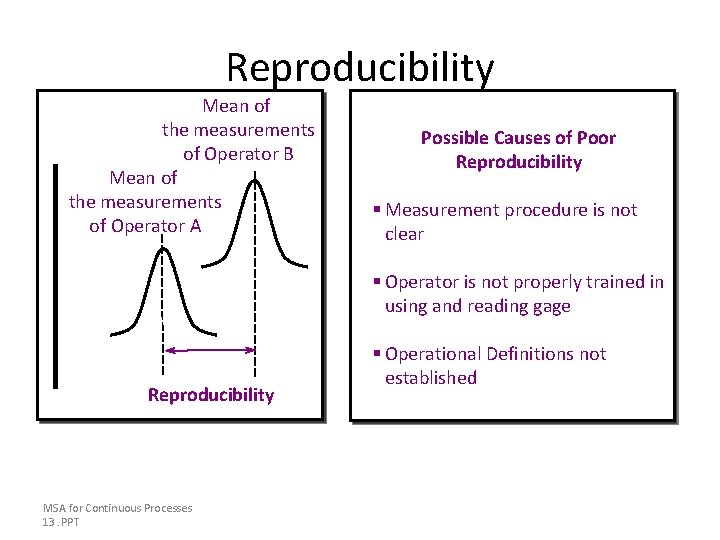
Reproducibility Mean of the measurements of Operator B Mean of the measurements of Operator A Possible Causes of Poor Reproducibility § Measurement procedure is not clear § Operator is not properly trained in using and reading gage Reproducibility MSA for Continuous Processes 13. PPT § Operational Definitions not established
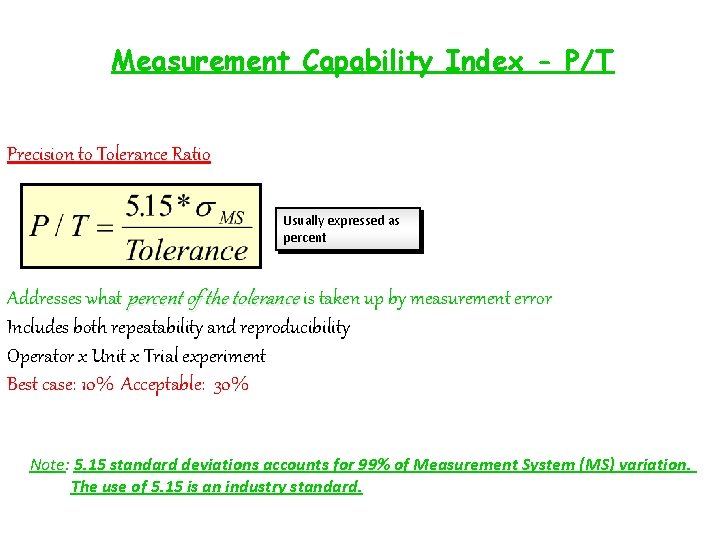
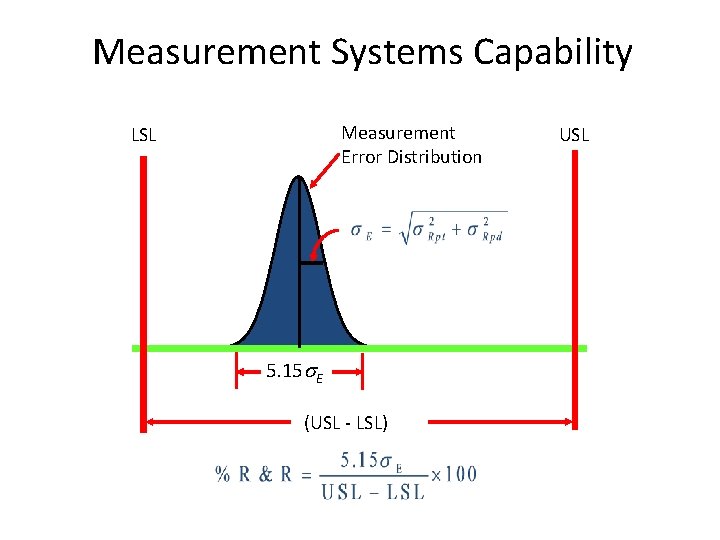
Measurement Capability Index - P/T Precision to Tolerance Ratio Usually expressed as percent Addresses what percent of the tolerance is taken up by measurement error Includes both repeatability and reproducibility Operator x Unit x Trial experiment Best case: 10% Acceptable: 30% Note: 5. 15 standard deviations accounts for 99% of Measurement System (MS) variation. The use of 5. 15 is an industry standard.
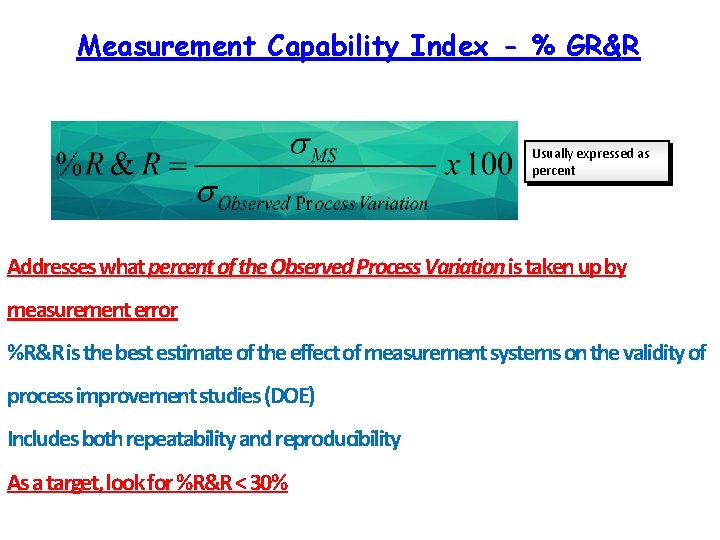
Measurement Capability Index - % GR&R Usually expressed as percent Addresses what percent of the Observed Process Variation is taken up by measurement error %R&R is the best estimate of the effect of measurement systems on the validity of process improvement studies (DOE) Includes both repeatability and reproducibility As a target, look for %R&R < 30%
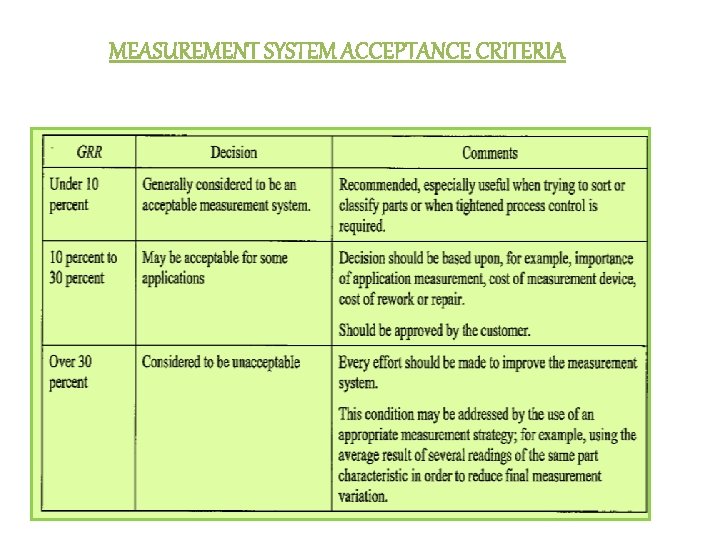
MEASUREMENT SYSTEM ACCEPTANCE CRITERIA
Measurement Systems Capability Measurement Error Distribution LSL 5. 15 E (USL - LSL) USL