MISCELLANY Xiaoyang Zhuang Economics 201 FS Duke University

- Slides: 15
MISCELLANY Xiaoyang Zhuang Economics 201 FS Duke University March 16, 2010
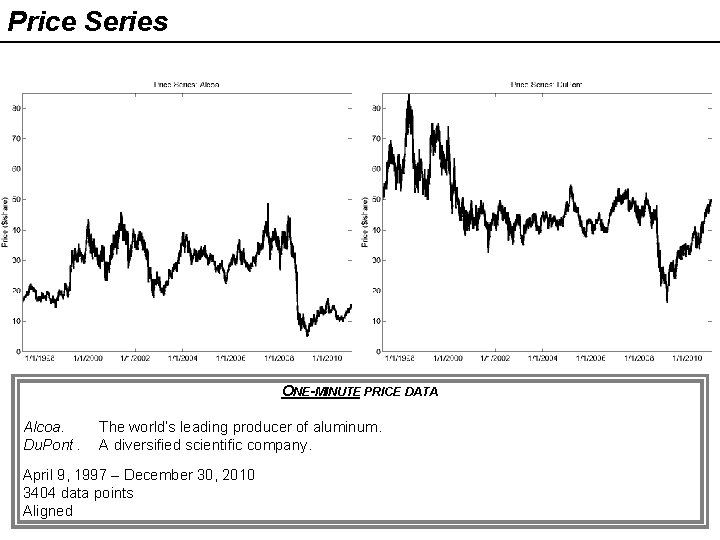
Price Series ONE-MINUTE PRICE DATA Alcoa. Du. Pont. The world’s leading producer of aluminum. A diversified scientific company. April 9, 1997 – December 30, 2010 3404 data points Aligned
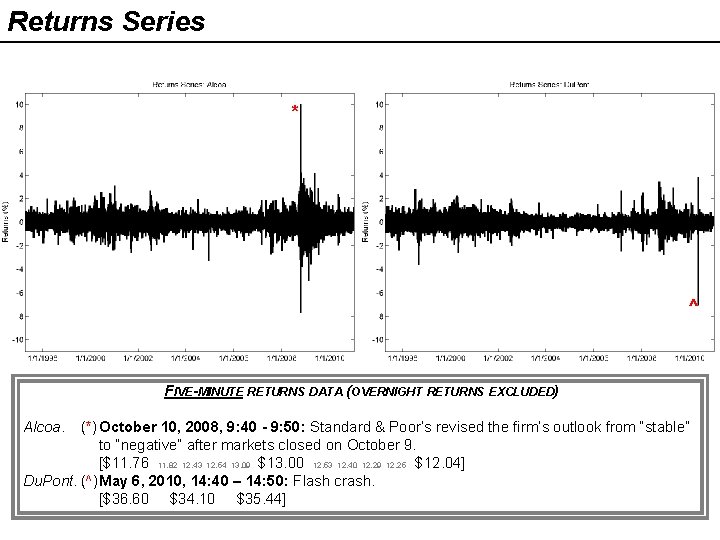
Returns Series * ^ FIVE-MINUTE RETURNS DATA (OVERNIGHT RETURNS EXCLUDED) Alcoa. (*) October 10, 2008, 9: 40 - 9: 50: Standard & Poor’s revised the firm’s outlook from “stable” to “negative” after markets closed on October 9. [$11. 76 11. 82 12. 43 12. 54 13. 09 $13. 00 12. 53 12. 40 12. 29 12. 25 $12. 04] Du. Pont. (^)May 6, 2010, 14: 40 – 14: 50: Flash crash. [$36. 60 $34. 10 $35. 44]
Contents 1. Separating Market Microstructure Noise from the Price Process 2. Using Overnight Returns to Predict (Next-Day) Price Reversal
Contents 1. Separating Market Microstructure Noise from the Price Process 2. Using Overnight Returns to Predict (Next-Day) Price Reversal
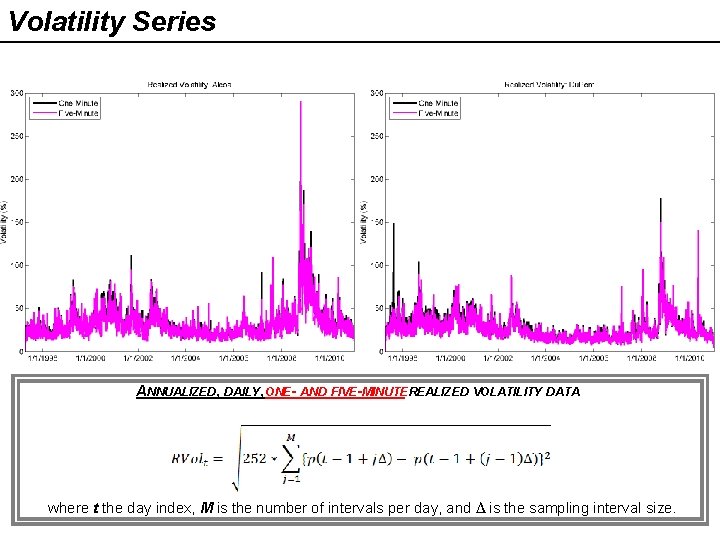
Volatility Series ANNUALIZED, DAILY, ONE- AND FIVE-MINUTE REALIZED VOLATILITY DATA where t the day index, M is the number of intervals per day, and ∆ is the sampling interval size.
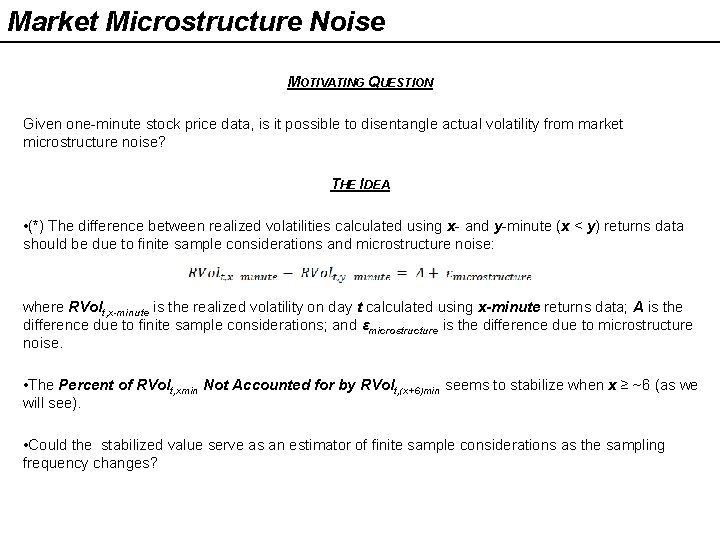
Market Microstructure Noise MOTIVATING QUESTION Given one-minute stock price data, is it possible to disentangle actual volatility from market microstructure noise? THE IDEA • (*) The difference between realized volatilities calculated using x- and y-minute (x < y) returns data should be due to finite sample considerations and microstructure noise: where RVolt, x-minute is the realized volatility on day t calculated using x-minute returns data; A is the difference due to finite sample considerations; and εmicrostructure is the difference due to microstructure noise. • The Percent of RVolt, xmin Not Accounted for by RVolt, (x+6)min seems to stabilize when x ≥ ~6 (as we will see). • Could the stabilized value serve as an estimator of finite sample considerations as the sampling frequency changes?
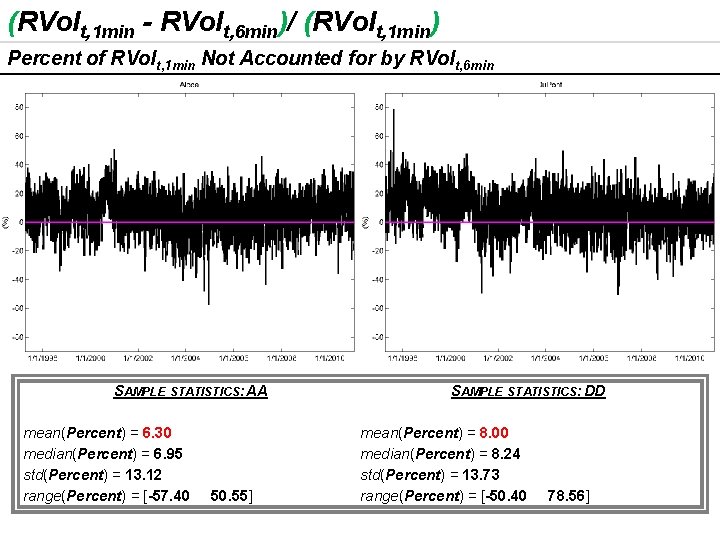
(RVolt, 1 min - RVolt, 6 min)/ (RVolt, 1 min) Percent of RVolt, 1 min Not Accounted for by RVolt, 6 min SAMPLE STATISTICS: AA mean(Percent) = 6. 30 median(Percent) = 6. 95 std(Percent) = 13. 12 range(Percent) = [-57. 40 50. 55] SAMPLE STATISTICS: DD mean(Percent) = 8. 00 median(Percent) = 8. 24 std(Percent) = 13. 73 range(Percent) = [-50. 40 78. 56]
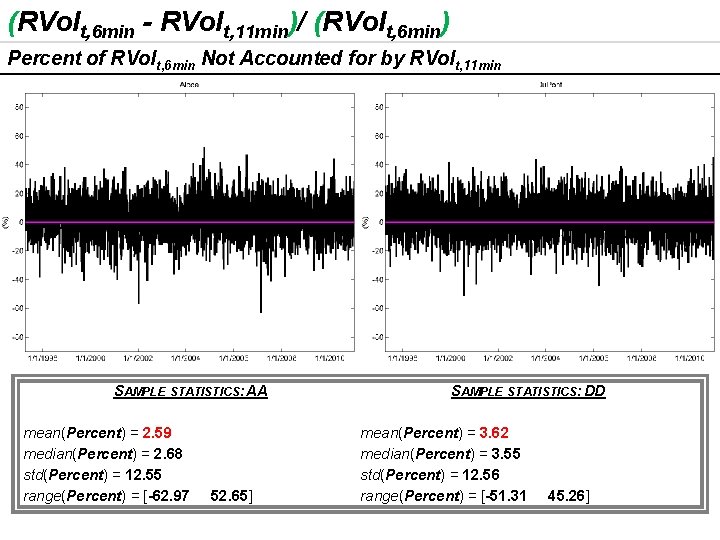
(RVolt, 6 min - RVolt, 11 min)/ (RVolt, 6 min) Percent of RVolt, 6 min Not Accounted for by RVolt, 11 min SAMPLE STATISTICS: AA mean(Percent) = 2. 59 median(Percent) = 2. 68 std(Percent) = 12. 55 range(Percent) = [-62. 97 52. 65] SAMPLE STATISTICS: DD mean(Percent) = 3. 62 median(Percent) = 3. 55 std(Percent) = 12. 56 range(Percent) = [-51. 31 45. 26]
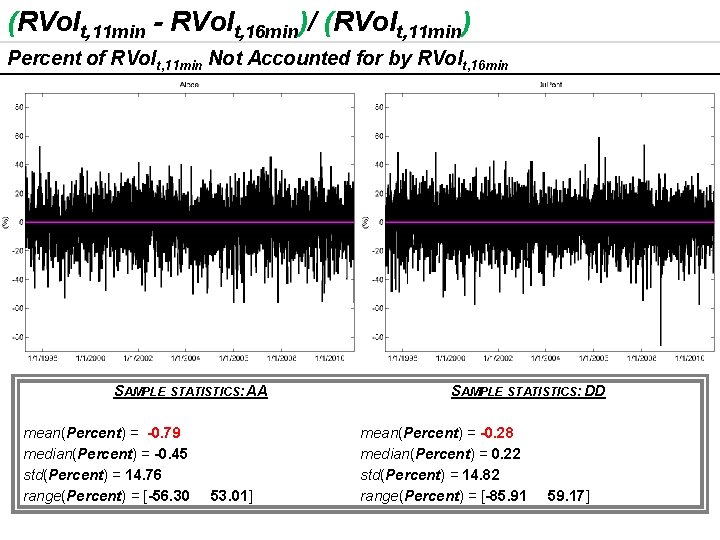
(RVolt, 11 min - RVolt, 16 min)/ (RVolt, 11 min) Percent of RVolt, 11 min Not Accounted for by RVolt, 16 min SAMPLE STATISTICS: AA mean(Percent) = -0. 79 median(Percent) = -0. 45 std(Percent) = 14. 76 range(Percent) = [-56. 30 53. 01] SAMPLE STATISTICS: DD mean(Percent) = -0. 28 median(Percent) = 0. 22 std(Percent) = 14. 82 range(Percent) = [-85. 91 59. 17]
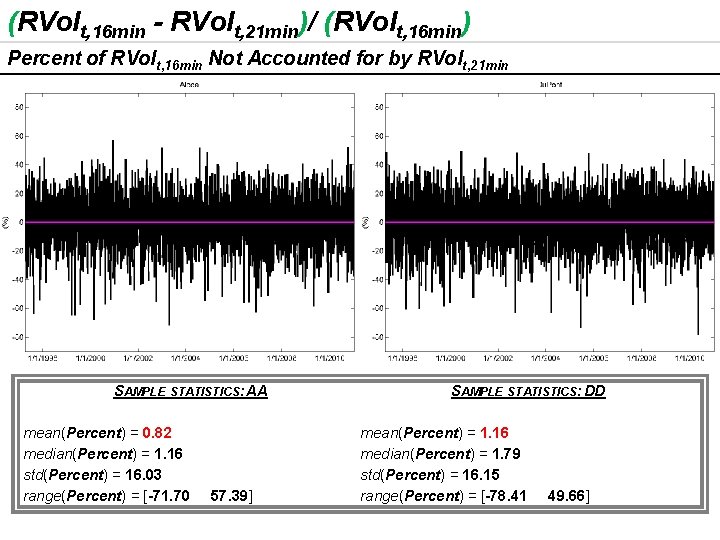
(RVolt, 16 min - RVolt, 21 min)/ (RVolt, 16 min) Percent of RVolt, 16 min Not Accounted for by RVolt, 21 min SAMPLE STATISTICS: AA mean(Percent) = 0. 82 median(Percent) = 1. 16 std(Percent) = 16. 03 range(Percent) = [-71. 70 57. 39] SAMPLE STATISTICS: DD mean(Percent) = 1. 16 median(Percent) = 1. 79 std(Percent) = 16. 15 range(Percent) = [-78. 41 49. 66]
Can the mean of stable Percent values (i. e. x ≥ ~6) serve as an estimator of finite sample considerations?
Contents 1. Separating Market Microstructure Noise from the Price Process 2. Using Overnight Returns to Predict (Next-Day) Price Reversal
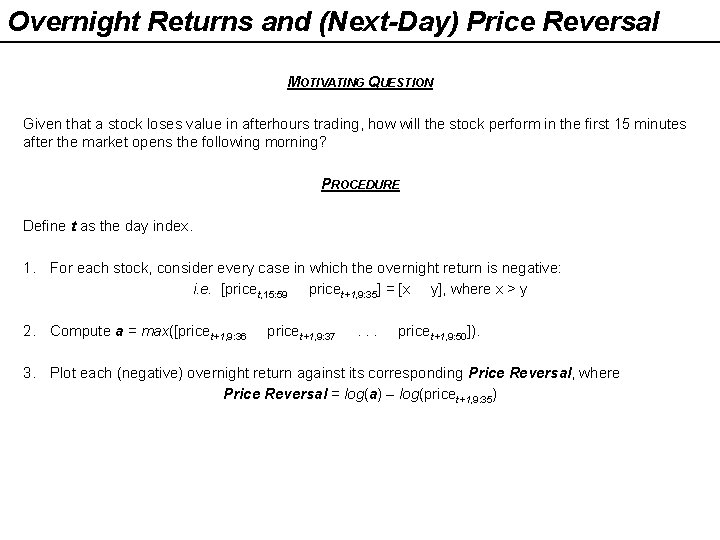
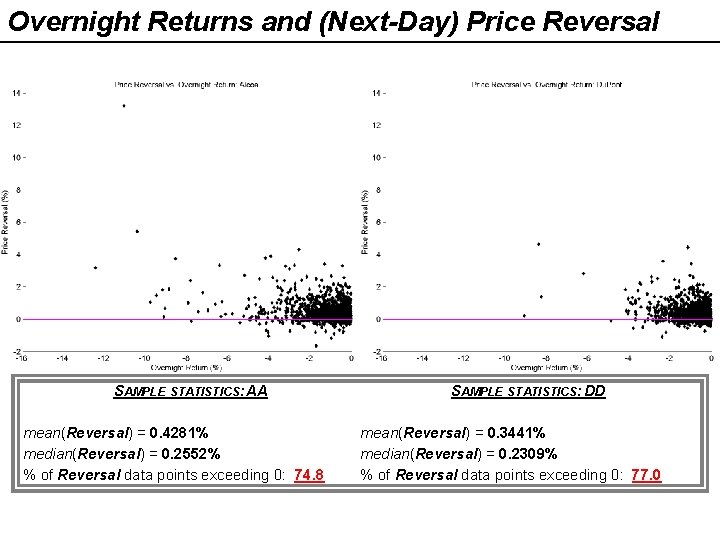
Overnight Returns and (Next-Day) Price Reversal MOTIVATING QUESTION Given that a stock loses value in afterhours trading, how will the stock perform in the first 15 minutes after the market opens the following morning? PROCEDURE Define t as the day index. 1. For each stock, consider every case in which the overnight return is negative: i. e. [pricet, 15: 59 pricet+1, 9: 35] = [x y], where x > y 2. Compute a = max([pricet+1, 9: 36 pricet+1, 9: 37 . . . pricet+1, 9: 50]). 3. Plot each (negative) overnight return against its corresponding Price Reversal, where Price Reversal = log(a) – log(pricet+1, 9: 35)
Overnight Returns and (Next-Day) Price Reversal SAMPLE STATISTICS: AA mean(Reversal) = 0. 4281% median(Reversal) = 0. 2552% % of Reversal data points exceeding 0: 74. 8 SAMPLE STATISTICS: DD mean(Reversal) = 0. 3441% median(Reversal) = 0. 2309% % of Reversal data points exceeding 0: 77. 0