Ministry of Higher Education and Scientific Research University


 is a suitable method to calculate the size of nanocrystallites")

,")
 Uniform deformation model (UDM) Analysis of Williamson-Hall can determine the sizes")
 •")
 •")
 •")


 In the USDM (uniform stress deformation model) were calculated")
 •")
 method According to this method, the lattice strain and size of")
: The results of crystallite size, lattice strain, stress, and energy density for")
 shown the of the parameters of the applied methods, the")


- Slides: 21
Ministry of Higher Education and Scientific Research University of Baghdad College of Education for Pure Sciences ( Ibn- AL- Haytham ) A comparative study of Williamson – Hall method and size- strain method through X-ray diffraction pattern of cadmium oxide nanoparticle By Suhir Abd –ALAziz Jabir Supervisor Prof. Dr. Khalid Helal Harbbi 2020 A. D. 1441 A. H
ABSTRACT In this research, the Williamson-Hall method and of size-strain plot method was employed to analyze X-ray lines for evaluating the crystallite size and lattice strain and of cadmium oxide nanoparticles. the crystallite size value is (15. 2 nm) and (93. 1 nm) and lattice strain (4. 2 × 10 -4 ) and (21× 10 -4) respectively. Also, other methods have been employed to evaluate the crystallite size. The current methods are (Sherrer and modified Sherrer methods ) and their results are (14. 8 nm) and (13. 9 nm) respectively. Each method of analysis has a different result because the alteration in the crystallite size and lattice strain calculated according to the Williamson-Hall and size-strain plot methods shows that the non-uniform strain in nanoparticles.
Introduction X-ray diffraction (XRD) is a suitable method to calculate the size of nanocrystallites in nanocrystalline materials. Methods are used to study the real structure of polycrystals based on the analysis of the displacement, expansion, and shape of individual diffraction reflexes that are widely used to estimate nanoparticle sizes. Methods of full-profile analysis allow us to specify the atomic structure of nanoparticles and simultaneously receive information about their size and form[1]. Infinitely, a perfect crystal can extend in all directions; thus, due to its finite size, no crystal is perfect. This deviation from ideal crystallinity results in the diffraction peaks for the materials being broadened.
The strain of lattice is the function of the constants distribution of lattice resulted from the crystalline imperfection like the dislocation of the lattice. Crystallite size is the function of the sizes of the domain that diffracts coherently. In the formation of polycrystalline aggregates, the size of the crystallite of the particles is usually not the same as the sizes of the particles [2]. Analysis of X-ray profiles is an easy and effective method to evaluate the sizes of crystallite and the lattice strain. However, in 1918, Paul Scherrer, the first researcher, developed the Scherrer equation by measuring the nanocrystallite sizes(D) using XRD wavelength radiation (λ ) (nanometers) from calculating the peaks of FWHM (full width at half maximum), while the (β) in the radian situated at all 2θ within XRD. The K shape factor is generally taken as approx. (0. 890)[3].
Although the equation of Scherrer is limited using uncertainties in crystallite shape factor (K), a modified Scherrer equation was developed for estimating the nanocrystallite sizes more accurately[4]. The standard method developed in 1953, which is the Williamson-Hall method, through the past five decades. W-H plots emphasized the plots caused by strain. The width of the peak derived from the size of crystallite differs from 1 /cosθ while the strain differs from tanθ. This behavioral difference as a function of 2θ helps us to differentiate between the effects of the strain and the size on the peak expansion. Williamson–Hall research simplified integral breadth approaches by deconvoluted sizes and strain-induced expansion when the width of peaks as the function of 2θ [5 -7].
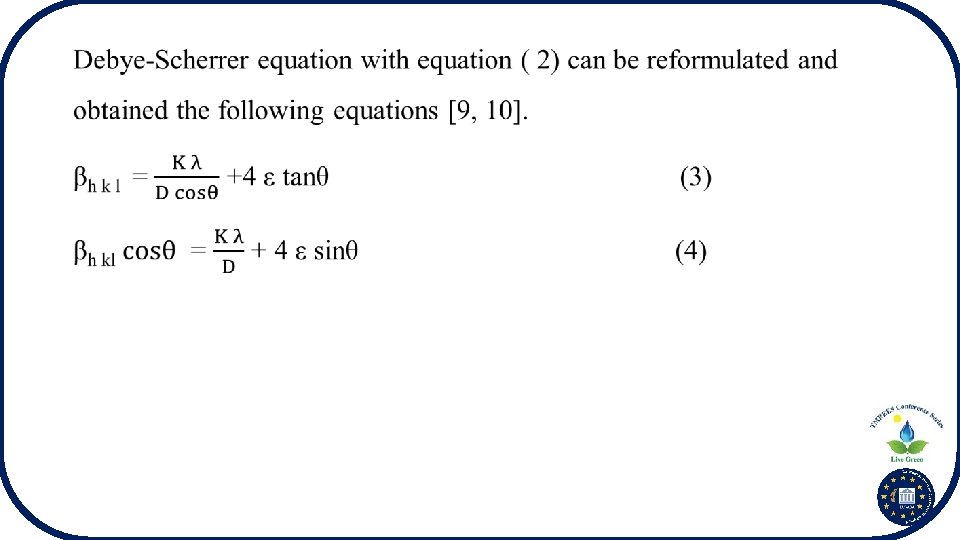
Williamson-Hall method (W-H) Uniform deformation model (UDM) Analysis of Williamson-Hall can determine the sizes of crystallite, lattice strain. To acquire exact the value of crystallite size, initial, instrumental peak broadening was eliminated. The contribution of lattice strain ( βs) and the size of crystallite (βD ) to total peak broadening is further clarified in the specified Eq. (1) βh k l = β s + β D (1) The defects in the crystal and the distortion of the strain caused in the peak that occurs in the expansion are linked in the relationship equation ( 2) ε ≈ βs/tanθ (2)
Uniform stress deformation model (USDM) •
Uniform deformation energy density model (UDEDM) •
Size-Strain Plot Method (SSP) •
Results and Discussion The x-ray diffraction line of the cadmium oxide nanoparticle was analyzed by the methods of size-strain plot and Williamson-Hall. initially, data of the 2θ and intensity of cadmium oxide nanoparticles have been determined using the program of Get Data Graph Digitizer and after obtaining data, these data were used to plot the cadmium oxide nanoparticle pattern by using the program of Origin Pro Lab. Later, every peak is taken in the pattern that is fitting to obtain pure lines of peaks, after fitting peaks, to get rid background data for every peak the intensity is subtracted to calculate FWHM, area under the curve, and then calculate integral breadth for every peak. And the result of the analysis curves of fitting and after fitting are listed in the figures ( 2) also the data which are obtained from these figures are listed in tables (1).
Analysis curves fitting and after fitting of all peak
Analysis curves fitting and after fitting of all peak
Williamson-Hall method the lattice strain and crystallite size have been evaluated depending on the plot in figure (3 ), using Eq. (4 ) which the crystallite size has been determined using the intercept , while the strain was determined using the slope. Figure (3): (UDM) plot of Cd. O nanoparticle
Uniform stress deformation model (USDM) In the USDM (uniform stress deformation model) were calculated from the plot, by using equation (6 ), As shown in figure (4), plots from (4 sin θ ) /Yhkl against β hkl cos θ for Cd. O. The uniform deformation stress was determined using the slope. Figure (4): (USDM) plot of Cd. O nanoparticle.
Uniform deformation energy density model (UDEDM) •
Size-strain plot (SSP) method According to this method, the lattice strain and size of crystallite have been evaluated using the plot as in figure (6 ), by the equation (11 ) which the crystallite size has been determined depending on the slope, while the strain has been determined from the intercept. Figure(6): size-strain plot of Cd. O nanoparticle.
Table (5): The results of crystallite size, lattice strain, stress, and energy density for all applied methods .
The table (3. 20) shown the of the parameters of the applied methods, the FWHM was calculated in the Debye - Scherrer method by dependent on high intensity. This means that FWHM takes only part of the X-ray diffraction line area. This method used two equations, one for calculating strain and the other for calculating crystallite size. In the modified Scherrer method also dependent on the high intensity but the crystallite size was calculated through the graph. This method is accurate because the crystallite size values are obtained from the graph, with each point returning to a diffraction line. In the W-H method, a program was used to calculate the FWHM, these values were used to calculate crystallite size and strain from one graph. In the SSP method, the FWHM was calculated using a program, and the drawing was used to calculate the crystallite size and strain, but the method of calculation from the drawing differs from the W-H method.
Conclusions The change in crystallite size, stress, the density of energy, and lattice strain, evaluated from the analysis of W- H and method of SSP shows that non-uniform strain in particles.
Thank You For Listening