Ministry of Development Key facts and figures on


- Slides: 18

Ministry of Development Key facts and figures on economy and investment in Poland

Economic growth (GDP) Data: CSO, Eurostat, * 2015 -2016 forecasts of SAD MD

3 Exports and trade balance (EUR bln) global EU 2014 surplus was higher than exports in 2000 developing countries CSO data, * forecasts

4 Faster export growth vs. GDP growth (y/y) % In the period of 2000 -2014 (in EUR): q Exports increased 4. 8 times q GDP increased 2. 2 times CSO data

5 Geographical structure of Polish exports (%) EU Germany Czech Republic UK France CIS Russia Ukraine Turkey China Developing countries (excluding CIS) CSO data

6 Trade balance with developing countries (EUR mln) CIS Russia Developing countries (excluding CIS) Ukraine Turkey China South Korea UAE CSO data

7 Rising share of highly processed goods in exports (%) electromechanical products machinery and mechanical equipment and parts electrical machines and equipment vehicles and accessories CSO data

8 Rising share of food products in exports (%) agricultural and food products prepared foodstuffs, non-alcoholic and alcoholic beverages live animals, animal products CSO data

T 9 rade surplus in highly processed goods and agricultural and food products (EUR mln) electromechanical products mechanical and electrical equipment and parts vehicles and accessories prepared foodstuffs, non-alcoholic and alcoholic beverages live animals, animal products agricultural and food products CSO data

10 Rising share of high tech products in exports (%) High technology products include: aviation equipment, computers - office equipment, electronics - telecommunications, pharmaceuticals, scientific and research equipment, electrical machinery, non-electrical machinery, chemicals and armament. CSO data

Polish domestic value added share in gross exports 11 vs. other markets (%) OECD data

Rising Foreign Direct Investment in Poland (EUR bln; average annual EUR/PLN exchange rate) EU EUR 157. 1 bn Netherlan ds EUR 29. 6 bn Germany EUR 28. 0 bn Luxembou rg EUR 20. 4 bn France EUR 19. 9 bn Spain EUR 10. 8 bn Italy EUR 9. 3 bn NBP data

Majority of FDI goes to services and manufacturing (average annual EUR/PLN exchange rate) NBP data

Stronger position of Poland in business climate rankings

Investment oportunities and facilities High tech (i. e. ICT), R&D&I investments most welcome Risk taking and sharing instruments Tax incentives Financial instruments for large investments projects (FIZ, VC, mezzanine finance) q Public institutions financing growth (BGK, PARP, PIR) q Assistance to PPP projects at national and regional levels q Stimulating the effective use of available funds, in particular: q q – European Structural and Investment Funds (ESIF) – Connecting Europe Facility – European Fund for Strategic Investments (Juncker’s fund) – BGK guarantees and investment funds from PIR

EU funds invested in Poland Since 2004, when Poland joined the European Union, it became an important beneficiary of the EU Cohesion Policy Funds. 2004 -2006 14, 2 bln EUR (over 90. 000 projects) 2007 -2014 67, 5 bln EUR (over 100. 000 projects) 2014 -2020 82, 5 bln EUR (first calls for proposals are being announced)

EU Funds (ESIF) invested in Poland (2007 -2013) Majority goes to: - transport (34%) - human capital (19%) - R&D&I and entrepreneurship (17%) - sustainable development (14%)

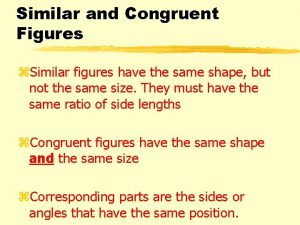
 Congruent symbol
 A polygon with eight sides and eight angles
 Is a trapezoid a plane figure
 Ministry of community development
 Ministry of agriculture and rural development cameroon
 Ecotourim
 Ministry of women and child development logo
 Ministry of agriculture and livestock development
 Ministry of regional development and public works
 Ministry of regional development and public works
 Swodf
Swodf Data are raw facts.
 Facts and figures linda lee
 Facts & figures linda lee
 Fair trade facts
 Facts and figures
 Facts and figures slide
 Ministry of rural development
 Ministry of rural development


