Metropolitan Council Twin Cities Metropolitan Area Water Supply


- Slides: 25
Metropolitan Council Twin Cities Metropolitan Area Water Supply: Regional Groundwater Flow Modeling March 11, 2008 Lanya Ross Senior Environmental Scientist
Outline n Model Purpose n Model Inputs n Model Calibration n Example of Model Use n Next Steps
Goal To ensure safe, secure, reliable, cost-effective and equitable water supplies for current and future generations.
Model Purpose How do we sustainably manage our water supplies? n What is a good estimate of the capacity of a wellfield? n What will drawdown be from a proposed well? n What will future regional groundwater levels be? n How will future pumping affect ecological features? n How might development patterns affect recharge?
Metro Model 2. 0 TAC 2006 – Preliminary Analysis 2007 – Model Development and Quarterly TAC Meetings 2008 – Beta Testing Calibrated Models and Scenario Running For more information: www. metrocouncil. org/environment/Water Supply/metrogroundwatermodel. htm
Model Layers: 1. Quaternary 2. St. Peter 3. Prairie du Chien 4. Jordan 5. St. Lawrence 6. Franconia 7. Ironton-Galesville 8. Eau Claire 9. Mt. Simon
Aquifer Property Zones: Quaternary
Boundaries: 1. No-Flow 2. Constant Head 3. River
Targets: 1. Head: 14, 536 2. Flux: 35
Targets in Layer 9: Mt. Simon
Model Head Calibration
Layer 1 Residual Mean: -0. 30 m
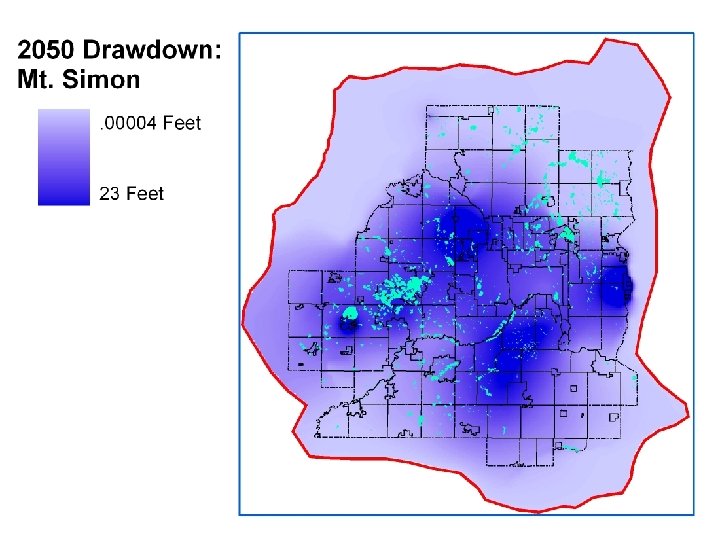
Example of Model Use What are the impacts of projected 2050 municipal demand? n Assume traditional sources used in the future n Assume communities with no municipal supply do not develop a municipal supply n Assume that future wells pump at the average rate reported for metro area wells in that aquifer
Results – Projected Demand
Next Steps n Regional scenarios — Climate Change — Land Use n Local questions — Impacts of Alternative Supplies n Continue to address uncertainty
Additional Figures
Aquifer Property Zones: Prairie du Chien
Layer 3 Residual Mean: -2. 07 m
Head Calibration: Prairie du Chien
Head Calibration: Quaternary
Head Calibration: Mt. Simon