May 2019 RTC RIDE Service Improvement Recommendations March
- Slides: 14
May 2019 RTC RIDE Service Improvement Recommendations March 6, 2019
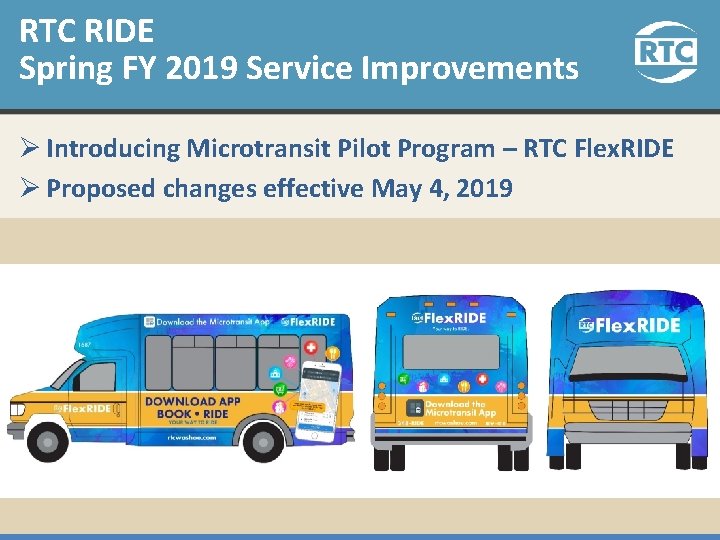
RTC RIDE Spring FY 2019 Service Improvements Ø Introducing Microtransit Pilot Program – RTC Flex. RIDE Ø Proposed changes effective May 4, 2019
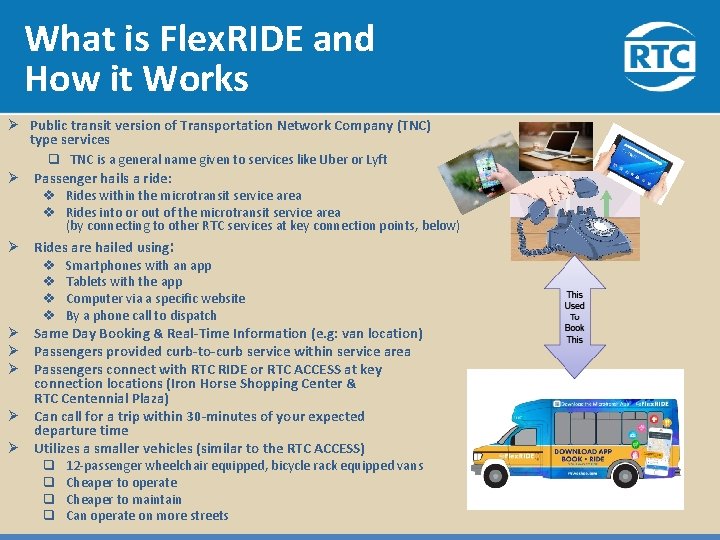
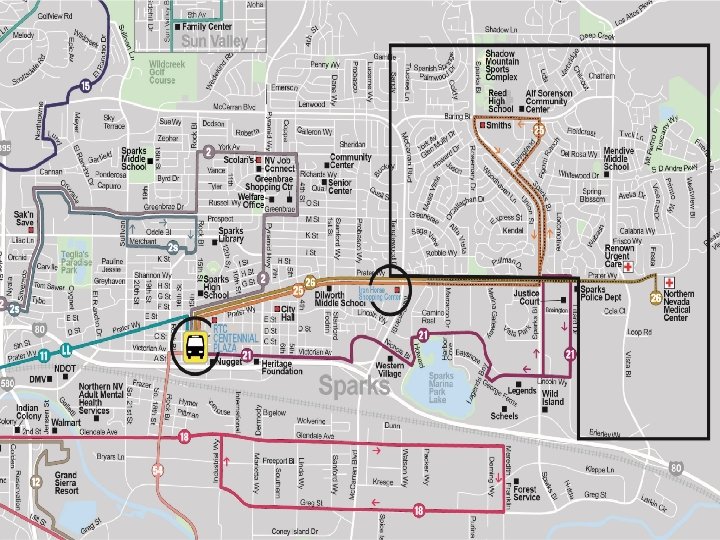
What is Flex. RIDE and How it Works Ø Public transit version of Transportation Network Company (TNC) type services Ø Ø Ø Ø q TNC is a general name given to services like Uber or Lyft Passenger hails a ride: v Rides within the microtransit service area v Rides into or out of the microtransit service area (by connecting to other RTC services at key connection points, below) Rides are hailed using: v Smartphones with an app v Tablets with the app v Computer via a specific website v By a phone call to dispatch Same Day Booking & Real-Time Information (e. g: van location) Passengers provided curb-to-curb service within service area Passengers connect with RTC RIDE or RTC ACCESS at key connection locations (Iron Horse Shopping Center & RTC Centennial Plaza) Can call for a trip within 30 -minutes of your expected departure time Utilizes a smaller vehicles (similar to the RTC ACCESS) q 12 -passenger wheelchair equipped, bicycle rack equipped vans q Cheaper to operate q Cheaper to maintain q Can operate on more streets
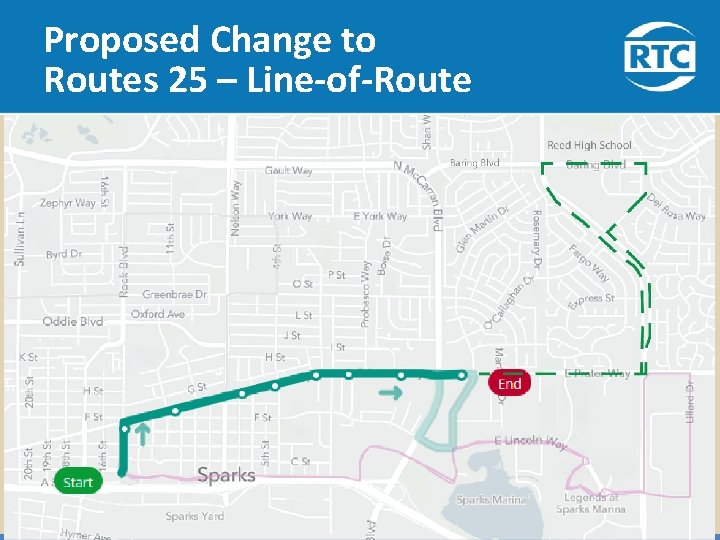
Proposed Change to Routes 25 – Line-of-Route
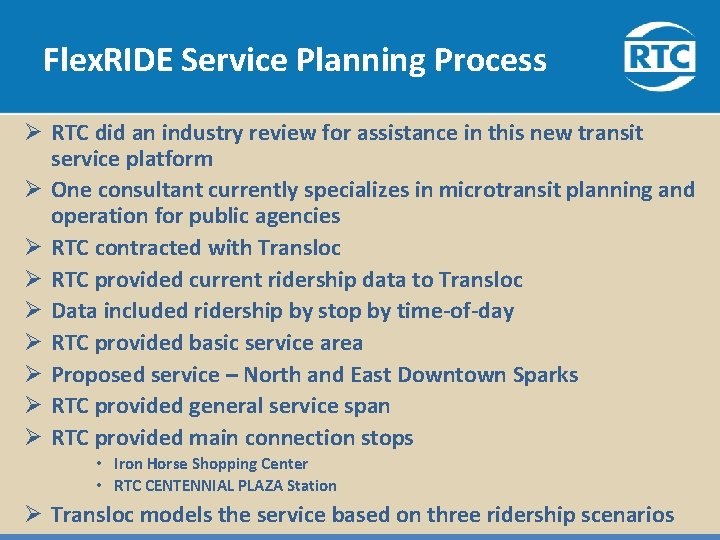
Flex. RIDE Service Planning Process Ø RTC did an industry review for assistance in this new transit service platform Ø One consultant currently specializes in microtransit planning and operation for public agencies Ø RTC contracted with Transloc Ø RTC provided current ridership data to Transloc Ø Data included ridership by stop by time-of-day Ø RTC provided basic service area Ø Proposed service – North and East Downtown Sparks Ø RTC provided general service span Ø RTC provided main connection stops • Iron Horse Shopping Center • RTC CENTENNIAL PLAZA Station Ø Transloc models the service based on three ridership scenarios
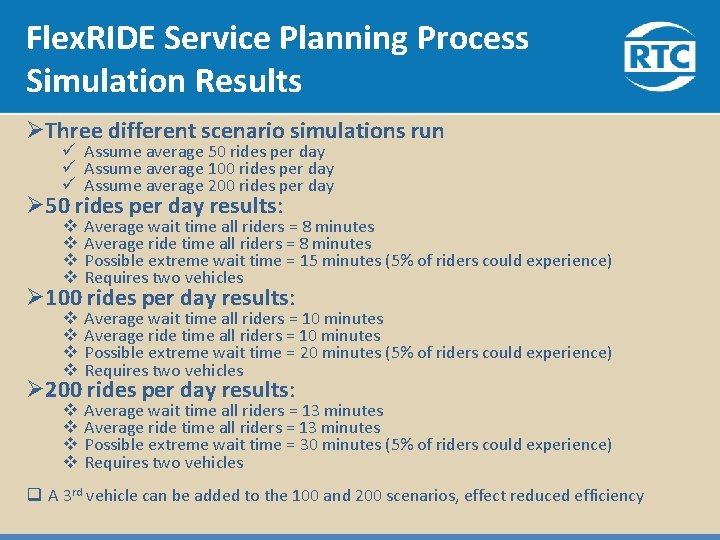
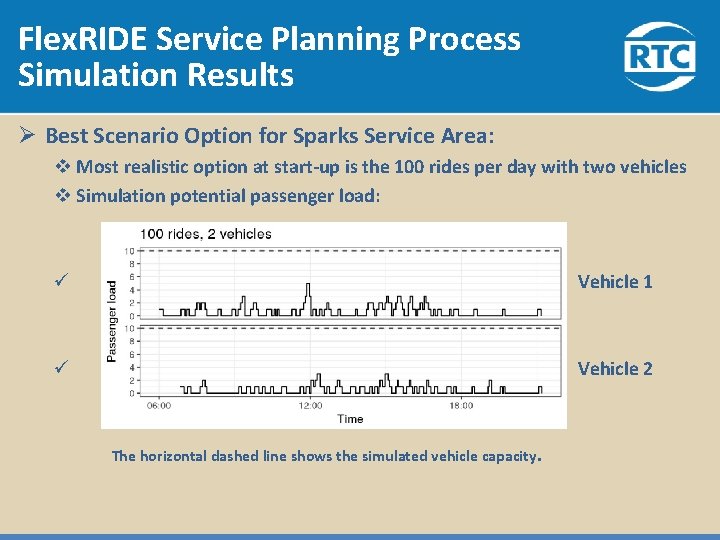
Flex. RIDE Service Planning Process Simulation Results ØThree different scenario simulations run ü Assume average 50 rides per day ü Assume average 100 rides per day ü Assume average 200 rides per day Ø 50 rides per day results: v v Average wait time all riders = 8 minutes Average ride time all riders = 8 minutes Possible extreme wait time = 15 minutes (5% of riders could experience) Requires two vehicles v v Average wait time all riders = 10 minutes Average ride time all riders = 10 minutes Possible extreme wait time = 20 minutes (5% of riders could experience) Requires two vehicles v v Average wait time all riders = 13 minutes Average ride time all riders = 13 minutes Possible extreme wait time = 30 minutes (5% of riders could experience) Requires two vehicles Ø 100 rides per day results: Ø 200 rides per day results: q A 3 rd vehicle can be added to the 100 and 200 scenarios, effect reduced efficiency
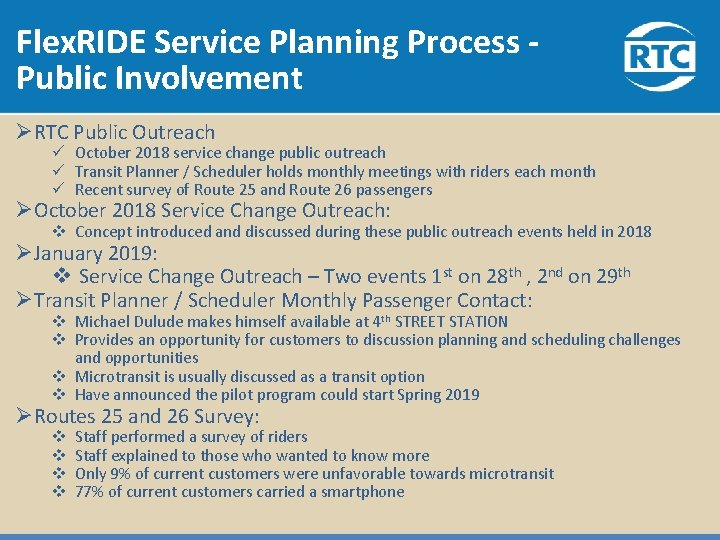
Flex. RIDE Service Planning Process Public Involvement ØRTC Public Outreach ü October 2018 service change public outreach ü Transit Planner / Scheduler holds monthly meetings with riders each month ü Recent survey of Route 25 and Route 26 passengers ØOctober 2018 Service Change Outreach: v Concept introduced and discussed during these public outreach events held in 2018 ØJanuary 2019: v Service Change Outreach – Two events 1 st on 28 th , 2 nd on 29 th ØTransit Planner / Scheduler Monthly Passenger Contact: v Michael Dulude makes himself available at 4 th STREET STATION v Provides an opportunity for customers to discussion planning and scheduling challenges and opportunities v Microtransit is usually discussed as a transit option v Have announced the pilot program could start Spring 2019 ØRoutes 25 and 26 Survey: v v Staff performed a survey of riders Staff explained to those who wanted to know more Only 9% of current customers were unfavorable towards microtransit 77% of current customers carried a smartphone
Questions? Michael Dulude, Public Transportation Transit Planner / Scheduler mdulude@rtcwashoe. com (775) 335 -1904 This is Your RTC.
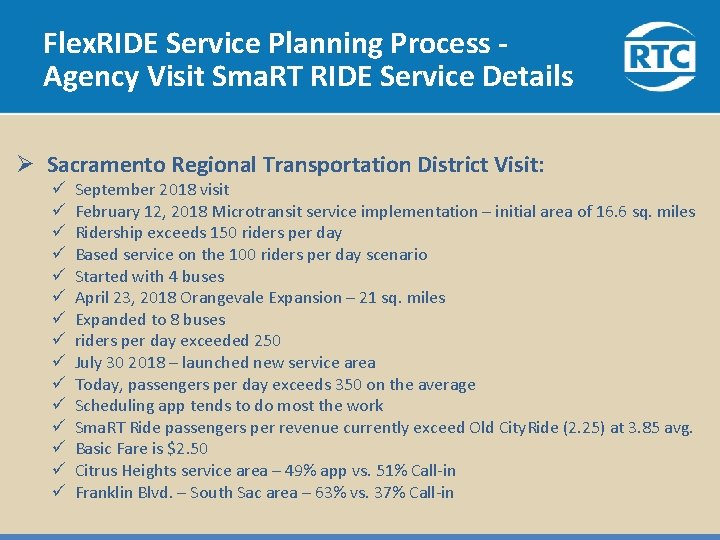
Flex. RIDE Service Planning Process Agency Visit Sma. RT RIDE Service Details Ø Sacramento Regional Transportation District Visit: ü ü ü ü September 2018 visit February 12, 2018 Microtransit service implementation – initial area of 16. 6 sq. miles Ridership exceeds 150 riders per day Based service on the 100 riders per day scenario Started with 4 buses April 23, 2018 Orangevale Expansion – 21 sq. miles Expanded to 8 buses riders per day exceeded 250 July 30 2018 – launched new service area Today, passengers per day exceeds 350 on the average Scheduling app tends to do most the work Sma. RT Ride passengers per revenue currently exceed Old City. Ride (2. 25) at 3. 85 avg. Basic Fare is $2. 50 Citrus Heights service area – 49% app vs. 51% Call-in Franklin Blvd. – South Sac area – 63% vs. 37% Call-in
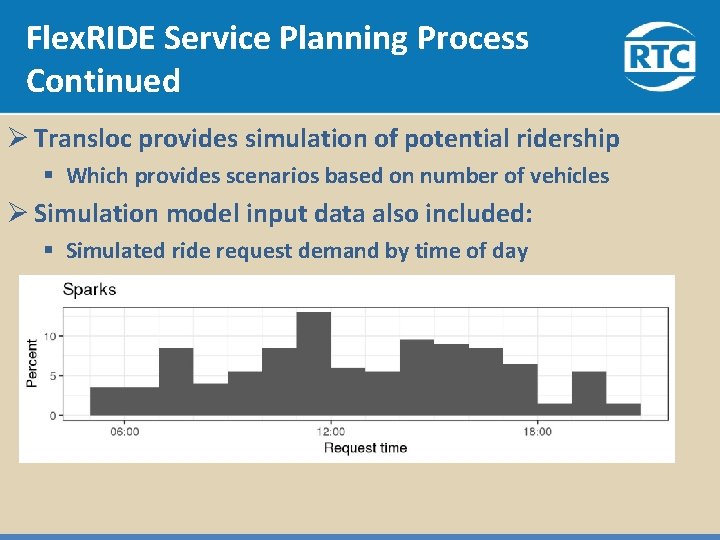
Flex. RIDE Service Planning Process Continued Ø Transloc provides simulation of potential ridership § Which provides scenarios based on number of vehicles Ø Simulation model input data also included: § Simulated ride request demand by time of day
Flex. RIDE Service Planning Process Simulation Results Ø Best Scenario Option for Sparks Service Area: v Most realistic option at start-up is the 100 rides per day with two vehicles v Simulation potential passenger load: ü Vehicle 1 ü Vehicle 2 The horizontal dashed line shows the simulated vehicle capacity.
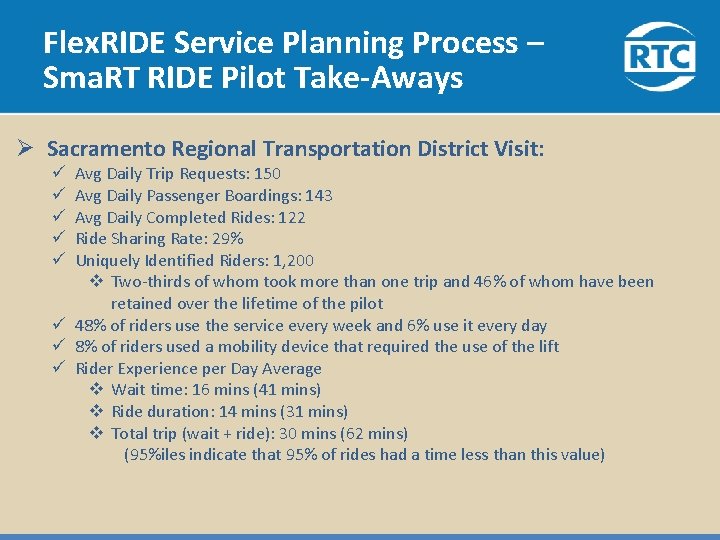
Flex. RIDE Service Planning Process – Sma. RT RIDE Pilot Take-Aways Ø Sacramento Regional Transportation District Visit: Avg Daily Trip Requests: 150 Avg Daily Passenger Boardings: 143 Avg Daily Completed Rides: 122 Ride Sharing Rate: 29% Uniquely Identified Riders: 1, 200 v Two-thirds of whom took more than one trip and 46% of whom have been retained over the lifetime of the pilot ü 48% of riders use the service every week and 6% use it every day ü 8% of riders used a mobility device that required the use of the lift ü Rider Experience per Day Average v Wait time: 16 mins (41 mins) v Ride duration: 14 mins (31 mins) v Total trip (wait + ride): 30 mins (62 mins) (95%iles indicate that 95% of rides had a time less than this value) ü ü ü
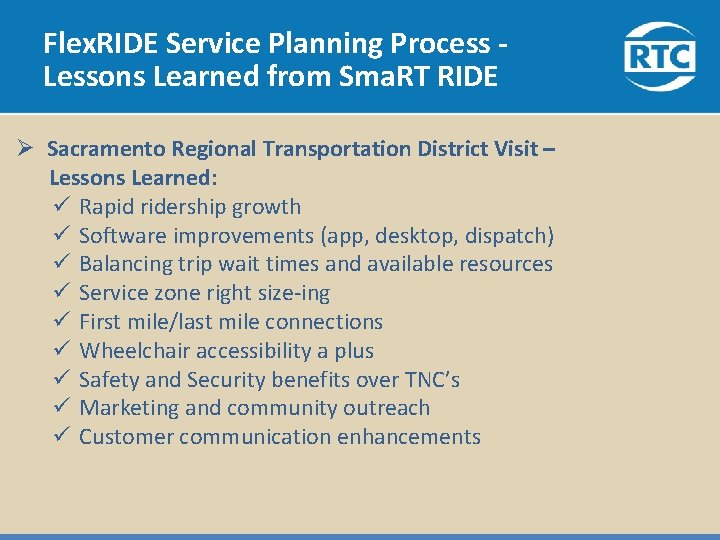
Flex. RIDE Service Planning Process Lessons Learned from Sma. RT RIDE Ø Sacramento Regional Transportation District Visit – Lessons Learned: ü Rapid ridership growth ü Software improvements (app, desktop, dispatch) ü Balancing trip wait times and available resources ü Service zone right size-ing ü First mile/last mile connections ü Wheelchair accessibility a plus ü Safety and Security benefits over TNC’s ü Marketing and community outreach ü Customer communication enhancements