
March Madness Data Crunch Overview Sponsored By Prof

March Madness Data Crunch Overview Sponsored By: Prof. Petersen, Fordham University 1
Timeline • • • 02/06/19 – Historical Data Released 02/13/19 – Registration Deadline for Teams 03/01/19 – Initial Predictions CSV Submission due 03/18/19 – 2019 Current Season Data Released by 5 PM 03/20/19 – 2019 Final Tournament Predictions CSV due by 5 PM 03/27/19 – 2019 Final Power. Point Report & Participation Declaration Form due by 5 PM • 04/05/19 – Final Poster Session & Awards Ceremony Prof. Petersen, Fordham University 2
Where to Create Teams • Create a team of 4 and upload Excel file to blackboard by, 2/13/19, 11: 59 pm • Please email team name and members to: • mdcm@fordham. edu • Teams will then be added to the March Madness Blackboard class • Materials will be uploaded there Prof. Petersen, Fordham University 3
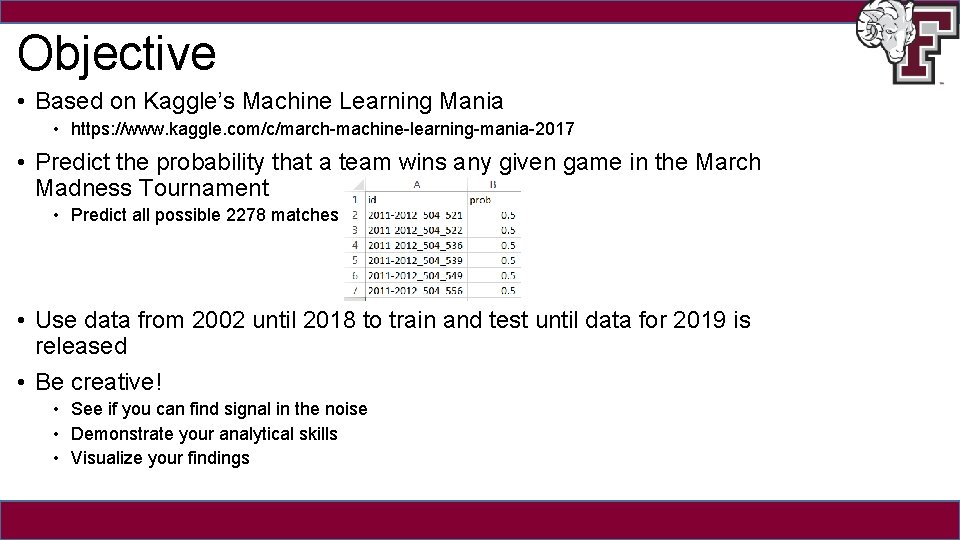
Objective • Based on Kaggle’s Machine Learning Mania • https: //www. kaggle. com/c/march-machine-learning-mania-2017 • Predict the probability that a team wins any given game in the March Madness Tournament • Predict all possible 2278 matches • Use data from 2002 until 2018 to train and test until data for 2019 is released • Be creative! • See if you can find signal in the noise • Demonstrate your analytical skills • Visualize your findings Prof. Petersen, Fordham University 4

Dataset Overview • Glossary available on Blackboard • Game Data: game_id, host name and latitude and longitude and score • Ken. Pom Data: four factor data, tempo, efficiency, etc. • Do not share outside of Fordham • Coaching Data: Coach name, career wins, season wins, NCAA tournament appearances, Sweet 16 appearances, and Final 4 appearances • Team Location Data: Latitude and longitude of team 1 and team 2 • Team Data: Team Name • Poll Data: AP Preaseason/Final Polls, Coaches Preseason/Final Polls • RPI Data Prof. Petersen, Fordham University 5
Grading Criterion • Judges will grade the submissions on the following factors • Model Accuracy • How well did the model perform? • Creativity of Exploratory Analysis & Methodology • Was the team able to find novel ways to improve accuracy and gain new insights into what makes teams succeed in March? • Communication & Visualization • How well was the team able to effectively communicate their findings to the judges • Extremely important to Deloitte!! • Note: Model accuracy is not the most important. Very important to find creative ways to analyze the data and effectively communicate! Prof. Petersen, Fordham University 6
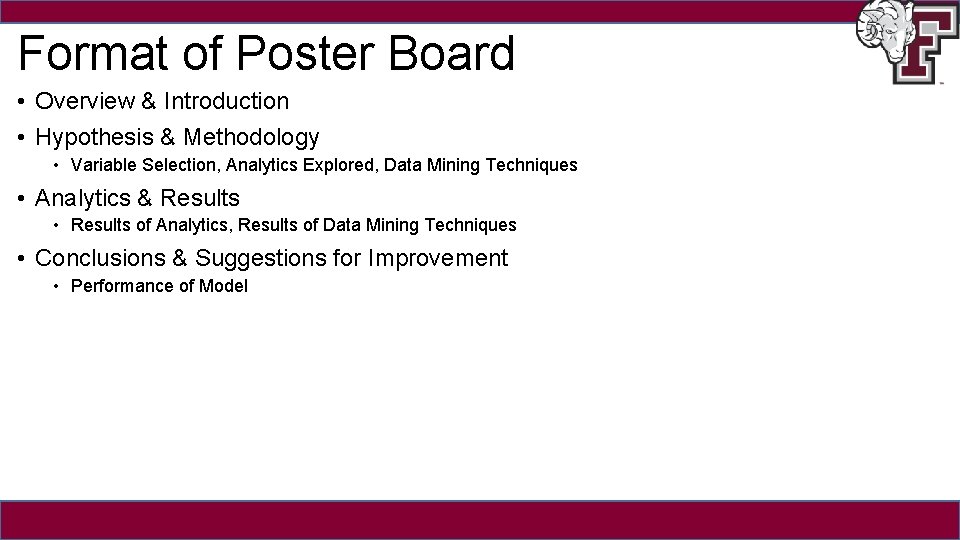
Format of Poster Board • Overview & Introduction • Hypothesis & Methodology • Variable Selection, Analytics Explored, Data Mining Techniques • Analytics & Results • Results of Analytics, Results of Data Mining Techniques • Conclusions & Suggestions for Improvement • Performance of Model Prof. Petersen, Fordham University 7
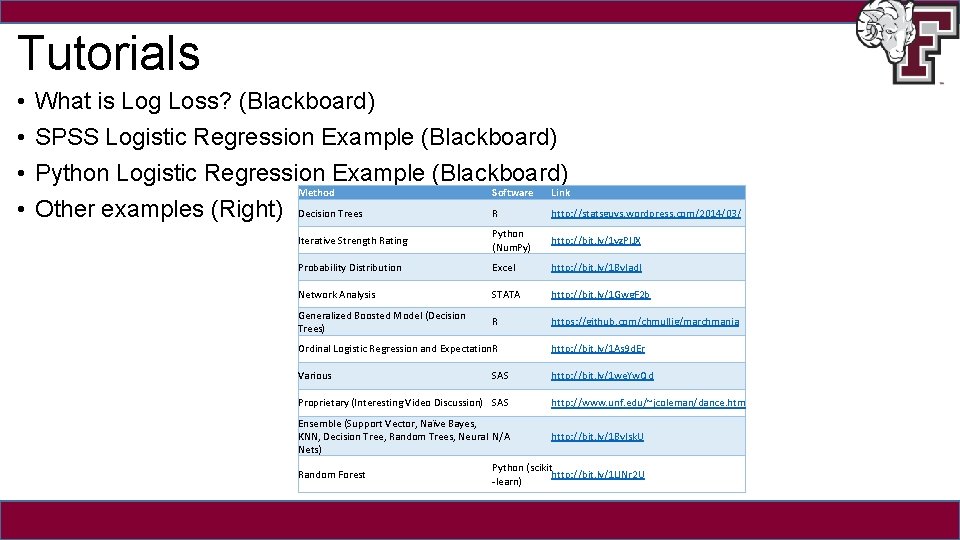
Tutorials • • What is Log Loss? (Blackboard) SPSS Logistic Regression Example (Blackboard) Python Logistic Regression Example (Blackboard) Method Software Link R http: //statsguys. wordpress. com/2014/03/ Other examples (Right) Decision Trees Iterative Strength Rating Python (Num. Py) http: //bit. ly/1 vz. PIJX Probability Distribution Excel http: //bit. ly/1 Bv. Iad. I Network Analysis STATA http: //bit. ly/1 Gwg. F 2 b Generalized Boosted Model (Decision Trees) R https: //github. com/chmullig/marchmania Ordinal Logistic Regression and Expectation. R http: //bit. ly/1 As 9 d. Er Various http: //bit. ly/1 we. Yw. Qd SAS Proprietary (Interesting Video Discussion) SAS http: //www. unf. edu/~jcoleman/dance. htm Ensemble (Support Vector, Naïve Bayes, KNN, Decision Tree, Random Trees, Neural N/A Nets) http: //bit. ly/1 Bv. Isk. U Random Forest Python (scikit http: //bit. ly/1 LINr 2 U -learn) Prof. Petersen, Fordham University 8
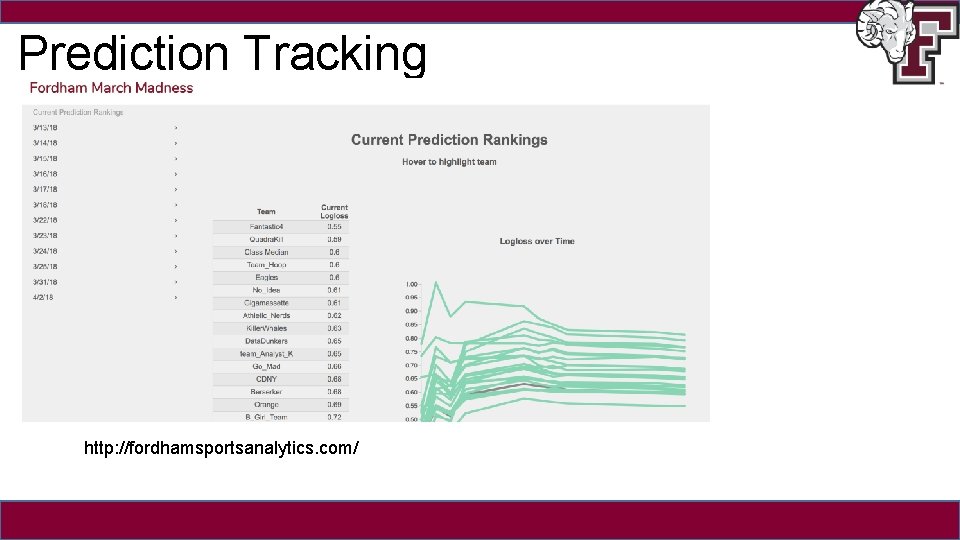
Prediction Tracking http: //fordhamsportsanalytics. com/ Prof. Petersen, Fordham University 9
- Slides: 9