Marshall Islands Climate Todd Mitchell and Nate Mantua

 5 coral pinnacles (4 inhabited); § two roughly")

 Empirical Orthogonal Function")


.")


 episodes. Majuro doesn’t seem")
 precipitation (y-axis) plotted as a function of")
- Slides: 14
Marshall Islands Climate Todd Mitchell and Nate Mantua Joint Institute for the Study of the Atmosphere and Ocean Mike Wallace Atmospheric Sciences
§ 29 coral atolls (19 inhabited) 5 coral pinnacles (4 inhabited); § two roughly parallel chains: “Ratak” (Sunrise) and “Ralik” (Sunset); § 4 -20 N, 160 -173 E § ~180 sq km (70 sq mi. ) Source: (Ency. of the Nations)
NCEP “precipitation reconstruction” --- not the NCEP NCAR reanalysis
The NCEP “precipitation reconstruction” is constructed in the following manner. 1) Empirical Orthogonal Function (EOF) Analysis is used to characterize the spatial patterns of anomalous satellite Outgoing Longwave Radiation Precipitation Index (OPI) variability in 1979 to present. The OPI does a better job of capturing precipitation in regions where the precipitation occurs in deep convective clouds. This is the case in the western equatorial Pacific, but the OPI is not a perfect estimate of precipitation. The leading EOF most likely captures the regional deficits and abundances in precipitation that are associated with the El Niño / Southern Oscillation. 2) The sign and amplitude of each EOF spatial pattern in each year and month of data is determined by calculating the degree to which the distribution of island precipitation anomalies in a given month are similar to each EOF spatial pattern. This allows one to calculate the amplitude and sign of each pattern going back to 1948. 3) The major weaknesses of this method are the errors in the OPI estimates, and that the EOF calculation period of 1979 to present precludes the data from representing fluctuations of periods longer than 25 years. 4) More information at ftp: //ftp. cpc. ncep. noaa. gov/precip/50 yr/
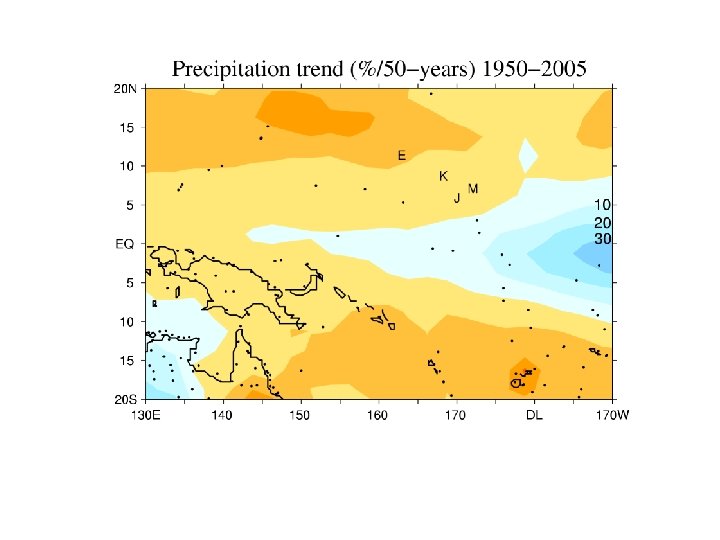
912500 ENIWETOK 11. 4 n 913660 KWAJALEIN 8. 7 n 913760 MAJURO 7. 1 n 913690 JALUIT 5. 9 n 162. 4 e 150 cm 1947 -1972 +43%/50 -years 167. 7 e 260 cm 1946 -2004 -9%/50 -years 171. 4 e 340 cm 1954 -2004 -16%/50 -years 169. 6 e 400 cm 1896 -1968
Tropical storms and hurricanes can contribute to Marshall precipitation, but they are not a regular occurrence.
Same figure with contours of annual total precipitation added (1, 2, 3 meters).
The precipitation trend shown for the global domain.
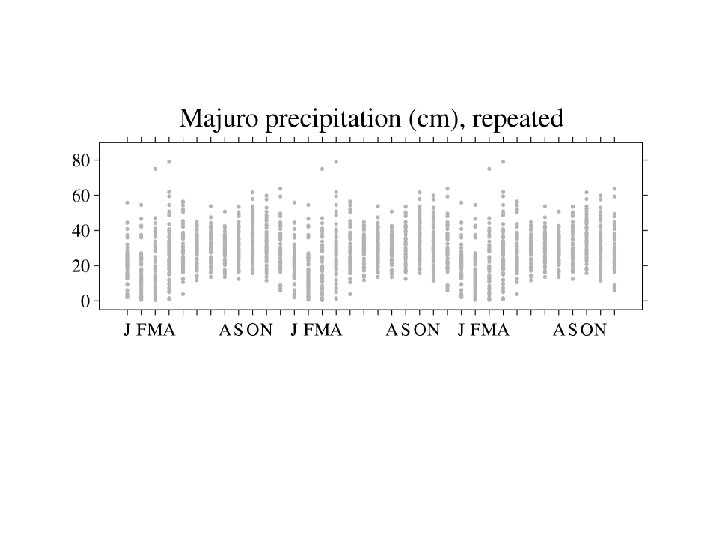
The Majuro precipitation climatology.
The red bar indicates the core months of above normal sea surface temperature in the eastern equatorial Pacific associated with the El Niño / Southern Oscillation (ENSO). Majuro tends to experience extreme drought in the January through April at the end of the ENSO. Each gold line is the Majuro precipitation in the 3 years surrounding the ENSO warm episode.
Same but for cold El Niño / Southern Oscillation (ENSO) episodes. Majuro doesn’t seem to experience a consistent pattern of precipitation abundances or droughts during cold ENSO.
Mean Majuro dry season (January through April) precipitation (y-axis) plotted as a function of ENSO-related sea surface temperature anomalies (x-axis). The digits plotted are the last two digits of the year of the Majuro dry season, for example, “ 83” is 1983. Majuro experienced < 5 cm precipitation per month during 1983 and 1998.