LITTLE CHAMPS PMS AN INVESTMENT STRATEGY FOR INDIAN
- Slides: 18
LITTLE CHAMPS PMS* AN INVESTMENT STRATEGY FOR INDIAN SMALL CAPS FROM MARCELLUS INVESTMENT MANAGERS * Please note that this portfolio is no longer taking any inflows FEBRUARY 1, 2021
CONTENTS 1. Small Cap Investing: Opportunities 2. Key is to ‘identify’ the right stocks and ‘avoid’ the wrong ones 3. Little Champs: A portfolio of niche companies with strong moats and sustainable growth 4. Rigorous screening and due diligence to identify the right stocks and avoid the wrong ones 5. Use forensic accounting to weed out the companies which cook the books 6. Backtest results suggest we are on the right path 7. Live Portfolio performance and comparison with key indices 8. Case studies of two Little Champs – 1 of 2 9. Case studies continued – 2 of 2 10. What is our edge? 11. The Team and Consultants 12. Fund managers – 1 of 2 13. Fund managers continued – 2 of 2 Contacts: sales@marcellus. in 14. Fund structure www. marcellus. in 2
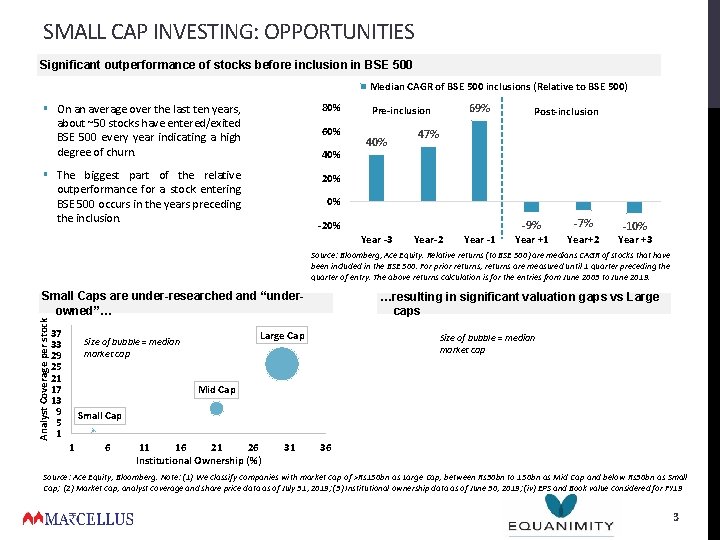
SMALL CAP INVESTING: OPPORTUNITIES Significant outperformance of stocks before inclusion in BSE 500 Median CAGR of BSE 500 inclusions (Relative to BSE 500) § On an average over the last ten years, about ~50 stocks have entered/exited BSE 500 every year indicating a high degree of churn. 80% § The biggest part of the relative outperformance for a stock entering BSE 500 occurs in the years preceding the inclusion. 20% 60% 40% 69% Pre-inclusion 40% Post-inclusion 47% 0% -20% Year -3 Year-2 Year -1 -9% Year +1 -7% Year+2 -10% Year +3 Source: Bloomberg, Ace Equity. Relative returns (to BSE 500) are medians CAGR of stocks that have been included in the BSE 500. For prior returns, returns are measured until 1 quarter preceding the quarter of entry. The above returns calculation is for the entries from June 2003 to June 2019. Analyst Coverage per stock Small Caps are under-researched and “underowned”… 37 33 29 25 21 17 13 9 5 1 …resulting in significant valuation gaps vs Large caps Large Cap Size of bubble = median market cap Mid Cap Small Cap 1 6 11 16 21 26 Institutional Ownership (%) 31 36 Source: Ace Equity, Bloomberg. Note: (1) We classify companies with market cap of >Rs 150 bn as Large Cap, between Rs 30 bn to 150 bn as Mid Cap and below Rs 30 bn as Small Cap; (2) Market cap, analyst coverage and share price data as of July 31, 2019; (3) Institutional ownership data as of June 30, 2019; (iv) EPS and Book value considered for FY 19 3
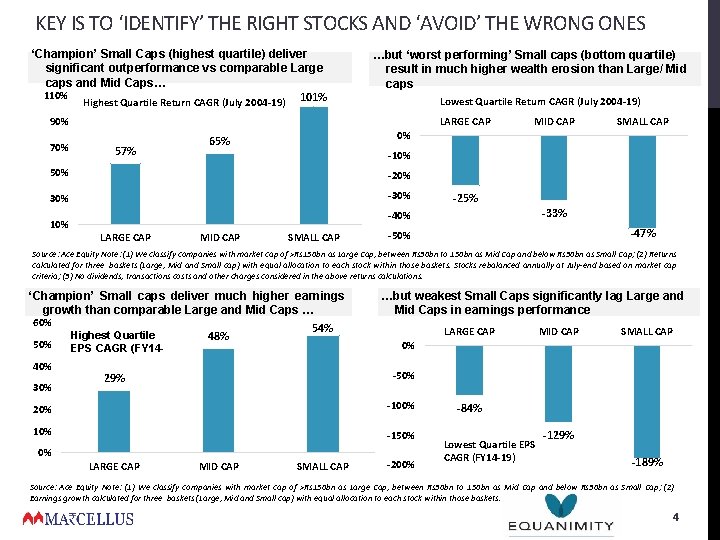
KEY IS TO ‘IDENTIFY’ THE RIGHT STOCKS AND ‘AVOID’ THE WRONG ONES ‘Champion’ Small Caps (highest quartile) deliver significant outperformance vs comparable Large caps and Mid Caps… 110% Highest Quartile Return CAGR (July 2004 -19) 101% …but ‘worst performing’ Small caps (bottom quartile) result in much higher wealth erosion than Large/ Mid caps Lowest Quartile Return CAGR (July 2004 -19) 90% 70% LARGE CAP 57% MID CAP 65% -10% 50% -20% 30% -25% -33% -40% 10% LARGE CAP SMALL CAP 0% MID CAP SMALL CAP -47% -50% Source: Ace Equity Note: (1) We classify companies with market cap of >Rs 150 bn as Large Cap, between Rs 30 bn to 150 bn as Mid Cap and below Rs 30 bn as Small Cap; (2) Returns calculated for three baskets (Large, Mid and Small cap) with equal allocation to each stock within those baskets. Stocks rebalanced annually at July-end based on market cap criteria; (3) No dividends, transactions costs and other charges considered in the above returns calculations. ‘Champion’ Small caps deliver much higher earnings growth than comparable Large and Mid Caps … 60% 50% 40% 30% Highest Quartile EPS CAGR (FY 14 - 48% …but weakest Small Caps significantly lag Large and Mid Caps in earnings performance 54% LARGE CAP SMALL CAP 0% -50% 29% 20% -100% 10% -150% 0% LARGE CAP MID CAP SMALL CAP -200% -84% Lowest Quartile EPS CAGR (FY 14 -19) -129% -189% Source: Ace Equity Note: (1) We classify companies with market cap of >Rs 150 bn as Large Cap, between Rs 30 bn to 150 bn as Mid Cap and below Rs 30 bn as Small Cap; (2) Earnings growth calculated for three baskets (Large, Mid and Small cap) with equal allocation to each stock within those baskets. 4
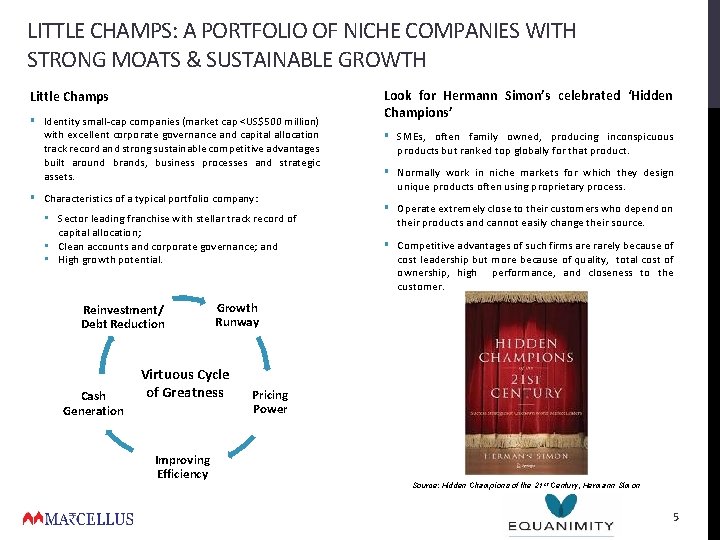
LITTLE CHAMPS: A PORTFOLIO OF NICHE COMPANIES WITH STRONG MOATS & SUSTAINABLE GROWTH Little Champs § Identity small-cap companies (market cap <US$500 million) with excellent corporate governance and capital allocation track record and strong sustainable competitive advantages built around brands, business processes and strategic assets. § Characteristics of a typical portfolio company: • Sector leading franchise with stellar track record of capital allocation; • Clean accounts and corporate governance; and • High growth potential. Reinvestment/ Debt Reduction Cash Generation § SMEs, often family owned, producing inconspicuous products but ranked top globally for that product. § Normally work in niche markets for which they design unique products often using proprietary process. § Operate extremely close to their customers who depend on their products and cannot easily change their source. § Competitive advantages of such firms are rarely because of cost leadership but more because of quality, total cost of ownership, high performance, and closeness to the customer. Growth Runway Virtuous Cycle of Greatness Improving Efficiency Look for Hermann Simon’s celebrated ‘Hidden Champions’ Pricing Power Source: Hidden Champions of the 21 st Century, Hermann Simon 5
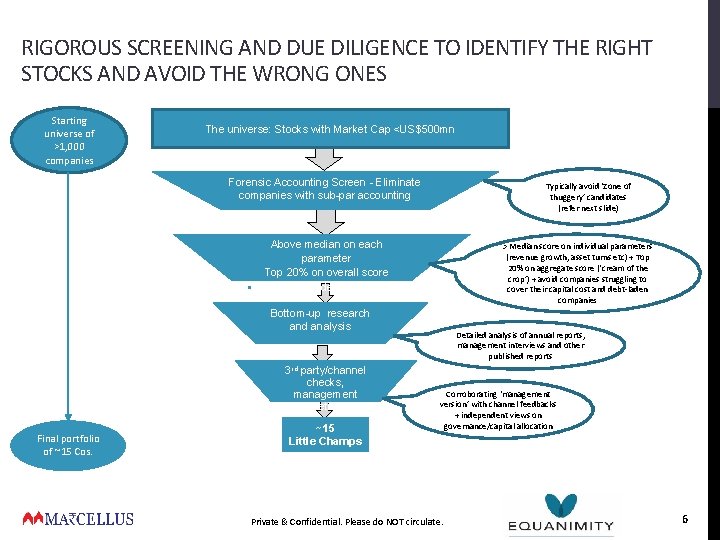
RIGOROUS SCREENING AND DUE DILIGENCE TO IDENTIFY THE RIGHT STOCKS AND AVOID THE WRONG ONES Starting universe of >1, 000 companies The universe: Stocks with Market Cap <US$500 mn Forensic Accounting Screen - Eliminate companies with sub-par accounting Typically avoid ‘Zone of thuggery’ candidates (refer next slide) § Above median on each parameter § Top 20% on overall score § Ro. CE & net debt thresholds > Median score on individual parameters (revenue growth, asset turns etc) + Top 20% on aggregate score (‘cream of the crop’) + avoid companies struggling to cover their capital cost and debt-laden companies Bottom-up research and analysis 3 rd party/channel checks, management meetings Final portfolio of ~15 Cos. ~15 Little Champs Detailed analysis of annual reports, management interviews and other published reports Corroborating ‘management version’ with channel feedbacks + independent views on governance/capital allocation Private & Confidential. Please do NOT circulate. 6
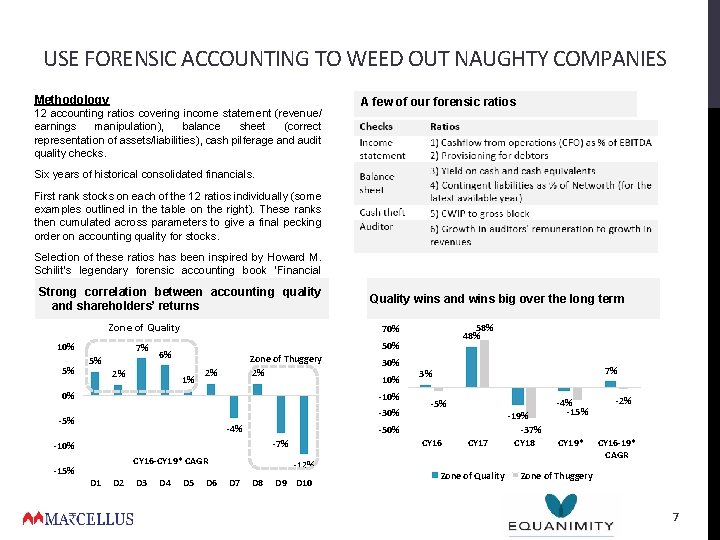
USE FORENSIC ACCOUNTING TO WEED OUT NAUGHTY COMPANIES Methodology 12 accounting ratios covering income statement (revenue/ earnings manipulation), balance sheet (correct representation of assets/liabilities), cash pilferage and audit quality checks. A few of our forensic ratios Six years of historical consolidated financials. First rank stocks on each of the 12 ratios individually (some examples outlined in the table on the right). These ranks then cumulated across parameters to give a final pecking order on accounting quality for stocks. Selection of these ratios has been inspired by Howard M. Schilit’s legendary forensic accounting book ‘Financial Shenanigans’. Strong correlation between accounting quality and shareholders’ returns Zone of Quality 10% 5% 7% 5% 50% 1% Zone of Thuggery 2% 2% 0% 30% 10% -30% -5% -4% -10% CY 16 -CY 19* CAGR D 1 D 2 D 3 D 4 D 5 D 6 -5% CY 16 -12% D 7 7% 3% -50% -7% -15% 58% 48% 70% 6% 2% Quality wins and wins big over the long term D 8 D 9 D 10 CY 17 Zone of Quality -19% -37% CY 18 -4% -15% CY 19* -2% CY 16 -19* CAGR Zone of Thuggery 7
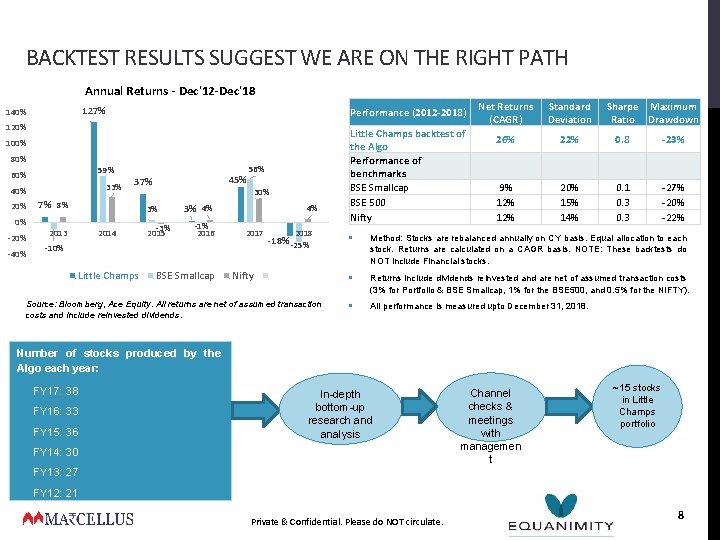
BACKTEST RESULTS SUGGEST WE ARE ON THE RIGHT PATH Annual Returns - Dec'12 -Dec'18 127% 140% Performance (2012 -2018) 120% 100% 80% 59% 60% 33% 40% 20% 0% -20% -40% 45% 37% 7% 8% 30% 3% 2013 2014 56% -3% 2015 3% 4% -1% 2016 4% 2017 -10% Little Champs BSE Smallcap 2018 -18% -25% Nifty Source: Bloomberg, Ace Equity. All returns are net of assumed transaction costs and include reinvested dividends. Little Champs backtest of the Algo Performance of benchmarks BSE Smallcap BSE 500 Nifty Net Returns (CAGR) Standard Deviation Sharpe Maximum Ratio Drawdown 26% 22% 0. 8 -23% 9% 12% 20% 15% 14% 0. 1 0. 3 -27% -20% -22% § Method: Stocks are rebalanced annually on CY basis. Equal allocation to each stock. Returns are calculated on a CAGR basis. NOTE: These backtests do NOT include Financial stocks. § Returns include dividends reinvested and are net of assumed transaction costs (3% for Portfolio & BSE Smallcap, 1% for the BSE 500, and 0. 5% for the NIFTY). § All performance is measured upto December 31, 2018. Number of stocks produced by the Algo each year: • FY 17: 38 • FY 16: 33 • FY 15: 36 • FY 14: 30 • FY 13: 27 • FY 12: 21 In-depth bottom-up research and analysis Private & Confidential. Please do NOT circulate. Channel checks & meetings with managemen t ~15 stocks in Little Champs portfolio 8
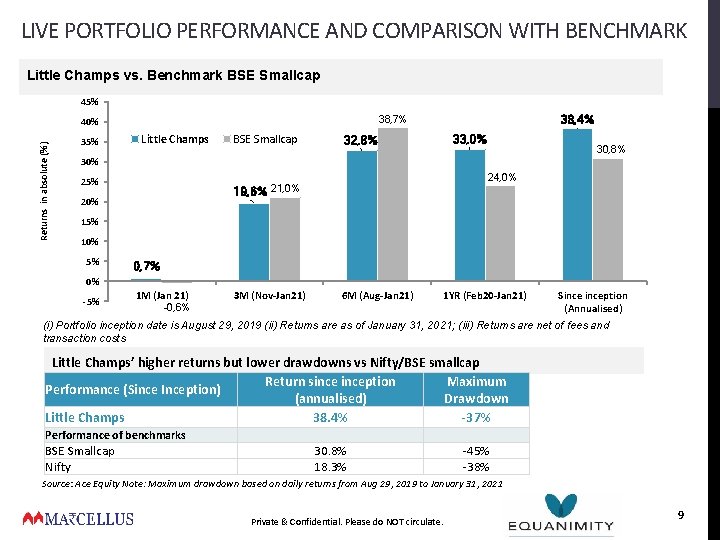
LIVE PORTFOLIO PERFORMANCE AND COMPARISON WITH BENCHMARK Little Champs vs. Benchmark BSE Smallcap 45% Returns in absolute (%) 35% 38, 4% 38, 7% 40% Little Champs BSE Smallcap 33, 0% 32, 8% 30% 25% 24, 0% 19, 6% 21, 0% 20% 15% 10% 5% 0, 7% 0% -5% 1 M (Jan 21) -0, 6% 3 M (Nov-Jan 21) 6 M (Aug-Jan 21) 1 YR (Feb 20 -Jan 21) Sinception (Annualised) (i) Portfolio inception date is August 29, 2019 (ii) Returns are as of January 31, 2021; (iii) Returns are net of fees and transaction costs Little Champs’ higher returns but lower drawdowns vs Nifty/BSE smallcap Return sinception Maximum Performance (Since Inception) (annualised) Drawdown 38. 4% -37% Little Champs Performance of benchmarks BSE Smallcap Nifty 30. 8% 18. 3% -45% -38% Source: Ace Equity Note: Maximum drawdown based on daily returns from Aug 29, 2019 to January 31, 2021 Private & Confidential. Please do NOT circulate. 9
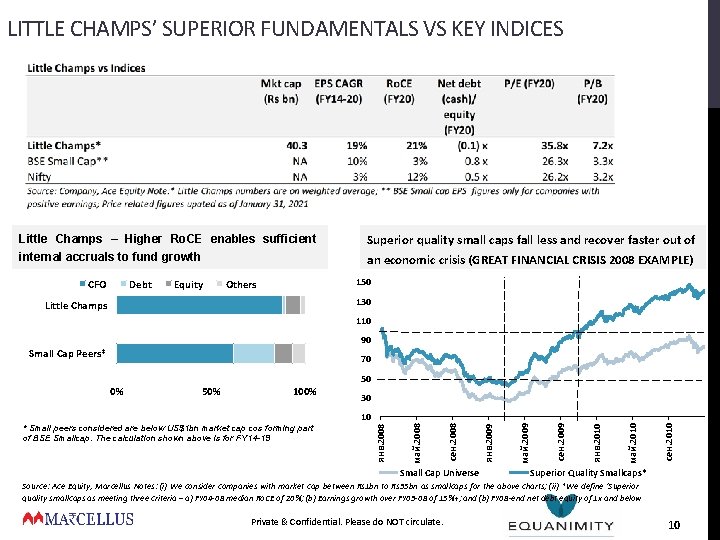
LITTLE CHAMPS’ SUPERIOR FUNDAMENTALS VS KEY INDICES Little Champs – Higher Ro. CE enables sufficient internal accruals to fund growth CFO Debt Equity Superior quality small caps fall less and recover faster out of an economic crisis (GREAT FINANCIAL CRISIS 2008 EXAMPLE) 150 Others 130 Little Champs 110 90 Small Cap Peers* 70 50 0% 50% 100% 30 Small Cap Universe сен. 2010 май. 2010 янв. 2010 сен. 2009 май. 2009 янв. 2009 сен. 2008 май. 2008 янв. 2008 10 * Small peers considered are below US$1 bn market cap cos forming part of BSE Smallcap. The calculation shown above is for FY 14 -19 Superior Quality Smallcaps* Source: Ace Equity, Marcellus Notes: (i) We consider companies with market cap between Rs 1 bn to Rs 35 bn as smallcaps for the above charts; (ii) *We define ‘Superior quality smallcaps as meeting three criteria – a) FY 04 -08 median Ro. CE of 20%; (b) Earnings growth over FY 03 -08 of 15%+; and (b) FY 08 -end net debt equity of 1 x and below Private & Confidential. Please do NOT circulate. 10
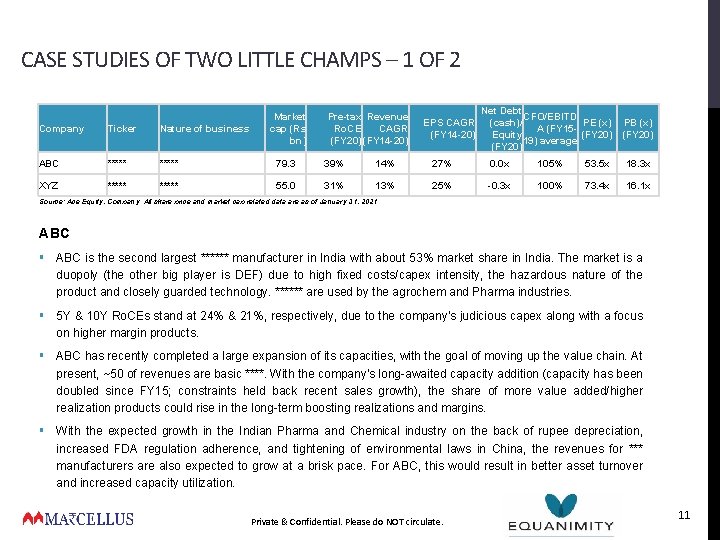
CASE STUDIES OF TWO LITTLE CHAMPS – 1 OF 2 Market cap (Rs bn) Pre-tax Revenue Ro. CE CAGR (FY 20) (FY 14 -20) EPS CAGR (FY 14 -20) Net Debt CFO/EBITD (cash)/ PE (x) A (FY 15 Equity (FY 20) 19) average (FY 20) PB (x) (FY 20) Company Ticker Nature of business ABC ***** 79. 3 39% 14% 27% 0. 0 x 105% 53. 5 x 18. 3 x XYZ ***** 55. 0 31% 13% 25% -0. 3 x 100% 73. 4 x 16. 1 x Source: Ace Equity, Company. All share price and market cap related data are as of January 31, 2021 ABC § ABC is the second largest ****** manufacturer in India with about 53% market share in India. The market is a duopoly (the other big player is DEF) due to high fixed costs/capex intensity, the hazardous nature of the product and closely guarded technology. ****** are used by the agrochem and Pharma industries. § 5 Y & 10 Y Ro. CEs stand at 24% & 21%, respectively, due to the company’s judicious capex along with a focus on higher margin products. § ABC has recently completed a large expansion of its capacities, with the goal of moving up the value chain. At present, ~50 of revenues are basic ****. With the company’s long-awaited capacity addition (capacity has been doubled since FY 15; constraints held back recent sales growth), the share of more value added/higher realization products could rise in the long-term boosting realizations and margins. § With the expected growth in the Indian Pharma and Chemical industry on the back of rupee depreciation, increased FDA regulation adherence, and tightening of environmental laws in China, the revenues for *** manufacturers are also expected to grow at a brisk pace. For ABC, this would result in better asset turnover and increased capacity utilization. Private & Confidential. Please do NOT circulate. 11
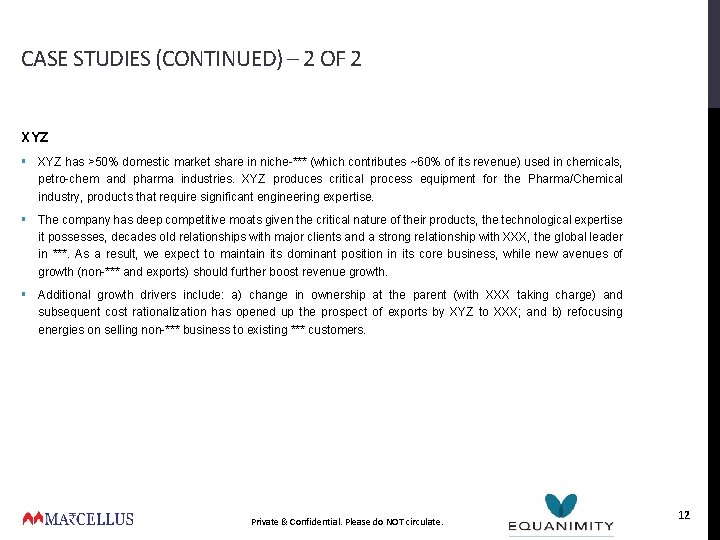
CASE STUDIES (CONTINUED) – 2 OF 2 XYZ § XYZ has >50% domestic market share in niche-*** (which contributes ~60% of its revenue) used in chemicals, petro-chem and pharma industries. XYZ produces critical process equipment for the Pharma/Chemical industry, products that require significant engineering expertise. § The company has deep competitive moats given the critical nature of their products, the technological expertise it possesses, decades old relationships with major clients and a strong relationship with XXX, the global leader in ***. As a result, we expect to maintain its dominant position in its core business, while new avenues of growth (non-*** and exports) should further boost revenue growth. § Additional growth drivers include: a) change in ownership at the parent (with XXX taking charge) and subsequent cost rationalization has opened up the prospect of exports by XYZ to XXX; and b) refocusing energies on selling non-*** business to existing *** customers. Private & Confidential. Please do NOT circulate. 12
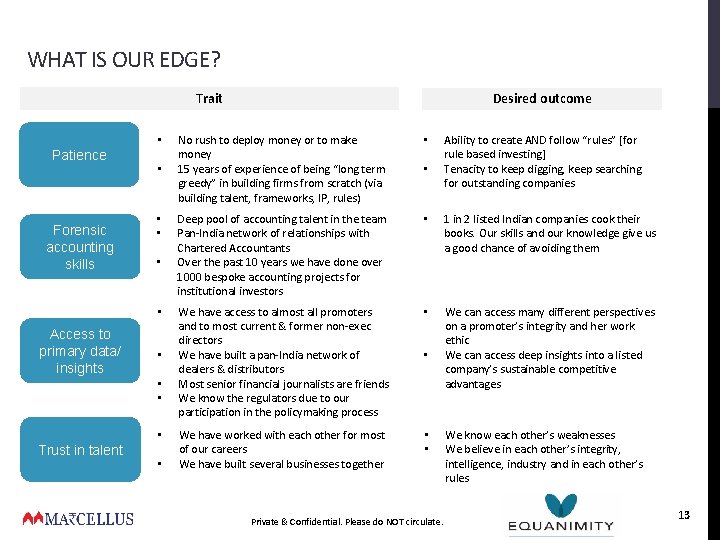
WHAT IS OUR EDGE? Trait • Patience Forensic accounting skills • • • Access to primary data/ insights • • Trust in talent • Desired outcome No rush to deploy money or to make money 15 years of experience of being “long term greedy” in building firms from scratch (via building talent, frameworks, IP, rules) • Deep pool of accounting talent in the team Pan-India network of relationships with Chartered Accountants Over the past 10 years we have done over 1000 bespoke accounting projects for institutional investors • 1 in 2 listed Indian companies cook their books. Our skills and our knowledge give us a good chance of avoiding them We have access to almost all promoters and to most current & former non-exec directors We have built a pan-India network of dealers & distributors Most senior financial journalists are friends We know the regulators due to our participation in the policymaking process • We can access many different perspectives on a promoter’s integrity and her work ethic We can access deep insights into a listed company’s sustainable competitive advantages We have worked with each other for most of our careers We have built several businesses together • • Private & Confidential. Please do NOT circulate. Ability to create AND follow “rules” [for rule based investing] Tenacity to keep digging, keep searching for outstanding companies We know each other’s weaknesses We believe in each other’s integrity, intelligence, industry and in each other’s rules 13
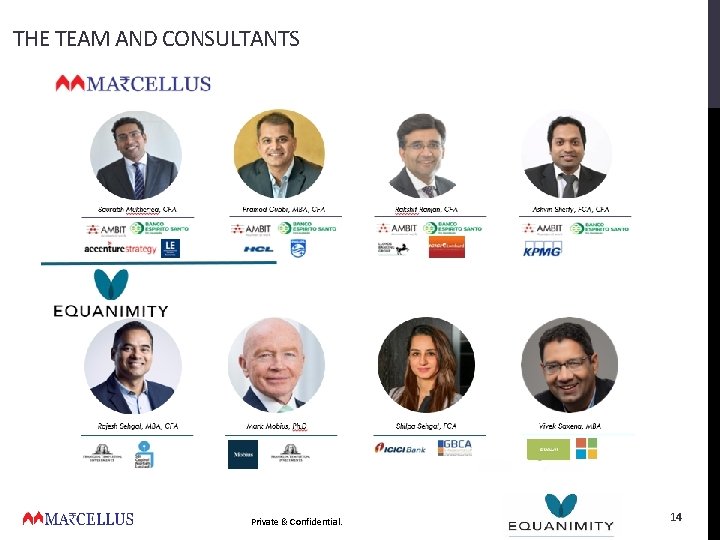
THE TEAM AND CONSULTANTS Private & Confidential. 14
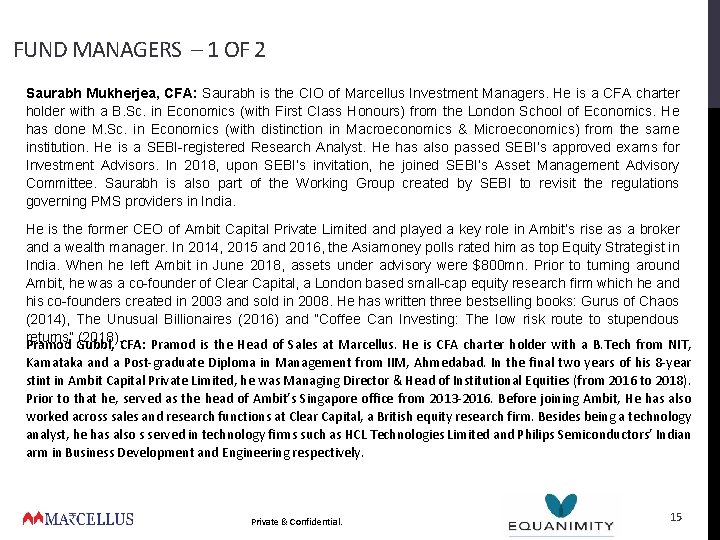
FUND MANAGERS – 1 OF 2 Saurabh Mukherjea, CFA: Saurabh is the CIO of Marcellus Investment Managers. He is a CFA charter holder with a B. Sc. in Economics (with First Class Honours) from the London School of Economics. He has done M. Sc. in Economics (with distinction in Macroeconomics & Microeconomics) from the same institution. He is a SEBI-registered Research Analyst. He has also passed SEBI’s approved exams for Investment Advisors. In 2018, upon SEBI’s invitation, he joined SEBI’s Asset Management Advisory Committee. Saurabh is also part of the Working Group created by SEBI to revisit the regulations governing PMS providers in India. He is the former CEO of Ambit Capital Private Limited and played a key role in Ambit’s rise as a broker and a wealth manager. In 2014, 2015 and 2016, the Asiamoney polls rated him as top Equity Strategist in India. When he left Ambit in June 2018, assets under advisory were $800 mn. Prior to turning around Ambit, he was a co-founder of Clear Capital, a London based small-cap equity research firm which he and his co-founders created in 2003 and sold in 2008. He has written three bestselling books: Gurus of Chaos (2014), The Unusual Billionaires (2016) and “Coffee Can Investing: The low risk route to stupendous returns” (2018). Pramod Gubbi, CFA: Pramod is the Head of Sales at Marcellus. He is CFA charter holder with a B. Tech from NIT, Karnataka and a Post-graduate Diploma in Management from IIM, Ahmedabad. In the final two years of his 8 -year stint in Ambit Capital Private Limited, he was Managing Director & Head of Institutional Equities (from 2016 to 2018). Prior to that he, served as the head of Ambit’s Singapore office from 2013 -2016. Before joining Ambit, He has also worked across sales and research functions at Clear Capital, a British equity research firm. Besides being a technology analyst, he has also s served in technology firms such as HCL Technologies Limited and Philips Semiconductors’ Indian arm in Business Development and Engineering respectively. Private & Confidential. 15
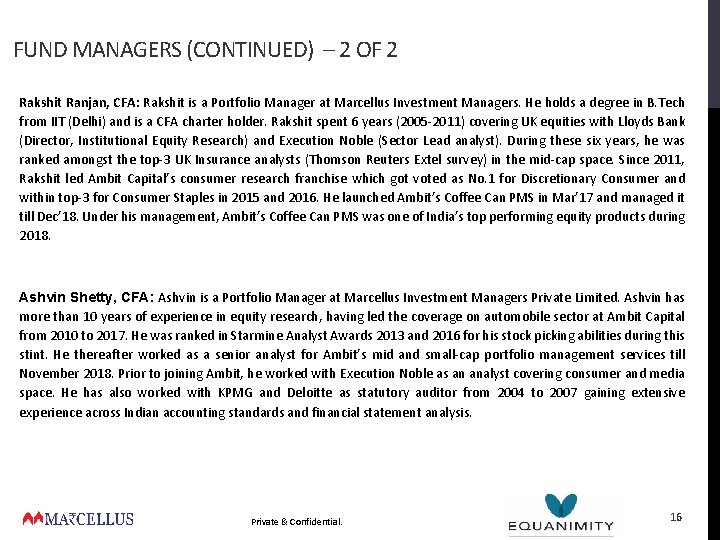
FUND MANAGERS (CONTINUED) – 2 OF 2 Rakshit Ranjan, CFA: Rakshit is a Portfolio Manager at Marcellus Investment Managers. He holds a degree in B. Tech from IIT (Delhi) and is a CFA charter holder. Rakshit spent 6 years (2005 -2011) covering UK equities with Lloyds Bank (Director, Institutional Equity Research) and Execution Noble (Sector Lead analyst). During these six years, he was ranked amongst the top-3 UK Insurance analysts (Thomson Reuters Extel survey) in the mid-cap space. Since 2011, Rakshit led Ambit Capital’s consumer research franchise which got voted as No. 1 for Discretionary Consumer and within top-3 for Consumer Staples in 2015 and 2016. He launched Ambit’s Coffee Can PMS in Mar’ 17 and managed it till Dec’ 18. Under his management, Ambit’s Coffee Can PMS was one of India’s top performing equity products during 2018. Ashvin Shetty, CFA: Ashvin is a Portfolio Manager at Marcellus Investment Managers Private Limited. Ashvin has more than 10 years of experience in equity research, having led the coverage on automobile sector at Ambit Capital from 2010 to 2017. He was ranked in Starmine Analyst Awards 2013 and 2016 for his stock picking abilities during this stint. He thereafter worked as a senior analyst for Ambit’s mid and small-cap portfolio management services till November 2018. Prior to joining Ambit, he worked with Execution Noble as an analyst covering consumer and media space. He has also worked with KPMG and Deloitte as statutory auditor from 2004 to 2007 gaining extensive experience across Indian accounting standards and financial statement analysis. Private & Confidential. 16
PMS STRUCTURE (PLEASE NOTE THAT THIS PORTFOLIO IS NO LONGER TAKING ANY INFLOWS) Marcellus offers the Little Champs Strategy in a PMS construct Fees • Fixed fees: 1. 5% per annum (charged quarterly) • Performance fees: 20% profit share above a 10% hurdle. Performance fees will be charged on cumulative gains at the third anniversary*. Performance fees will be charged without catch-up i. e. the first 10% return per annum (net of fixed fees) will be not be subject to performance fees. High water mark applies for performance fees. *If redeemed prior to the completion of three years, performance fees will be charged as on redemption date Exit Load: 3%, 2% and 1% if redeemed in the first, second and third year respectively Minimum investment: INR 50 lacs Private & Confidential. 17
DISCLAIMER "This document has been made available solely for informational purposes and is for private circulation only. Neither the transmission of this document nor the transmission of any information contained herein is intended to create, and receipt hereof, does not constitute formation of any relationship between Marcellus Investment Managers Private Limited (“Marcellus”) and the recipient and shall not entitled the recipient to circulate, share or rely upon the information contained herein for any other purpose other than the limited intended purpose only. Marcellus disclaims any and all liability arising from actions taken or omitted to be taken based on the contents herein. " 18