Lecture 2 Understanding Chinas Growth Introduction Despite Chinas


 • The big questions turn around • Kt (capital")
 • IMF team report. • Kt grew by 7% between 1979 -94")
 • Yt = Aet. Kt. Lt • Ln Yt = a 0")
 • Suggests a 3% annual growth in TFP from 1978 to 1998.")
 Contrarian view critical of official statistics (1978 -1998). 1. Statistical Bureau reluctant")
 • Try to predict growth over the next two decades. • Growth")
 • Use official statistics. Accept possible deflator problems but also underestimation of")
 • Inconsistencies between census and data on graduation. Build data using age-specific")
")
")


- Slides: 28
Lecture 2. Understanding China’s Growth.
Introduction. • Despite China’s remarkable growth, there is not much literature trying to explain its very high growth rates. • There is much speculation about the causes of Chinese economic growth and about predictions for the future. • Many of the data, especially from the past, are problematic and subject to criticism. • We are at a stage where we get mostly only macroeconomic estimates.
• Yt=At. F(Kt, Lt) • The big questions turn around • Kt (capital stock). Problem of valuation of socialist capital. • At (total factor productivity). • Lt also raises problems of its own (problems associated to one child policy)
Hu-Khan (1997) • IMF team report. • Kt grew by 7% between 1979 -94 but capital output ratio has remained more or less constant (no capital deepening). • Estimate TFP growth of 3. 9% in that period (compared to 2% for Asian tigers). Explain by success of reforms.
Chow-Li (2002) • Yt = Aet. Kt. Lt • Ln Yt = a 0 + a 1 ln. Kt + a 2 ln. Lt +a 3 t. 6136. 4118. 0263 (. 0772) (. 1996) (. 0025) • Trend only significant after 1978. • Suggests constant returns to scale (a 1 +a 2 not different from 1). • Ln (Yt/Lt) = a 0 + a 1 ln (Kt/Lt) +a 3 t. 5577. 03028 (. 0468) (. 0040)
Chow-Li (2002) • Suggests a 3% annual growth in TFP from 1978 to 1998. • Growth of 9. 1% can be decomposed in – 5% due to capital (. 5577 X 9. 1) – 3% due to TFP growth – 1. 1% due to labor [(1 -. 5577)x 2. 7] • Growth due mostly to capital accumulation and TFP growth (1/3 of growth explained by TFP growth). • Projections of 8% annual growth until 2010. Were not proven wrong.
Young (2003) Contrarian view critical of official statistics (1978 -1998). 1. Statistical Bureau reluctant to revise downward estimates. 2. Problems with reporting nominal and constant output by enterprises. Leads to underestimation of deflator by 1. 7 to 2. 5 %. 3. Proposes reconstruction of many data but with not too many differences. 1. 2. 3. 4. 5. Output per capita growth at 6. 1% (instead of 7. 8), output per worker at 5. 2% (instead of 6. 9) due to rising participation rates, non agricultural output per worker at 3. 6% (instead of 6. 1%) non agricultural output per effective worker to 2. 6% (instead of 5%), non agricultural TFP per worker at 1. 4 (instead of 3).
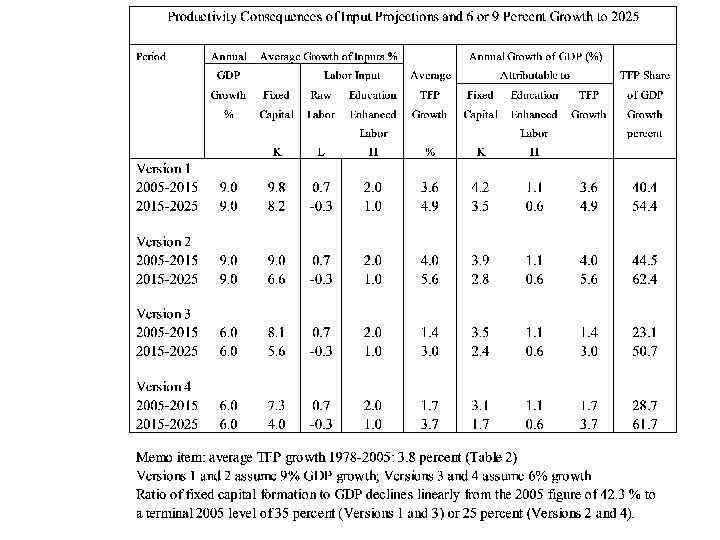
Perkins-Rawski (2007) • Try to predict growth over the next two decades. • Growth accounting: • TFP growth = g. Y – a. Kg. K -a. Lg. L • g. Y , g. K , g. L growth rates of GDP, capital and labor. • Shares of capital and labor a. K, a. L in total factor payments (in total national income).
Perkins-Rawski (2007) • Use official statistics. Accept possible deflator problems but also underestimation of service sector. Moreover, quality adjustments not applied in existing price indices. • Use 2000 prices to avoid inflated industrial prices from socialism. • Capital stock estimated using annual investment outlays and depreciation rate of 9. 6% (perpetual inventory method) • Labor measured as population 16 -65 and decomposing in 5 education categories (no diploma, primary, junior high, high school, college).
Perkins-Rawski (2007) • Inconsistencies between census and data on graduation. Build data using age-specific mortality rates and graduation rates. • L = L 1 + L 2 + L 3 + L 4 + L 5 • H = w 1 L 1 + w 2 L 2 + w 3 L 3 + w 4 L 4 + w 5 L 5 • wi are education-linked wage differentials. • H/L measures educational attainment.
Perkins-Rawski (2007)
Perkins-Rawski (2007)
• Japan’s postwar growth based on TFP growth. Half of 9% growth rate between 1950 and 1970 explained by TFP. Later slowdown associated to fall in TFP growth. • Question: Will the growth continue?
Low dependency ratio imply robust household savings
Projections of Working Age Non-Student Population Ages 16 -65: Size and Composition, 2005 -2025 Decline of L after 2015 but increasing human capital
It would take China 10 -15 years at least to reach PPP GDP per capita of $13, 000 ($5, 300 in 2007).
How productive is investment in China? • China has had a very high investment rate (around 40%). This suggests that the marginal product of investment might be low (too much investment and allocative inefficiencies). However, a very high marginal return to capital might explain a high investment rate. • Bai et al. (2006) have addressed this question.
How productive is investment in China? • Use revised output estimates after 2004 census (covers 1978 -2004). • Assume depreciation rate of 8 % for structure and of 24 % for machinery. Use estimate of initial stock for 1952 plus gross fixed capital formation. • Estimate share of capital income as residual of labor income.
How productive is investment in China? • Estimates relatively high even though falling. • Why have returns remained high? – Capital-output ratio has not increased much – Capital share has increased steadily together with increase in the investment rate.
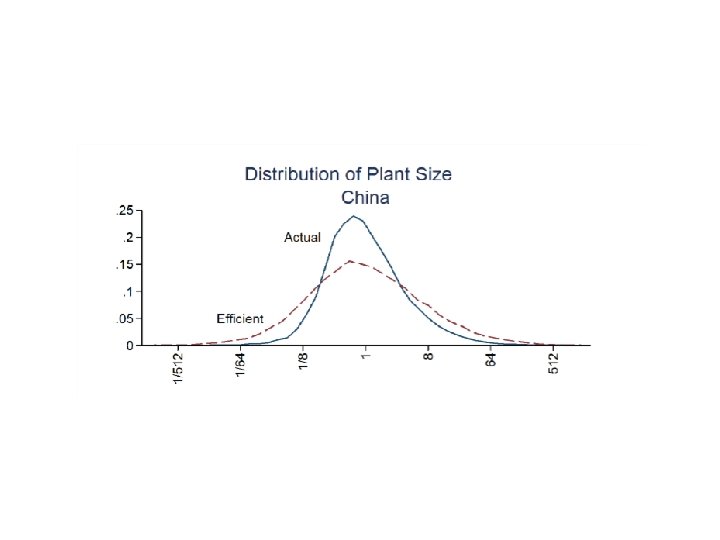
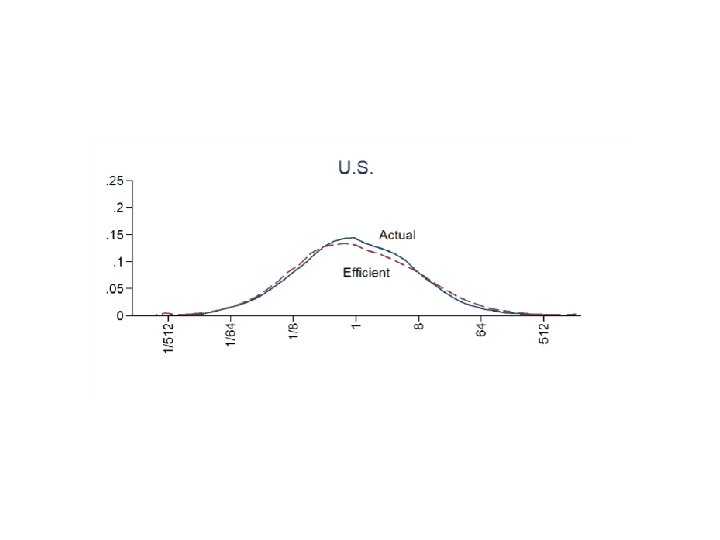
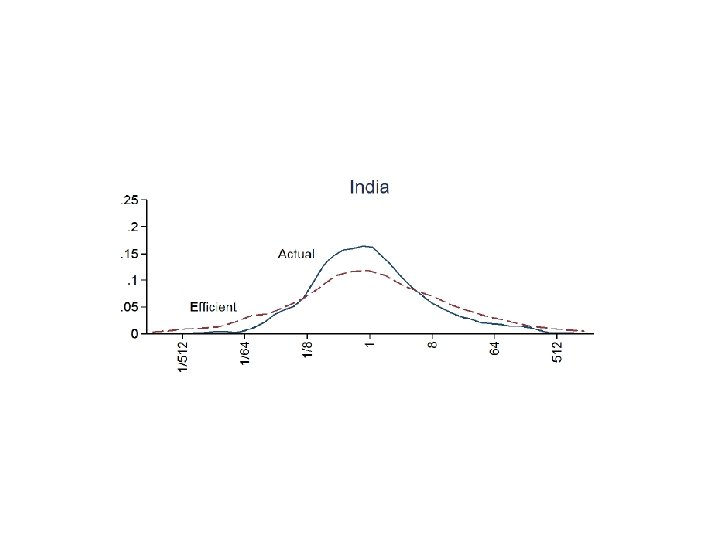
How much misallocation of capital in China? • There is a strong perception that despite strong growth, there may be a severe misallocation of capital in China. • General idea: if distortions favor certain firms, they can survive with lower TFP than firms that do not benefit from those distortions. Hsieh and Klenow (2008).
Open questions • China’s growth will affect the global economy and there may be feedback effects. • Energy. • Environment.