LandOcean Contrast in Tropical Convection T Matsui 1
- Slides: 6
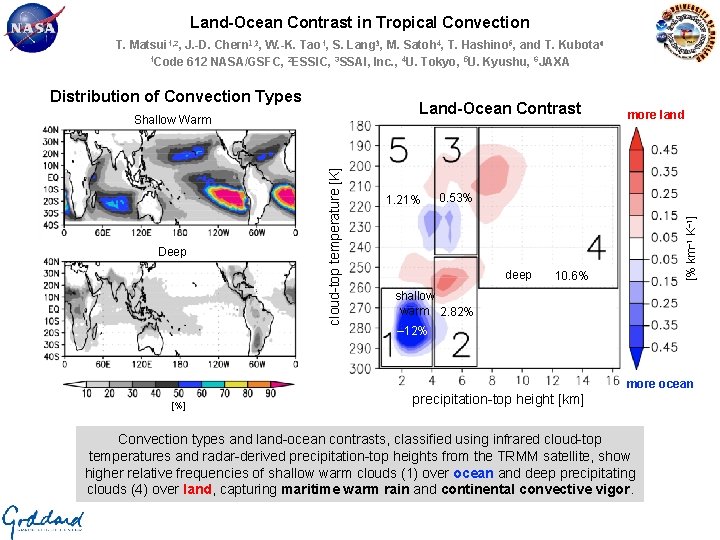
Land-Ocean Contrast in Tropical Convection T. Matsui 1, 2, J. -D. Chern 1, 2, W. -K. Tao 1, S. Lang 3, M. Satoh 4, T. Hashino 5, and T. Kubota 6 1 Code 612 NASA/GSFC, 2 ESSIC, 3 SSAI, Inc. , 4 U. Tokyo, 5 U. Kyushu, 6 JAXA Land-Ocean Contrast Deep cloud-top temperature [K] Shallow Warm 1. 21% more land 0. 53% deep [% km– 1 K– 1] Distribution of Convection Types 10. 6% shallow warm 2. 82% – 12% more ocean [%] precipitation-top height [km] Convection types and land-ocean contrasts, classified using infrared cloud-top temperatures and radar-derived precipitation-top heights from the TRMM satellite, show higher relative frequencies of shallow warm clouds (1) over ocean and deep precipitating clouds (4) over land, capturing maritime warm rain and continental convective vigor.
Name: Toshi Matsui, NASA/GSFC, Code 612 / ESSIC UMD E-mail: Toshihisa. Matsui-1@nasa. gov Phone: 301 -614 -5658 References: Matsui, T. , J. Chern, W. -K. Tao, S. Lang, M. Satoh, T. Hashino, and T. Kubota (2016), On the land-ocean contrast of tropical convection and microphysics statistics derived from TRMM satellite signals and global storm-resolving models. Journal of Hydrometeorology, 17, 1425 -1445. doi: http: //dx. doi. org/10. 1175/JHM-D-15 -0111. 1. Data Sources: This study utilizes collocated TRMM precipitation radar (PR) 13. 8 -GHz attenuation-corrected radar reflectivity from the TRMM 2 A 25 product, Visible Infrared Scanner (VIRS) 12 -µm infrared (IR) brightness temperature from the TRMM 1 B 01 product, and TRMM Microwave Imager (TMI) 85. 5 -GHz dual-polarization microwave brightness temperature from the TRMM 1 B 11 product. These datasets are available from the NASA Precipitation Processing System (PPS). We gratefully acknowledge Dr. R. Kakar for his support of the TRMM projects. Technical Description of Figures: Tropical distribution of convection characteristics (left): Using 14 years of observations from the TRMM VIRS and PR instruments, convection types are classified using infrared cloud-top temperature (CTT) and radar-derived precipitation-top height (PTH). The integrated populations of tropical precipitating cloud types are 14. 1% shallow warm (1), 24. 8% mid-warm (2), 28. 4% mid-cold (3), 14. 6% in deep (4), and 17. 6% in shallow cold (5), with maps of shallow warm and deep convection types shown. Joint CTT-PTH diagram of land-ocean contrast (right): The land-ocean population differences (negative/blue correspond to more ocean, positive/red correspond to more land) over the tropics for the CTT-PTH categories reveal significantly larger proportions of warm rain (-12%) over ocean, underscoring this prevalent maritime rain mode, and deep convection (+10. 6%) over land, highlighting continental convective vigor. Mid-warm clouds have a slightly higher occurrence over land, while mid-cold clouds are separated into relatively warmer (ocean) and colder (land) CTT modes, respectively. Scientific significance, societal relevance, and relationships to future missions: Classifying and quantifying beneficial moderate rain versus catastrophic intense deep convection is important for a range of societal applications from agriculture to safety. By evaluating modelderived land-ocean contrasts against 14 years of TRMM observation, this study offers the first intercomparison of next-generation ultrahighresolution global convection-resolving simulations from the NASA Multi-scale Modeling Framework (MMF) and the Non-hydrostatic Icosahedral Cloud Atmospheric Model (NICAM). The NASA MMF better captures both the frequency and the land-ocean contrast of shallow warm rain while NICAM overestimates warm rain, particularly over land, due to moister boundary level conditions than MMF. Conversely, only the NICAM simulations exhibit enhanced deep convection frequency over land because the NASA MMF lacks heterogeneous surface heat flux which can drive sea-breeze-type mesoscale waves over land. Understanding the detailed cloud-precipitation processes from satellite observations and providing guidance for the development of next-generation ultrahigh-resolution global modeling is a central element of future satellite mission concepts, namely the Cloud and Precipitation Processes Mission (Ca. PPM). This study provides one such satellite-to-model evaluation with respect to the land-ocean contrast in tropical convection. Earth Sciences Division - Atmospheres
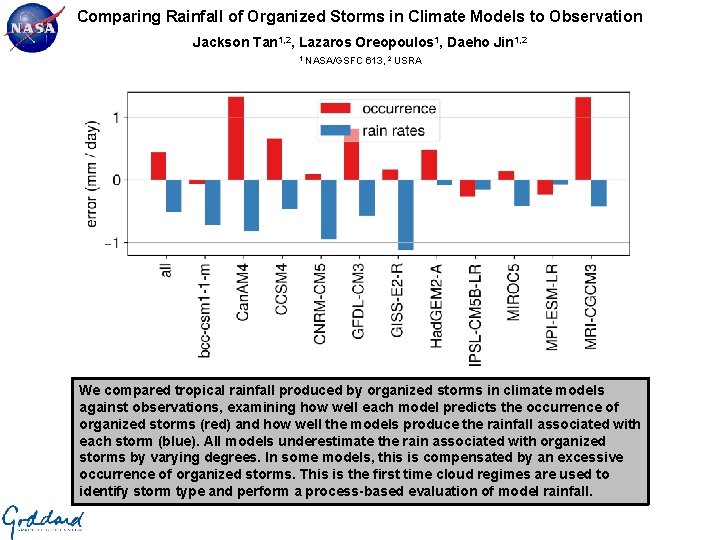
Comparing Rainfall of Organized Storms in Climate Models to Observation Jackson Tan 1, 2, Lazaros Oreopoulos 1, Daeho Jin 1, 2 1 NASA/GSFC 613, 2 USRA We compared tropical rainfall produced by organized storms in climate models against observations, examining how well each model predicts the occurrence of organized storms (red) and how well the models produce the rainfall associated with each storm (blue). All models underestimate the rain associated with organized storms by varying degrees. In some models, this is compensated by an excessive occurrence of organized storms. This is the first time cloud regimes are used to identify storm type and perform a process-based evaluation of model rainfall.
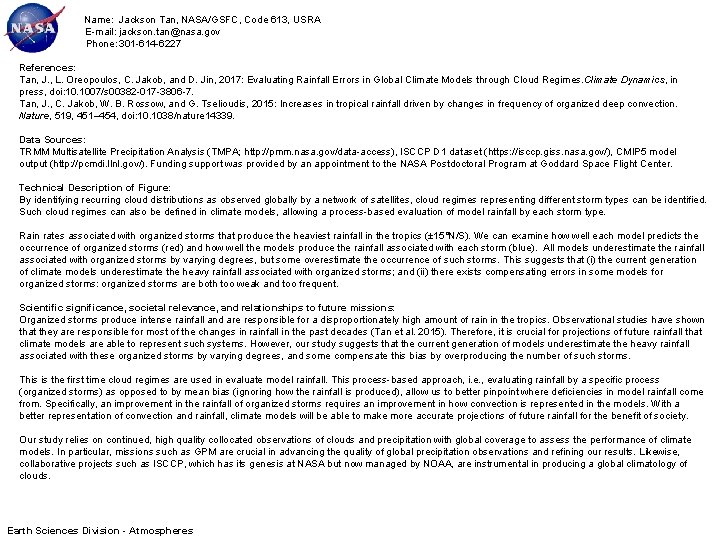
Name: Jackson Tan, NASA/GSFC, Code 613, USRA E-mail: jackson. tan@nasa. gov Phone: 301 -614 -6227 References: Tan, J. , L. Oreopoulos, C. Jakob, and D. Jin, 2017: Evaluating Rainfall Errors in Global Climate Models through Cloud Regimes. Climate Dynamics, in press, doi: 10. 1007/s 00382 -017 -3806 -7. Tan, J. , C. Jakob, W. B. Rossow, and G. Tselioudis, 2015: Increases in tropical rainfall driven by changes in frequency of organized deep convection. Nature, 519, 451– 454, doi: 10. 1038/nature 14339. Data Sources: TRMM Multisatellite Precipitation Analysis (TMPA; http: //pmm. nasa. gov/data-access), ISCCP D 1 dataset (https: //isccp. giss. nasa. gov/), CMIP 5 model output (http: //pcmdi. llnl. gov/). Funding support was provided by an appointment to the NASA Postdoctoral Program at Goddard Space Flight Center. Technical Description of Figure: By identifying recurring cloud distributions as observed globally by a network of satellites, cloud regimes representing different storm types can be identified. Such cloud regimes can also be defined in climate models, allowing a process-based evaluation of model rainfall by each storm type. Rain rates associated with organized storms that produce the heaviest rainfall in the tropics (± 15°N/S). We can examine how well each model predicts the occurrence of organized storms (red) and how well the models produce the rainfall associated with each storm (blue). All models underestimate the rainfall associated with organized storms by varying degrees, but some overestimate the occurrence of such storms. This suggests that (i) the current generation of climate models underestimate the heavy rainfall associated with organized storms; and (ii) there exists compensating errors in some models for organized storms: organized storms are both too weak and too frequent. Scientific significance, societal relevance, and relationships to future missions: Organized storms produce intense rainfall and are responsible for a disproportionately high amount of rain in the tropics. Observational studies have shown that they are responsible for most of the changes in rainfall in the past decades (Tan et al. 2015). Therefore, it is crucial for projections of future rainfall that climate models are able to represent such systems. However, our study suggests that the current generation of models underestimate the heavy rainfall associated with these organized storms by varying degrees, and some compensate this bias by overproducing the number of such storms. This is the first time cloud regimes are used in evaluate model rainfall. This process-based approach, i. e. , evaluating rainfall by a specific process (organized storms) as opposed to by mean bias (ignoring how the rainfall is produced), allow us to better pinpoint where deficiencies in model rainfall come from. Specifically, an improvement in the rainfall of organized storms requires an improvement in how convection is represented in the models. With a better representation of convection and rainfall, climate models will be able to make more accurate projections of future rainfall for the benefit of society. Our study relies on continued, high quality collocated observations of clouds and precipitation with global coverage to assess the performance of climate models. In particular, missions such as GPM are crucial in advancing the quality of global precipitation observations and refining our results. Likewise, collaborative projects such as ISCCP, which has its genesis at NASA but now managed by NOAA, are instrumental in producing a global climatology of clouds. Earth Sciences Division - Atmospheres
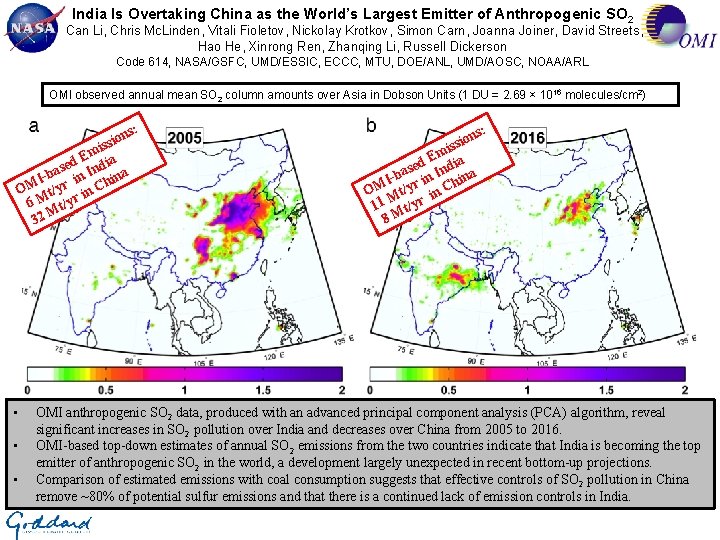
India Is Overtaking China as the World’s Largest Emitter of Anthropogenic SO 2 Can Li, Chris Mc. Linden, Vitali Fioletov, Nickolay Krotkov, Simon Carn, Joanna Joiner, David Streets, Hao He, Xinrong Ren, Zhanqing Li, Russell Dickerson Code 614, NASA/GSFC, UMD/ESSIC, ECCC, MTU, DOE/ANL, UMD/AOSC, NOAA/ARL OMI observed annual mean SO 2 column amounts over Asia in Dobson Units (1 DU = 2. 69 × 1016 molecules/cm 2) ns: o i s s mi E a sed Indi a a b Iin hin OM t/yr in C 6 M t/yr M 32 • • • n ssio i Em ia d e as n Ind na b I i hi OM Mt/yr in C 11 t/yr 8 M s: OMI anthropogenic SO 2 data, produced with an advanced principal component analysis (PCA) algorithm, reveal significant increases in SO 2 pollution over India and decreases over China from 2005 to 2016. OMI-based top-down estimates of annual SO 2 emissions from the two countries indicate that India is becoming the top emitter of anthropogenic SO 2 in the world, a development largely unexpected in recent bottom-up projections. Comparison of estimated emissions with coal consumption suggests that effective controls of SO 2 pollution in China remove ~80% of potential sulfur emissions and that there is a continued lack of emission controls in India.
, Name: Can Li, NASA/GSFC, Code 614 and ESSIC/UMD E-mail: can. li@nasa. gov Phone: 301 -614 -5616 References: Li, C. , Mc. Linden, C. , Fioletov, V. , Krotkov, N. , Carn, S. , Joiner, J. , Streets, D. , He, H. , Ren, X. , Li, Z. , and Dickerson, R. : India is overtaking China as the world’s largest emitter of anthropogenic sulfur dioxide, Scientific Reports, , 7, 14304, DOI: 10. 1038/s 41598 -017 -14639 -8, 2017. . Fioletov, V. E. , Mc. Linden, C. A. , Krotkov, N. , Li, C. , Joiner, J. , Theys, N. , Carn, S. , and Moran, M. D. : A global catalogue of large SO 2 sources and emissions derived from the Ozone Monitoring Instrument. Atmos. Chem. Phys. 16, 11497 -11519, 2016. Data Sources: Level 2 NASA Aura Ozone Monitoring Instrument (OMI) total column SO 2 data (OMSO 2) produced from OMI level 1 radiance data, using the NASA GSFC principal component analysis (PCA) satellite trace gas retrieval algorithm. A database of annual SO 2 emissions for ~500 large point sources worldwide, including 47 in India and 82 in China, estimated by combining OMSO 2 product and assimilated wind field: Vitali Fioletov, Chris Mc. Linden, Nickolay Krotkov, Can Li, Peter Leonard, Joanna Joiner, Simon Carn (2017), Multi-Satellite Air Quality Sulfur Dioxide (SO 2) Database Long-Term L 4 Global V 1, Greenbelt, MD, USA, Goddard Earth Science Data and Information Services Center (GES DISC), doi: 10. 5067/MEASURES/SO 2/DATA 403 Technical Description of Figures: Graphic 1: Annual mean SO 2 column amounts over Asia in Dobson Units (1 DU = 2. 69 × 1016 molecules/cm 2) for 2005 (left) and 2016 (right) retrieved by OMI. The total column amount or vertical column density reflects the estimated total number of SO 2 molecules in the entire atmospheric column above a unit area of the surface. The retrieved column amounts change with the assumed a priori vertical profiles of SO 2. In this plot, SO 2 is presumed to be released from anthropogenic sources and predominantly in the planetary boundary layer or the lowest ~1 km of the atmosphere. For this analysis, OMI pixels with a large cloud fraction (> 0. 2) or a large solar zenith angle (> 70°) or from the edge of the swath (cross track positions 1 -10 and 51 -60) were excluded. Additionally, data from days potentially influenced by large transient volcanic plumes were excluded. Scientific significance, societal relevance, and relationships to future missions: Severe haze has become an important public health issue in India and China, causing an estimated over 1 million premature deaths each year. Both countries rely heavily on sulfur-rich coal as an energy source to fuel their fast growing economies. The resulting emissions of SO 2, a toxic pollutant gas, lead to production of sulfate aerosols that reduce visibility and adversely affect human health. Accurate information on the sources of SO 2 and other pollutants is needed for predicting and mitigating air pollution. For India and China, such information has been difficult to obtain, due to incomplete or outdated knowledge of emission sources. Here, we demonstrate that OMI data can provide “top-down” constraints on SO 2 emissions. We show that China and India are on opposite trajectories in terms of SO 2 pollution. Since 2007, SO 2 emissions in China have declined by 75% due to effective pollution control. Meanwhile, SO 2 emissions in India have increased by 50% due to increased production and continued lack of control. As a result, India is now becoming the world’s top emitter of anthropogenic SO 2. Our finding is largely unexpected in recent bottom-up projections. While most predict the decrease of SO 2 emissions from China, OMI data suggest that the reduction has occurred much sooner and faster than expected. Despite this reduction, haze is still a severe problem in China, suggesting that it is also critical to reduce the emissions of other pollutants, such as NOx and VOCs. We estimate that ~33 million people in India now live in areas with severe SO 2 pollution, and this number will grow further due to continued growth in coal consumption. Finally, the loading of sulfate aerosols over East Asia will likely decrease as a result of SO 2 reduction, and this may lead to accelerated regional warming. Our results highlight the value of long-term, consistent satellite observations in detecting changes in global and regional environment. It has been demonstrated that the PCA algorithm is capable of producing highly consistent SO 2 data between Aura/OMI and SNPP/OMPS. The algorithm can also be implemented with NASA/NOAA JPSS-1/OMPS and ESA TROPOMI, as well as future geostationary sensors such as NASA/TEMPO and Korean GEMS. Earth Sciences Division - Atmospheres