K8 Model Refinements Dr Jennifer Fletcher ADE Agenda



- Slides: 37
K-8 Model Refinements Dr. Jennifer Fletcher, ADE
Agenda • K-8 Model • 9 -12 Models • Follow-Up Items
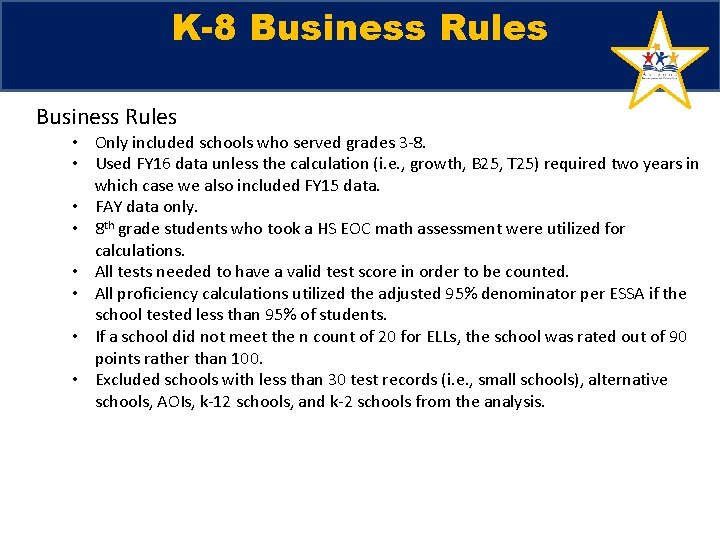
K-8 Business Rules • Only included schools who served grades 3 -8. • Used FY 16 data unless the calculation (i. e. , growth, B 25, T 25) required two years in which case we also included FY 15 data. • FAY data only. • 8 th grade students who took a HS EOC math assessment were utilized for calculations. • All tests needed to have a valid test score in order to be counted. • All proficiency calculations utilized the adjusted 95% denominator per ESSA if the school tested less than 95% of students. • If a school did not meet the n count of 20 for ELLs, the school was rated out of 90 points rather than 100. • Excluded schools with less than 30 test records (i. e. , small schools), alternative schools, AOIs, k-12 schools, and k-2 schools from the analysis.
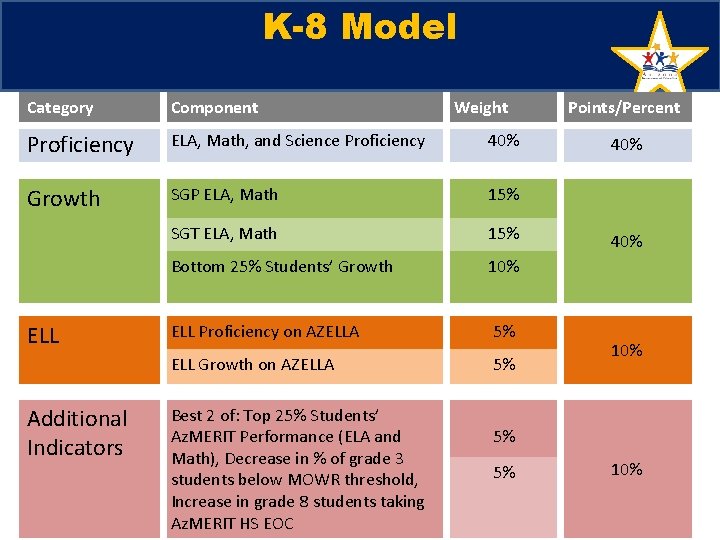
K-8 Model Category Component Proficiency ELA, Math, and Science Proficiency 40% Growth SGP ELA, Math 15% SGT ELA, Math 15% Bottom 25% Students’ Growth 10% ELL Proficiency on AZELLA 5% ELL Growth on AZELLA 5% ELL Additional Indicators Best 2 of: Top 25% Students’ Az. MERIT Performance (ELA and Math), Decrease in % of grade 3 students below MOWR threshold, Increase in grade 8 students taking Az. MERIT HS EOC Weight Points/Percent 40% 10% 5% 5% 10%
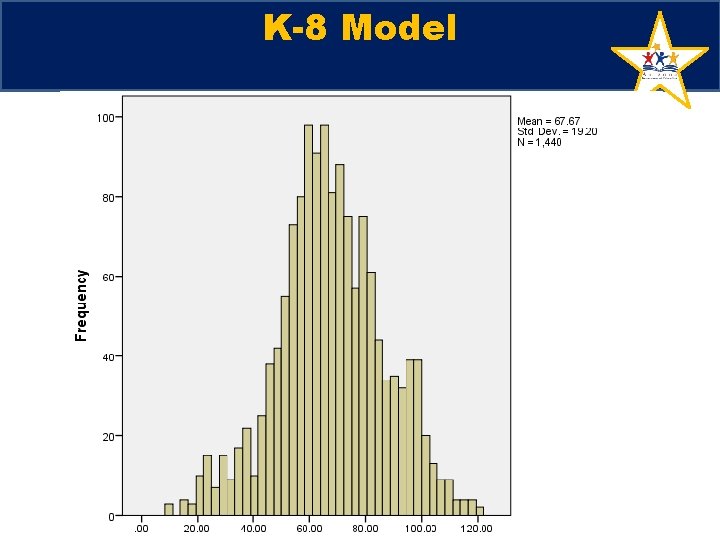
K-8 Model
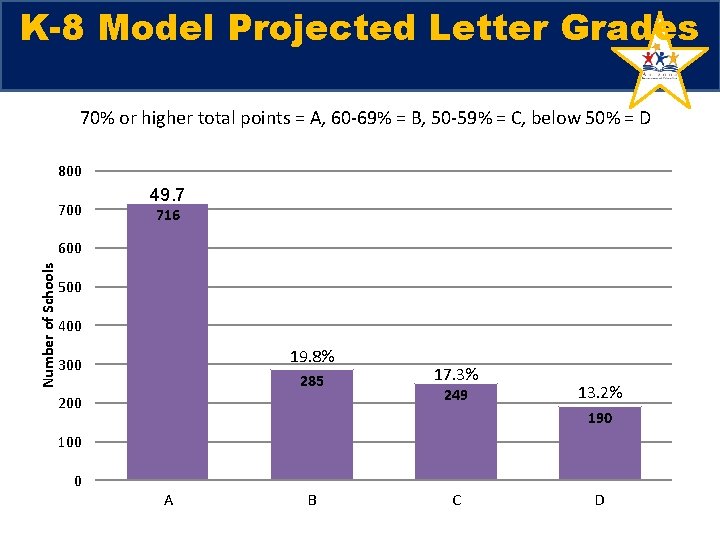
K-8 Model Projected Letter Grades 70% or higher total points = A, 60 -69% = B, 50 -59% = C, below 50% = D 800 700 49. 7 716 Number of Schools 600 500 400 19. 8% 300 285 200 17. 3% 249 13. 2% 190 100 0 A B C D
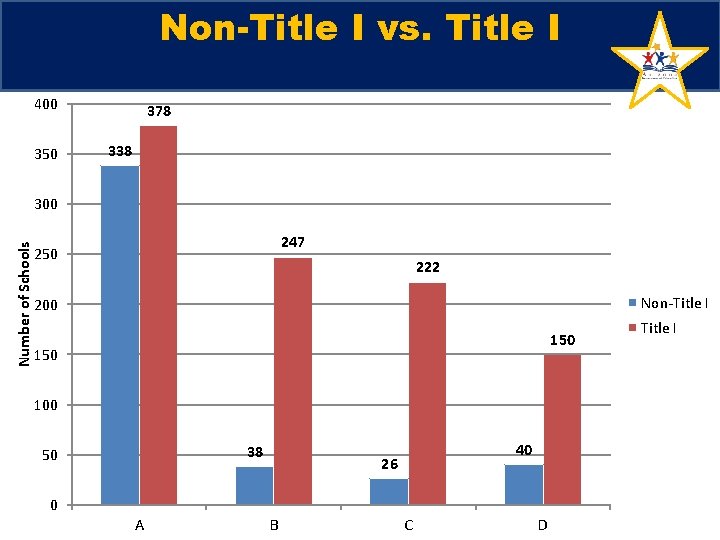
Non-Title I vs. Title I 400 350 378 338 Number of Schools 300 247 250 222 Non-Title I 200 150 100 38 50 40 26 0 A B C D Title I
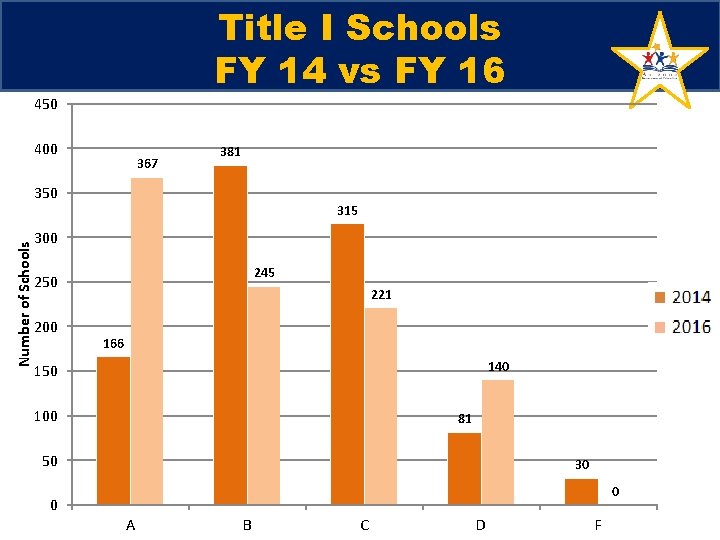
Title I Schools FY 14 vs FY 16 450 400 367 381 Number of Schools 350 315 300 245 250 200 221 Series 2 166 140 150 100 81 50 30 0 0 A B C D F
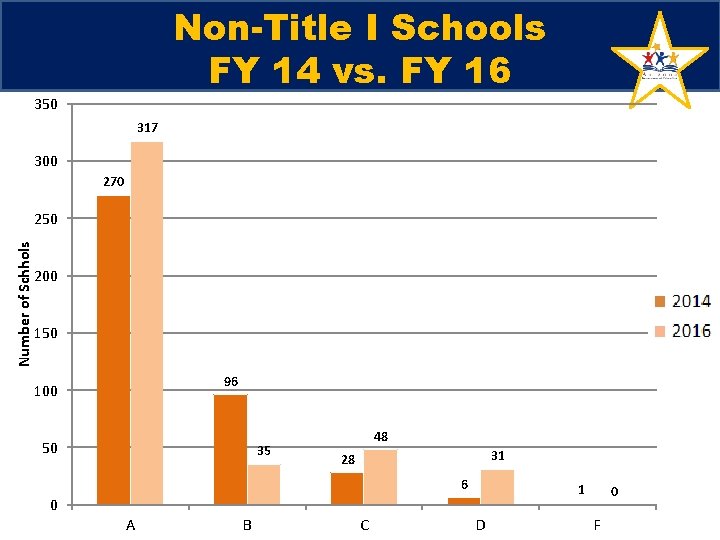
Non-Title I Schools FY 14 vs. FY 16 350 317 300 270 Number of Schhols 250 200 Series 1 Series 2 150 96 100 50 35 48 31 28 6 1 0 A B C D 0 F
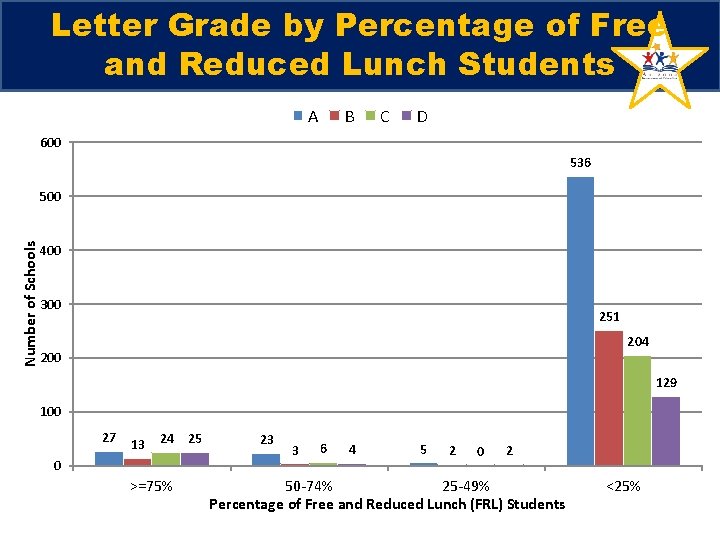
Letter Grade by Percentage of Free and Reduced Lunch Students A B C D 600 536 Number of Schools 500 400 300 251 204 200 129 100 27 13 24 0 >=75% 25 23 3 6 4 5 2 0 2 50 -74% 25 -49% Percentage of Free and Reduced Lunch (FRL) Students <25%
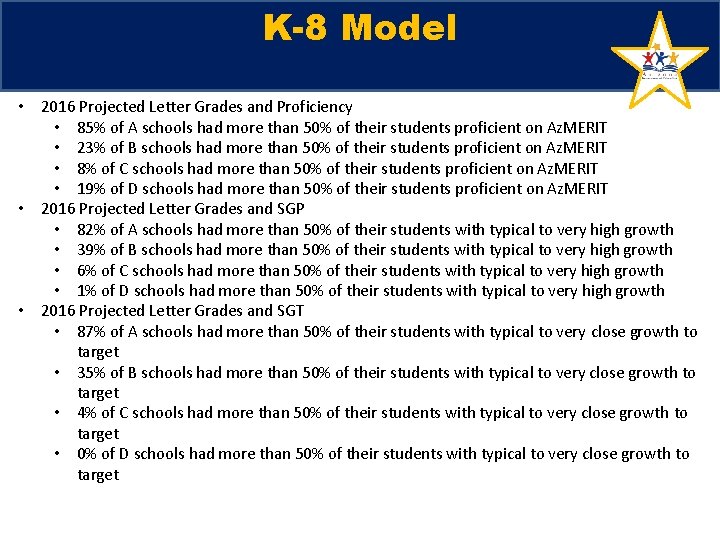
K-8 Model • 2016 Projected Letter Grades and Proficiency • 85% of A schools had more than 50% of their students proficient on Az. MERIT • 23% of B schools had more than 50% of their students proficient on Az. MERIT • 8% of C schools had more than 50% of their students proficient on Az. MERIT • 19% of D schools had more than 50% of their students proficient on Az. MERIT • 2016 Projected Letter Grades and SGP • 82% of A schools had more than 50% of their students with typical to very high growth • 39% of B schools had more than 50% of their students with typical to very high growth • 6% of C schools had more than 50% of their students with typical to very high growth • 1% of D schools had more than 50% of their students with typical to very high growth • 2016 Projected Letter Grades and SGT • 87% of A schools had more than 50% of their students with typical to very close growth to target • 35% of B schools had more than 50% of their students with typical to very close growth to target • 4% of C schools had more than 50% of their students with typical to very close growth to target • 0% of D schools had more than 50% of their students with typical to very close growth to target
9 -12 Model Refinements
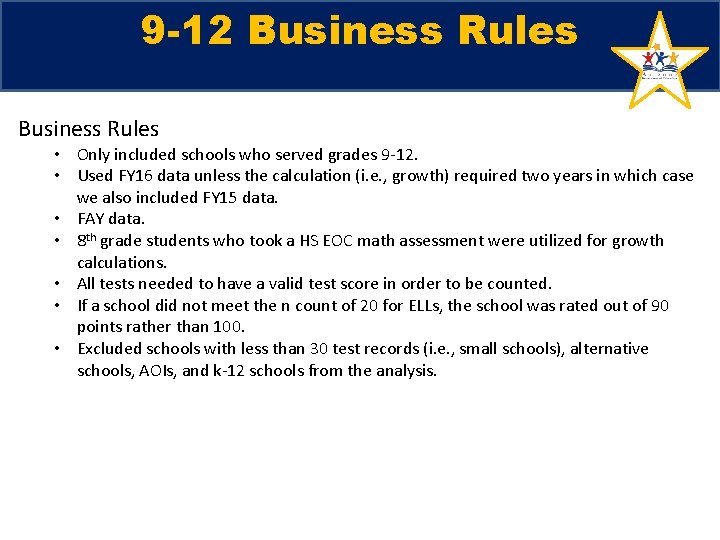
9 -12 Business Rules • Only included schools who served grades 9 -12. • Used FY 16 data unless the calculation (i. e. , growth) required two years in which case we also included FY 15 data. • FAY data. • 8 th grade students who took a HS EOC math assessment were utilized for growth calculations. • All tests needed to have a valid test score in order to be counted. • If a school did not meet the n count of 20 for ELLs, the school was rated out of 90 points rather than 100. • Excluded schools with less than 30 test records (i. e. , small schools), alternative schools, AOIs, and k-12 schools from the analysis.
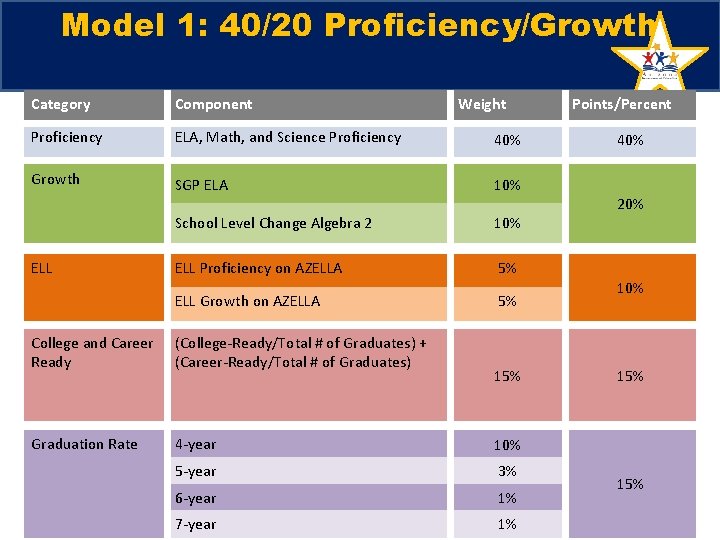
Model 1: 40/20 Proficiency/Growth Category Component Proficiency ELA, Math, and Science Proficiency 40% Growth SGP ELA 10% School Level Change Algebra 2 10% ELL Proficiency on AZELLA 5% ELL Growth on AZELLA 5% ELL Weight College and Career Ready (College-Ready/Total # of Graduates) + (Career-Ready/Total # of Graduates) Graduation Rate 4 -year 10% 5 -year 3% 6 -year 1% 7 -year 1% 15% Points/Percent 40% 20% 15% 15%
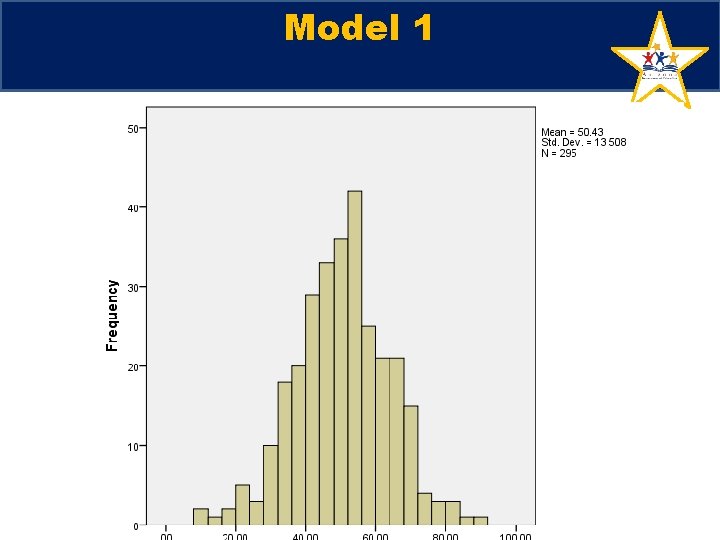
Model 1
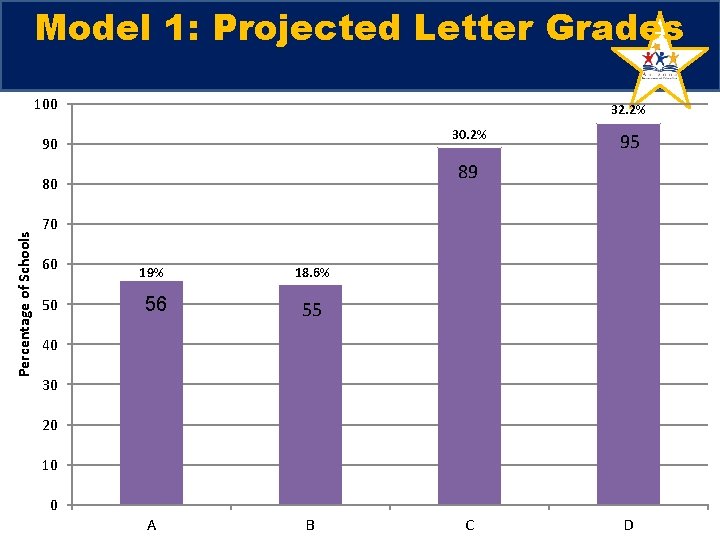
Model 1: Projected Letter Grades 100 32. 2% 30. 2% 90 89 80 Percentage of Schools 95 70 60 19% 50 56 55 A B 18. 6% 40 30 20 10 0 C D
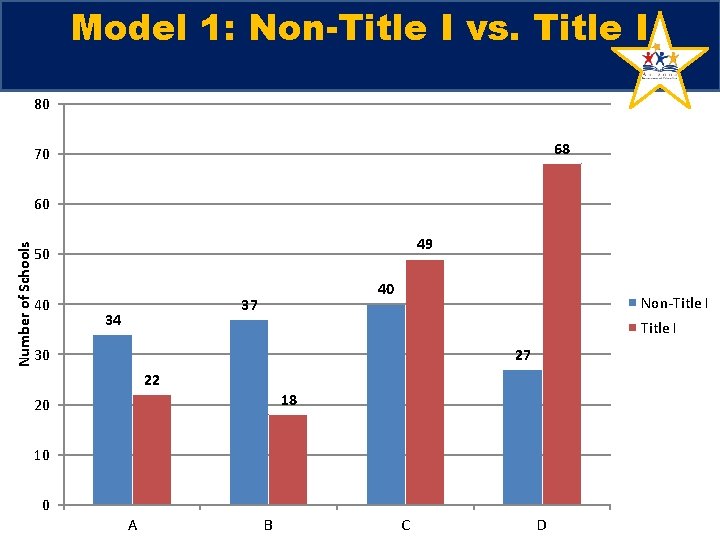
Model 1: Non-Title I vs. Title I 80 68 70 Number of Schools 60 49 50 40 40 37 34 Non-Title I 27 30 22 18 20 10 0 A B C D
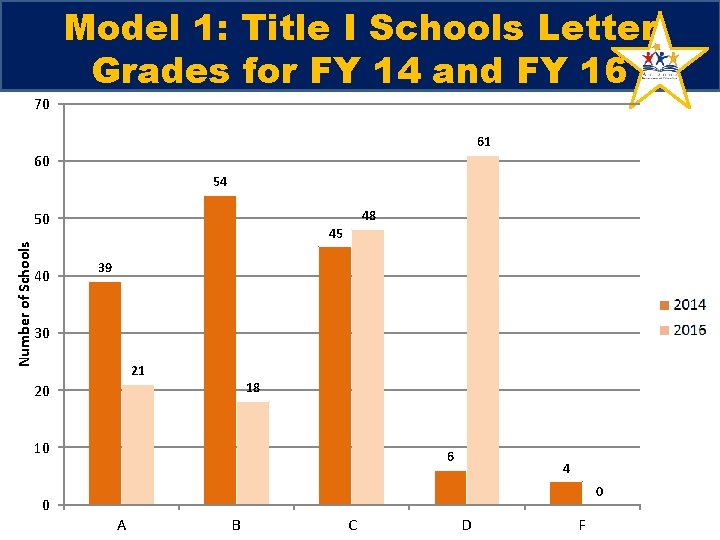
70 Model 1: Title I Schools Letter Grades for FY 14 and FY 16 61 60 54 48 Number of Schools 50 40 45 39 Series 1 Series 2 30 21 18 20 10 6 4 0 0 A B C D F
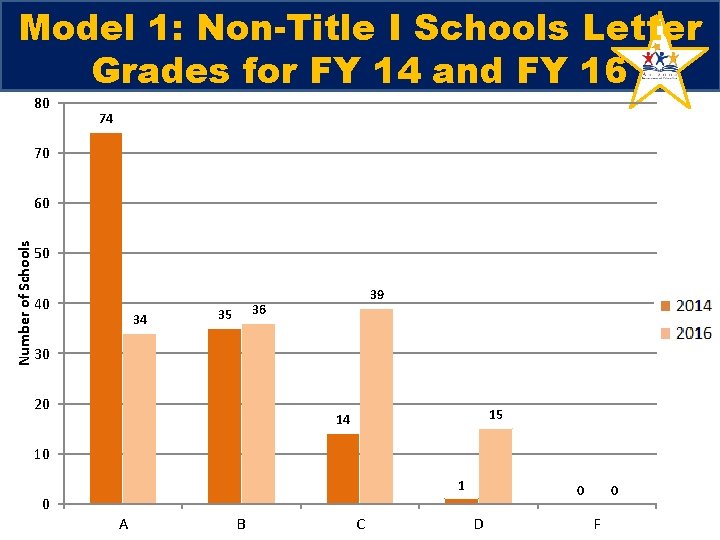
Model 1: Non-Title I Schools Letter Grades for FY 14 and FY 16 80 74 70 Number of Schools 60 50 40 34 39 36 35 Series 1 Series 2 30 20 15 14 10 1 0 0 A B C D 0 F
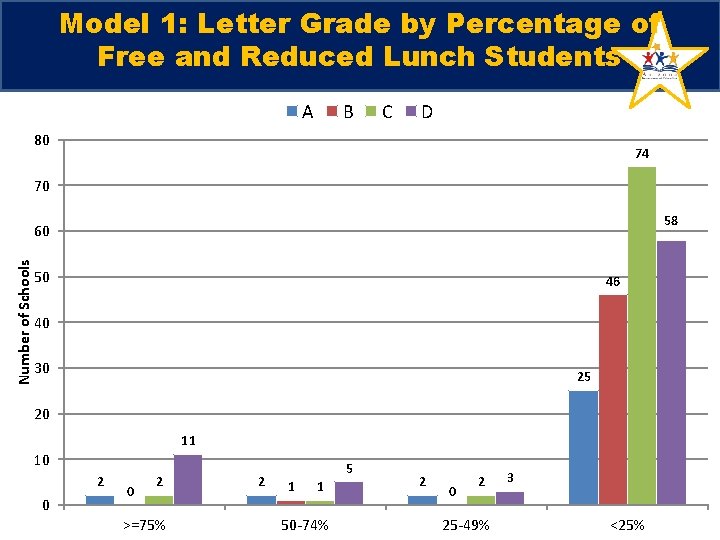
Model 1: Letter Grade by Percentage of Free and Reduced Lunch Students A B C D 80 74 70 58 Number of Schools 60 50 46 40 30 25 20 11 10 2 0 0 2 >=75% 2 5 1 1 50 -74% 2 0 2 25 -49% 3 <25%
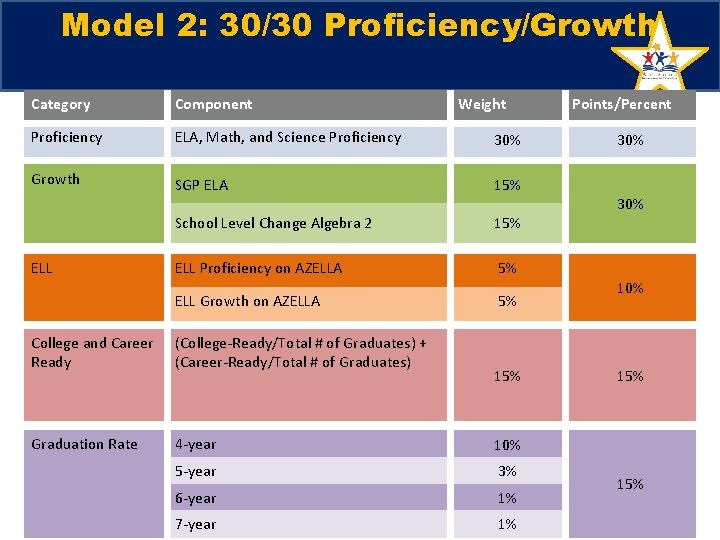
Model 2: 30/30 Proficiency/Growth Category Component Proficiency ELA, Math, and Science Proficiency 30% Growth SGP ELA 15% School Level Change Algebra 2 15% ELL Proficiency on AZELLA 5% ELL Growth on AZELLA 5% ELL Weight College and Career Ready (College-Ready/Total # of Graduates) + (Career-Ready/Total # of Graduates) Graduation Rate 4 -year 10% 5 -year 3% 6 -year 1% 7 -year 1% 15% Points/Percent 30% 10% 15%
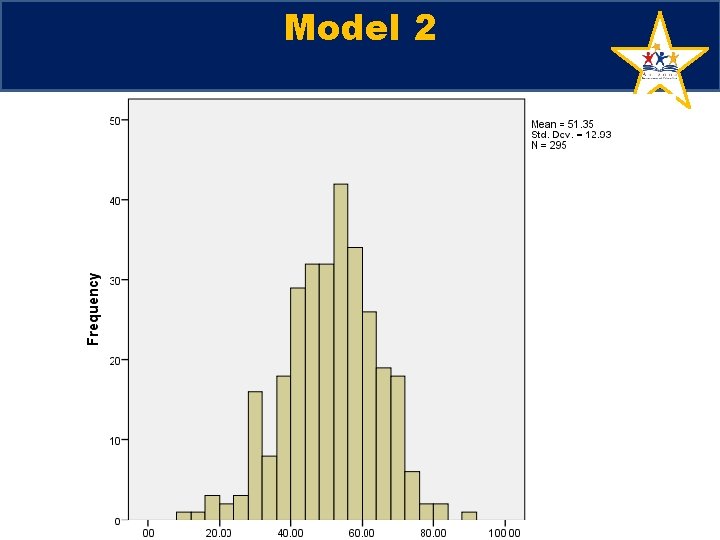
Model 2
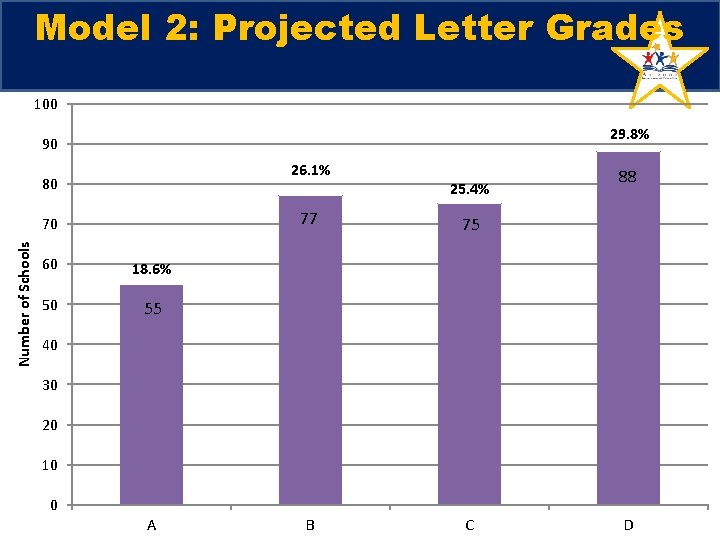
Model 2: Projected Letter Grades 100 29. 8% 90 26. 1% 80 Number of Schools 70 60 18. 6% 50 55 25. 4% 77 75 B C 88 40 30 20 10 0 A D
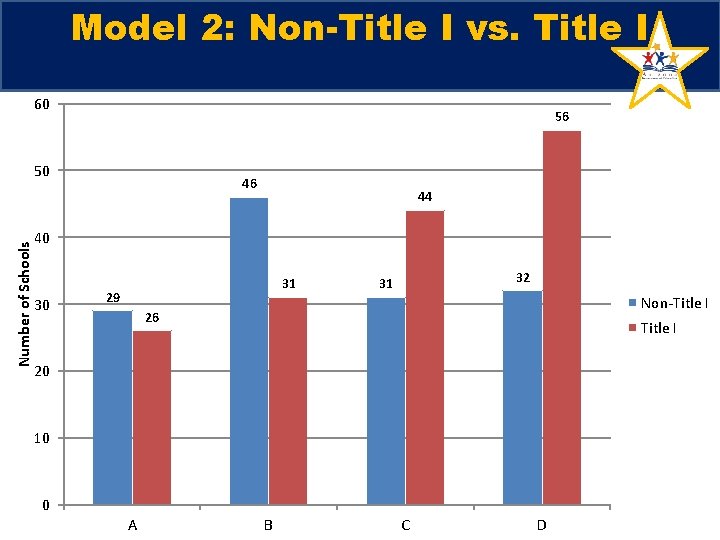
Model 2: Non-Title I vs. Title I 60 56 Number of Schools 50 46 44 40 30 31 29 32 31 Non-Title I 26 Title I 20 10 0 A B C D
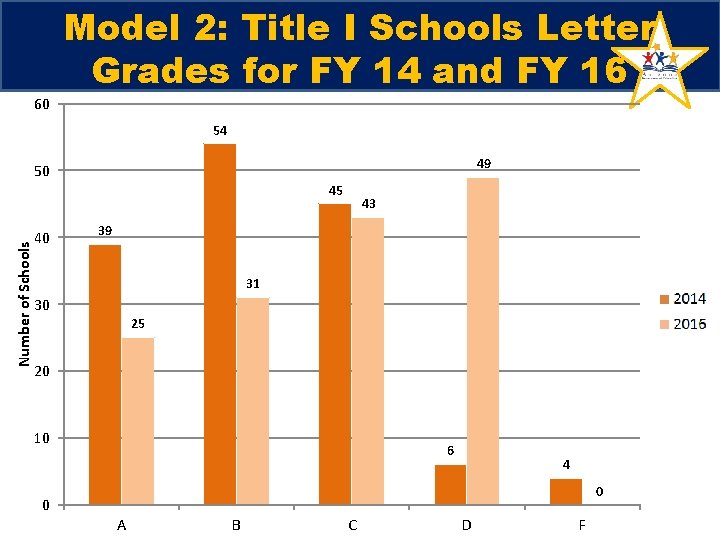
60 Model 2: Title I Schools Letter Grades for FY 14 and FY 16 54 49 50 Number of Schools 45 40 43 39 31 30 Series 1 25 Series 2 20 10 6 4 0 0 A B C D F
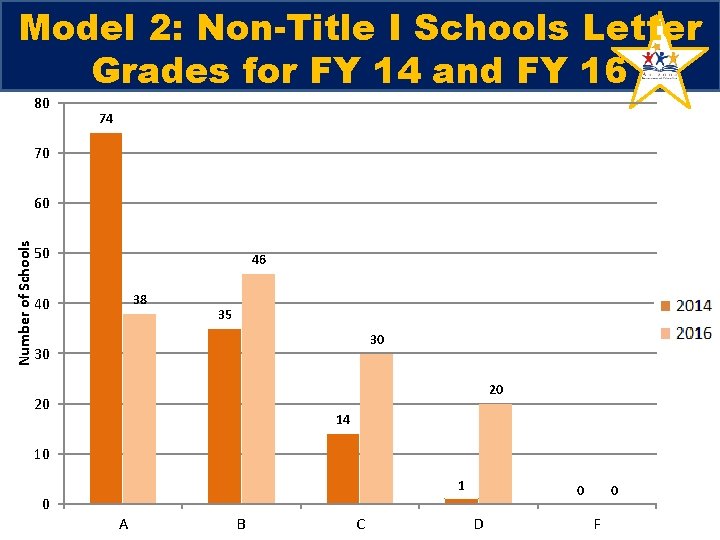
Model 2: Non-Title I Schools Letter Grades for FY 14 and FY 16 80 74 70 Number of Schools 60 50 46 38 40 Series 1 35 Series 2 30 30 20 20 14 10 1 0 0 A B C D 0 F
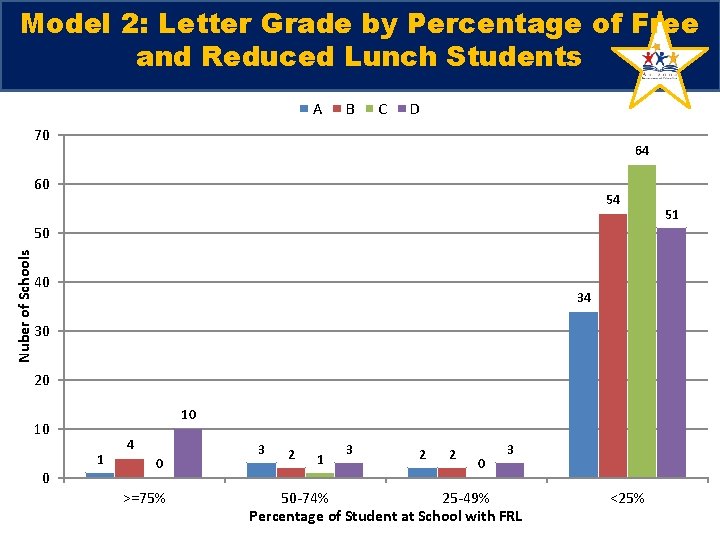
Model 2: Letter Grade by Percentage of Free and Reduced Lunch Students A B C D 70 64 60 54 Nuber of Schools 50 40 34 30 20 10 10 1 0 4 0 >=75% 3 2 1 3 2 2 0 3 50 -74% 25 -49% Percentage of Student at School with FRL <25% 51
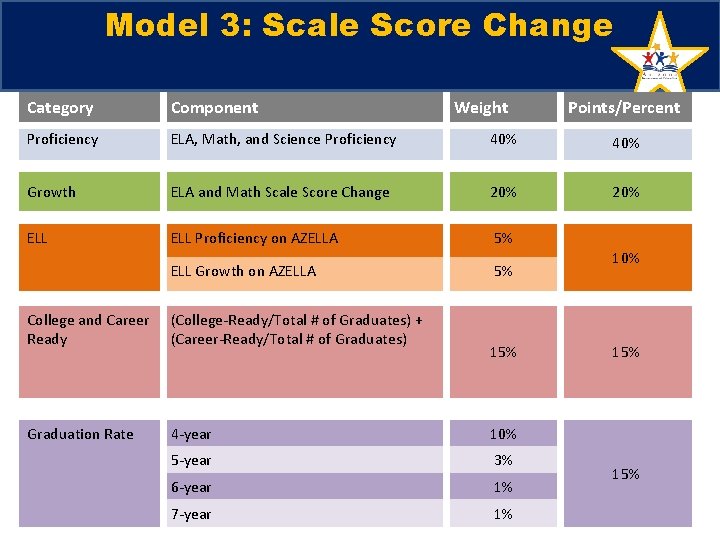
Model 3: Scale Score Change Category Component Weight Proficiency ELA, Math, and Science Proficiency 40% Growth ELA and Math Scale Score Change 20% ELL Proficiency on AZELLA 5% ELL Growth on AZELLA 5% College and Career Ready (College-Ready/Total # of Graduates) + (Career-Ready/Total # of Graduates) Graduation Rate 4 -year 10% 5 -year 3% 6 -year 1% 7 -year 1% 15% Points/Percent 10% 15%
Model 3
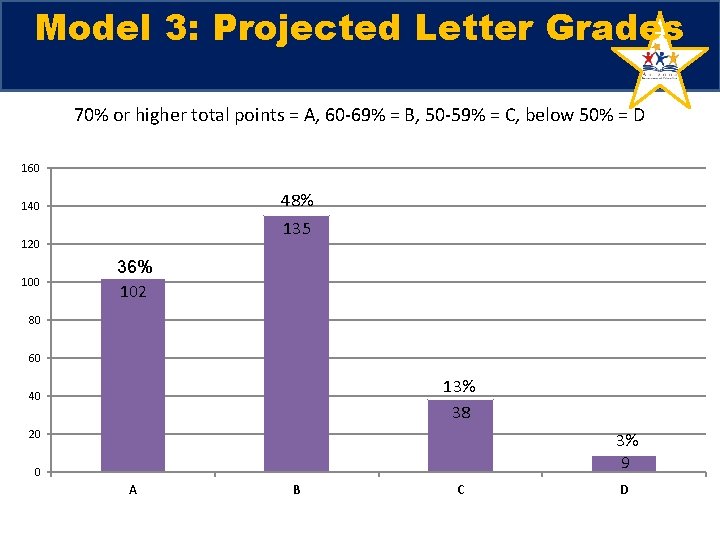
Model 3: Projected Letter Grades 70% or higher total points = A, 60 -69% = B, 50 -59% = C, below 50% = D 160 48% 140 135 120 100 36% 102 80 60 13% 38 40 20 3% 9 0 A B C D
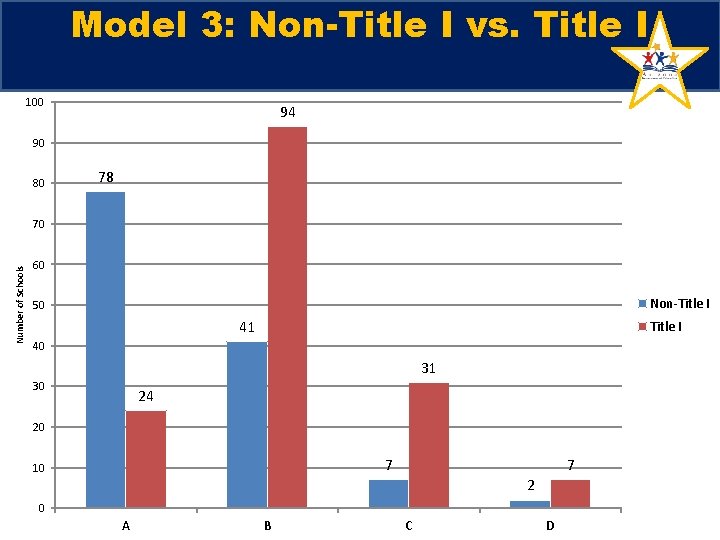
Model 3: Non-Title I vs. Title I 100 94 90 80 78 Number of Schools 70 60 Non-Title I 50 41 Title I 40 31 30 24 20 7 10 7 2 0 A B C D
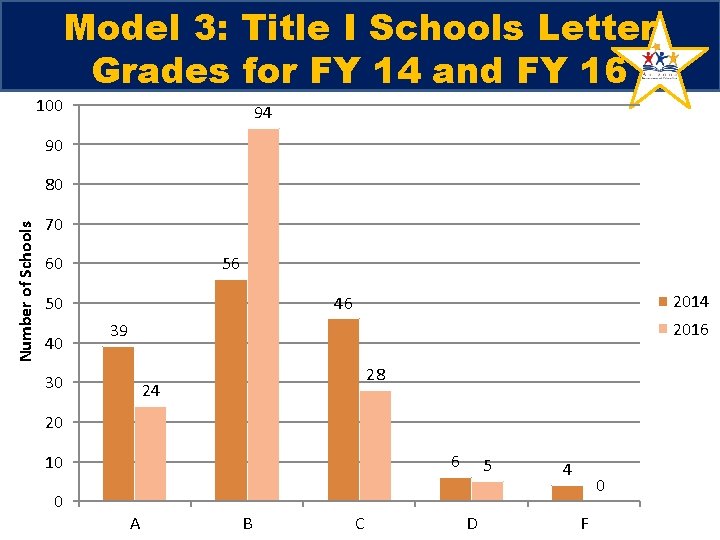
Model 3: Title I Schools Letter Grades for FY 14 and FY 16 100 94 90 Number of Schools 80 70 56 60 40 2014 46 50 2016 39 30 28 24 20 6 10 0 A B C 5 D 4 0 F
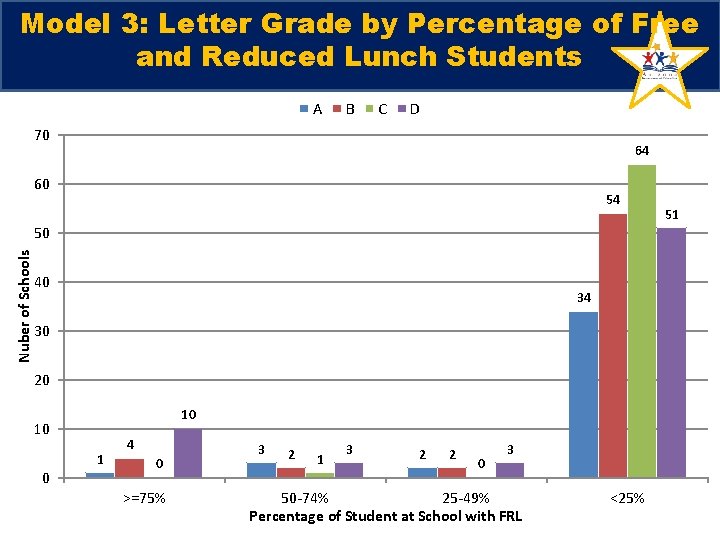
Model 3: Letter Grade by Percentage of Free and Reduced Lunch Students A B C D 70 64 60 54 Nuber of Schools 50 40 34 30 20 10 10 1 0 4 0 >=75% 3 2 1 3 2 2 0 3 50 -74% 25 -49% Percentage of Student at School with FRL <25% 51
Follow-Up Items
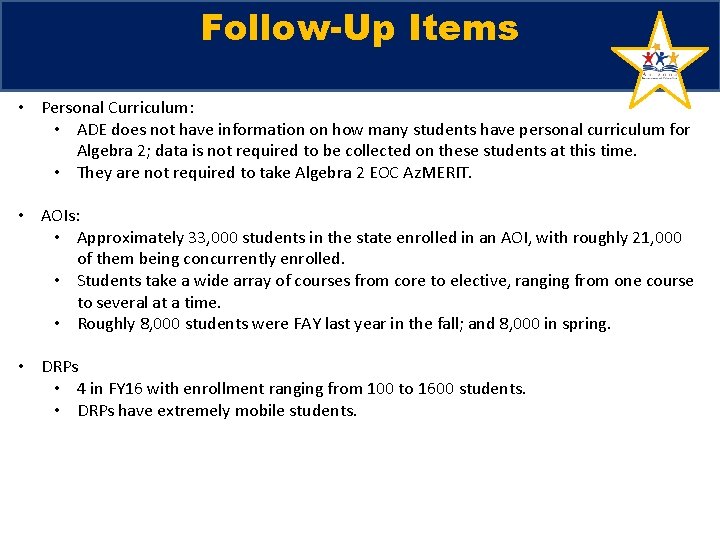
Follow-Up Items • Personal Curriculum: • ADE does not have information on how many students have personal curriculum for Algebra 2; data is not required to be collected on these students at this time. • They are not required to take Algebra 2 EOC Az. MERIT. • AOIs: • Approximately 33, 000 students in the state enrolled in an AOI, with roughly 21, 000 of them being concurrently enrolled. • Students take a wide array of courses from core to elective, ranging from one course to several at a time. • Roughly 8, 000 students were FAY last year in the fall; and 8, 000 in spring. • DRPs • 4 in FY 16 with enrollment ranging from 100 to 1600 students. • DRPs have extremely mobile students.
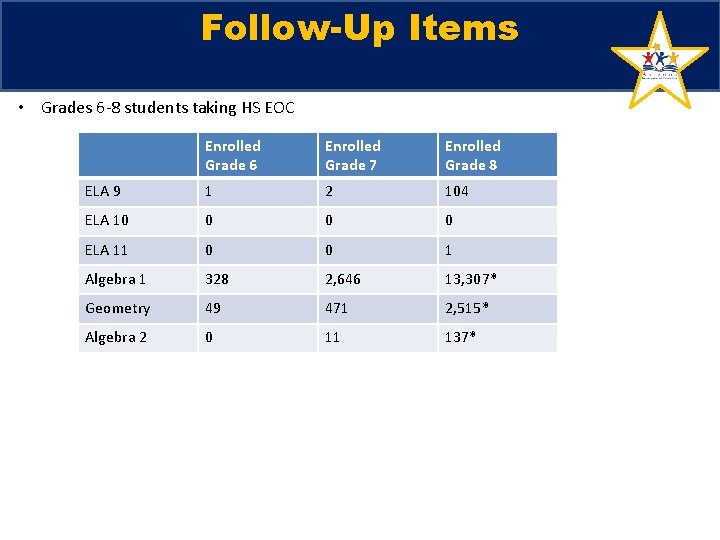
Follow-Up Items • Grades 6 -8 students taking HS EOC Enrolled Grade 6 Enrolled Grade 7 Enrolled Grade 8 ELA 9 1 2 104 ELA 10 0 ELA 11 0 0 1 Algebra 1 328 2, 646 13, 307* Geometry 49 471 2, 515* Algebra 2 0 11 137*
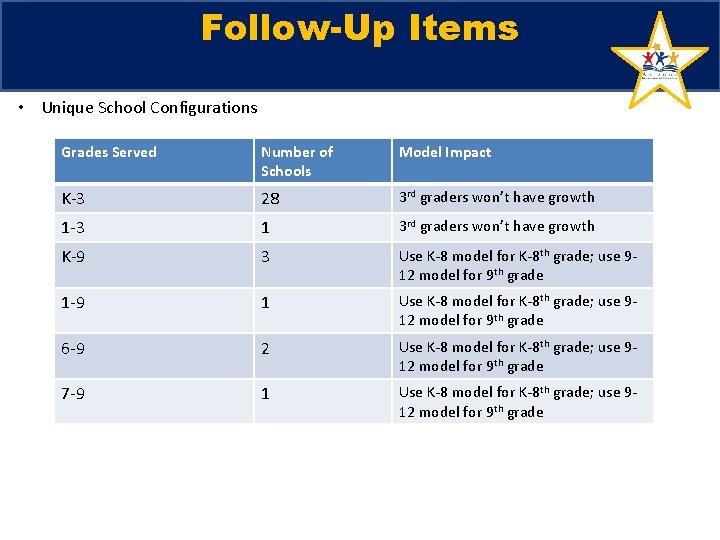
Follow-Up Items • Unique School Configurations Grades Served Number of Schools Model Impact K-3 28 3 rd graders won’t have growth 1 -3 1 3 rd graders won’t have growth K-9 3 Use K-8 model for K-8 th grade; use 912 model for 9 th grade 1 -9 1 Use K-8 model for K-8 th grade; use 912 model for 9 th grade 6 -9 2 Use K-8 model for K-8 th grade; use 912 model for 9 th grade 7 -9 1 Use K-8 model for K-8 th grade; use 912 model for 9 th grade