Investment and financing Investment and financing Definition of


 – source")


 •")


. Analyzing the speed")


 • Revenue - Cash inflows or")
 / Cost of Sales - represents the")


- Slides: 37
Investment and financing
Investment and financing • • Definition of investing and financing Liquidity Financing Investing
Financing vs. investing • Investing = bonding the capital in the assets • Financing = raising money for a business, obtaining capital
Financing • Debt financing vs. Equity financing • Debt financing ( capital) – source of investment rely on borrowed funds • Sources of debt capital: banks, credit unions, relatives and friends • Equity financing ( capital) – selling shares of the company to investors • Sources of equity capital: relatives and friends, business angels and venture capitalists, partners
Liquidity • Liquidity- describes the degree to which an asset or security can be quickly bought or sold in the market without affecting the asset's • • (investopedia. com) Current Ratio = Current Assets / Current Liabilities Current assets are those that can reasonably be converted to cash in one year. Norm – 1, 5 for industrial companies Quick ration = (cash + marketable securities)/current liabilities Quick ration is comparison cash to debt. Norm – 1 for industrial companies
Debt ratio • indicates the percentage of a company's assets that are provided via debt • Debt ratio=total debts/total assets • Or • Debt ratio= total liabilities/total assets • Norm – 0, 5 -0, 6
Balance Sheet model of the firm Total value of assets Total value of the firm to investors
• Fixed assets are those that will last a long time (buildings) • Current assets – have short lives ( inventory) • Capital budgeting, capital expenditures - means the process of making and managing expenditures on longlived assets • Capital structure – the proportions of the firm´s financing from current and long-term debt and equity. • Net working capital – – defined as current assets minus current liabilities, – associated with short term management of cash flow.
Capital structure • How the value of the firm is sliced up. • Creditors- the persons or institutions that buy debt from the firm (DEBT) • Shareholders – the holders of equity shares(STOCK) • Investment decisions determines the value of assets
Capital structure • A firm's capital structure can be a mixture of long-term debt, short-term debt, common equity and preferred equity. A company's proportion of short- and long-term debt is considered when analyzing capital structure. (https: //www. investopedia. com/terms/c/capitalstructure. asp#ixzz 5 Dfodyk. FL ) • To compare capital structure we use Debt- to- Equity ratio • Companies that use more debt than equity to finance assets have a high leverage ratio and an aggressive capital structure. A company that pays for assets with more equity than debt has a low leverage ratio and a conservative capital structure
Debt vs. Equity • Debt is one of the two main ways companies can raise capital in the capital markets. Companies like to issue debt because of the tax advantages. Interest payments are taxdeductible. Debt also allows a company or business to retain ownership, unlike equity. Additionally, in times of low interest rates, debt is abundant and easy to access. (https: //www. investopedia. com/terms/c/capitalstructure. asp #ixzz 5 Dfp 7 yxm. P) • Equity is more expensive than debt, especially when interest rates are low. However, unlike debt, equity does not need to be paid back if earnings decline. On the other hand, equity represents a claim on the future earnings of the company as a part owner. (https: //www. investopedia. com/terms/c/capitalstructur e. asp#ixzz 5 Dfp 7 yxm. P )
Debt- to- Equity ratio • To compare capital structure, it is calculated by dividing debt by equity • Companies that use more debt than equity to finance assets have a high leverage ratio and an aggressive capital structure ( higher growth rates) • A company that pays for assets with more equity than debt has a low leverage ratio and a conservative capital structure ( lower growth rates) (https: //www. investopedia. com/terms/c/capitalstructure. asp#ixzz 5 Dfq. Ev. Jl. B )
Rules for capital structure • ratio between the company’s equity and debt should be 1 : 1 • the principle that the ratio of equity on total resources should be higher than the ratio of debt financing because external capital must be paid back. (Low ratio of equity to external resources is considered a financial drawback of the company which can prove dangerous to its stability. ) • (https: //is. mendelu. cz/eknihovna/opory/zobraz_cast. pl? cast=59747)
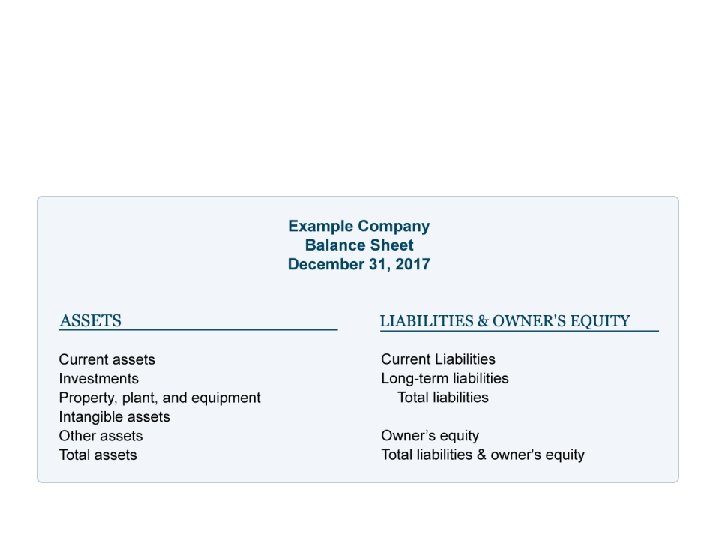
Accounting statements and cash flows • Assets and liabilities and stockholder´s equity • States what the firm owns and how it is financed. • Assets = liabilities + stockholder´s equity
Analyzing a balance sheet • There are two main types of assets: current assets and non-current assets. • Current assets – are converted into cash within one business cycle - usually treated as twelve months. • Three very important current asset items found on the balance sheet are: cash, inventories and accounts receivables (https: //www. investopedia. com/university/fundamentalanalysis/fundanalysis 7. asp#ixzz 5 Dg 7 qs. Fp. S )
Current assets - Cash • Growing cash reserves often signal strong company performance. Indeed, it shows that cash is accumulating so quickly that management doesn't have time to figure out how to make use of it. A dwindling cash pile could be a sign of trouble. That said, if loads of cash are more or less a permanent feature of the company's balance sheet, investors need to ask why the money is not being put to use. Cash could be there because management has run out of investment opportunities or is too short-sighted to know what to do with the money (https: //www. investopedia. com/university/fundamentalanalysis/fundanalysis 7. asp#ixzz 5 Dg 9 GIB 00 )
Current assets - Inventories • Inventories are finished products that haven't yet sold. As an investor, you want to know if a company has too much money tied up in its inventory. Companies have limited funds available to invest in inventory. To generate the cash to pay bills and return a profit, they must sell the merchandise they have purchased from suppliers. • Inventory turnover (cost of goods sold divided by average inventory) measures how quickly the company is moving merchandise through the warehouse to customers. If inventory grows faster than sales, it is almost always a sign of deteriorating fundamentals. (https: //www. investopedia. com/university/fundamentalanalysis/fu ndanalysis 7. asp#ixzz 5 Dg 9 l. P 1 H 6 )
Current assets - Accounts receivables • Receivables are outstanding (uncollected bills). Analyzing the speed at which a company collects what it's owed can tell you a lot about its financial efficiency. If a company's collection period is growing longer, it could mean problems ahead • (https: //www. investopedia. com/university/fundamentalanalysis/fundanalysis 7. asp#ixzz 5 Dg 9 GIB 00 )
Non - Current assets • Non-current assets are defined as anything not classified as a current asset. This includes items that are fixed assets, such as property, plant and equipment (PP&E). Unless the company is in financial distress and is liquidating assets, investors need not pay too much attention to fixed assets. (https: //www. investopedia. com/university/fundamentalanalysis/fundanalysis 7. asp#ixzz 5 Dg 9 GIB 00)
Liabilities • There are current liabilities and non-current liabilities. • Current liabilities are obligations the firm must pay within a year, such as payments owing to suppliers. • Non-current liabilities, meanwhile, represent what the company owes in a year or more time. Typically, non-current liabilities represent bank and bondholder debt.
• You usually want to see a manageable amount of debt. When debt levels are falling, that's a good sign. Generally speaking, if a company has more assets than liabilities, then it is in decent condition. By contrast, a company with a large amount of liabilities relative to assets ought to be examined with more diligence. Having too much debt relative to cash flows required to pay for interest and debt repayments is one way a company can go bankrupt. • Look at the quick ratio. Subtract inventory from current assets and then divide by current liabilities. If the ratio is 1 or higher, it says that the company has enough cash and liquid assets to cover its short-term debt obligations. • Quick Ratio = Current Assets - Inventories /Current Liabilities
Equity • represents what shareholders own, so it is often called shareholder's equity. • Equity = Total Assets – Total Liabilities • The two important equity items are paid-in capital and retained earnings. • Paid-in capital is the amount of money shareholders paid for their shares when the stock was first offered to the public. It basically represents how much money the firm received when it sold its shares. • In other words, retained earnings are a tally of the money the company has chosen to reinvest in the business rather than pay to shareholders. Investors should look closely at how a company puts retained capital to use and how a company generates a return on it.
Accounting liquidity • Refers to the ease and quickness with which assets can be converted to cash. • Current assets are the most liquid and include cash and those assets that will be turned into cash within a year from the date of the balance sheet.
Accounting liquidity • For a corporation with a published balance sheet there are various ratios used to calculate a measure of liquidity. • These include the following: • The current ratio is the simplest measure and calculated by dividing the total current assets by the total current liabilities. A value of over 100% is normal in a non-banking corporation. However, some current assets are more difficult to sell at full value in a hurry. • The quick ratio is calculated by deducting inventories and prepayments from current assets and then dividing by current liabilities, giving a measure of the ability to meet current liabilities from assets that can be readily sold. A better way for a trading corporation to meet liabilities is from cash flows, rather than through asset sales, so; • The operating cash flow ratio can be calculated by dividing the operating cash flow by current liabilities. This indicates the ability to service current debt from current income, rather than through asset sales.
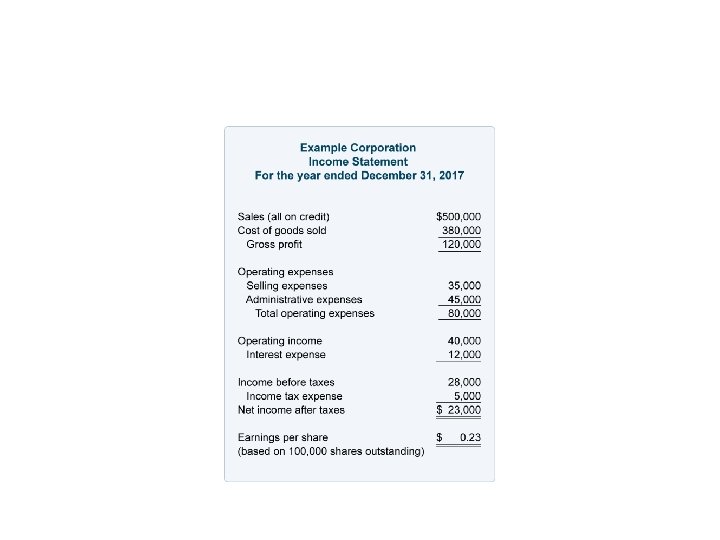
The income statement • Profit and lost account • Revenue – expenses =Income • Measure the performance over specific period of time
Operating section ( www. https: //en. wikipedia. org/wiki/Income_statement) • Revenue - Cash inflows or other enhancements of assets (including accounts receivable) of an entity during a period from delivering or producing goods, rendering services, or other activities that constitute the entity's ongoing major operations. It is usually presented as sales minus sales discounts, returns, and allowances. Every time a business sells a product or performs a service, it obtains revenue. This often is referred to as gross revenue or sales revenue. • Expenses - Cash outflows or other using-up of assets or incurrence of liabilities (including accounts payable) during a period from delivering or producing goods, rendering services, or carrying out other activities that constitute the entity's ongoing major operations.
Expenses – Cost of Goods Sold (COGS) / Cost of Sales - represents the direct costs attributable to goods produced and sold by a business (manufacturing or merchandizing). It includes material costs, direct labour, and overhead costs (as in absorption costing), and excludes operating costs (period costs) such as selling, administrative, advertising or R&D, etc. – Selling, General and Administrative expenses (SG&A or SGA) - consist of the combined payroll costs. SGA is usually understood as a major portion of nonproduction related costs, in contrast to production costs such as direct labour. • Selling expenses - represent expenses needed to sell products (e. g. , salaries of sales people, commissions and travel expenses, advertising, freight, shipping, depreciation of sales store buildings and equipment, etc. ). • General and Administrative (G&A) expenses - represent expenses to manage the business (salaries of officers / executives, legal and professional fees, utilities, insurance, depreciation of office building and equipment, office rents, office supplies, etc. ). – Depreciation / Amortization - the charge with respect to fixed assets / intangible assets that have been capitalised on the balance sheet for a specific (accounting) period. It is a systematic and rational allocation of cost rather than the recognition of market value decrement. – Research & Development (R&D) expenses - represent expenses included in research and development.
Non-operating section • Other revenues or gains - revenues and gains from other than primary business activities (e. g. , rent, income from patents, goodwill). It also includes unusual gains that are either unusual or infrequent, but not both (e. g. , gain from sale of securities or gain from disposal of fixed assets) • Other expenses or losses - expenses or losses not related to primary business operations, (e. g. , foreign exchange loss). • Finance costs - costs of borrowing from various creditors (e. g. , interest expenses, bank charges). • Income tax expense - sum of the amount of tax payable to tax authorities in the current reporting period (current tax liabilities/ tax payable) and the amount of deferred tax liabilities (or assets).
Cash flow • Total cash flow of the firm includes adjustments for capital spending and additions to net working capital. • Cash flow from operating activities – earnings before intererst and depreciation minus taxes • Cash flow from investing activities – involves changes in capital assets: aquisition of fixed assets and sales of fixed assets. • Cash flow from financing activities – include changes in equity and debt.
Financial Statement analysis • • • 1. Short - term solvency 2. Activity 3. Financial leverage 4. Profitability 5. Value
1. Short - term solvency •
2. Activity •
3. Financial leverage •
4. Profitability •
Market value ratios • • Market price Price to earnings ratio Dividend yield Market to book value