Inequality Envy Grandiloquence Evidence Richard Roll Onassis Chairmens


")


 connection between prosperity and equality")

- Slides: 19
Inequality: Envy, Grandiloquence, Evidence Richard Roll Onassis Chairmen’s Forum Cass Business School September 15, 2015
Allegations, Corrections, Consequences Allegation: Income and wealth inequality has grown dramatically over the past few decades Super rich are particular beneficiaries and are undeserving (envy) Advocated Corrections: Income taxes (up to 90%) on the “rich”, (Hollande, Piketty, Krugman, …) Taxes on financial transactions Controls on compensation and on freedom of action Consequences: Existential threat to the City and other centers free market activity Possible threats to innovation, economic growth, prosperity
The Grandiloquence of Populists Income redistribution is a zero-sum game. Any action that hurts one income class helps another Data can be manipulated to make this seem valid For example, compare the percentage of each country’s total income earned by the poorest decile against the percentage of income earned by the richest decile Here are four snapshots of this plot over the past 28 years, seven years at time From World Bank Database (as are all data in this talk)
6 5 4 3 2 1 0 15 25 35 45 55 Percentage earned by highest decile 65 Percentage earned by lowest decile 5 4 3 2 1 0 35 45 55 Percentage earned by highest decile 5 4 3 2 1 0 25 35 45 55 Percentage earned by highest decile 65 2006 -2012 6 25 6 15 1999 -2005 15 Percentage earned by lowest decile 1992 -1998 65 Percentage earned by lowest decile 1985 -1991 6 5 4 3 2 1 0 15 25 35 45 55 Percentage earned by highest decile 65
Measures of Inequality But percentages of income earned by citizens in different income groups must add to 100% by construction Specious arithmetic or even tautology? Two Better (? ) indicators Average incomes of richest versus poorest groups The Gini coefficient • The favorite inequality indicator of many academics, the World Bank, and government statistical bureaus • Takes into account everyone, not just the poorest and richest • If everyone is equal, Gini=0. If one person gets everything, Gini=100%
Incomes per capita of richest and poorest deciles Income of Lowest Decile (log scale) 8 7 6 5 4 3 2 1 0 3 Income of Lowest Decile (log scale) 1992 -1998 4 5 6 7 8 Income of Highest Decile (log scale) 9 10 1999 -2005 8 7 6 5 4 3 2 1 0 3 4 5 6 7 8 Income of Highest Decile (log scale) 9 10 8 7 6 5 4 3 2 1 0 3 Income of Lowest Decile (log scale) 1985 -1991 4 5 6 7 8 Income of Highest Decile (log scale) 9 10 2006 -2012 8 7 6 5 4 3 2 1 0 3 4 5 6 7 8 Income of Highest Decile (log scale)
Explanation of the Gini Coefficient
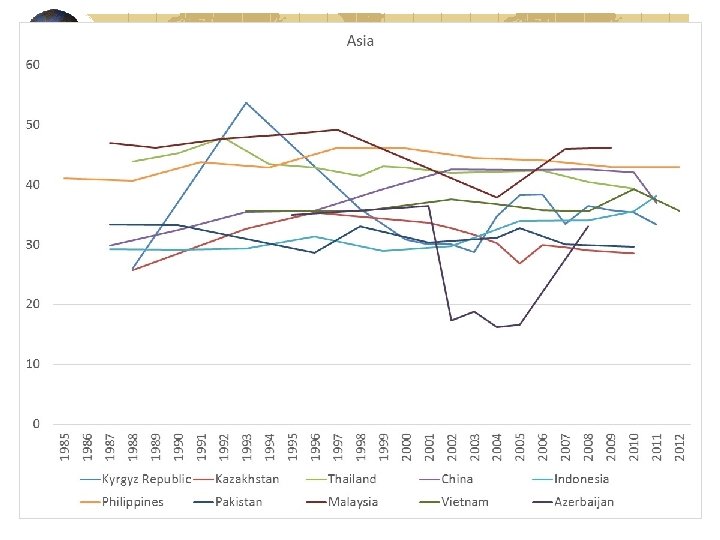
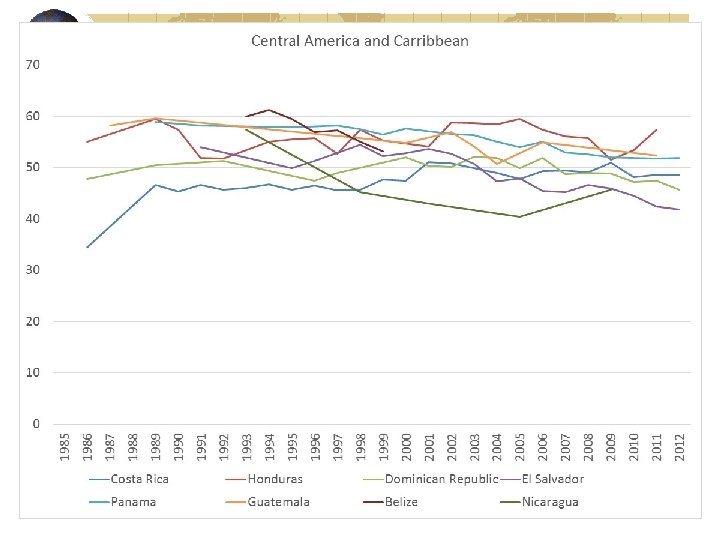
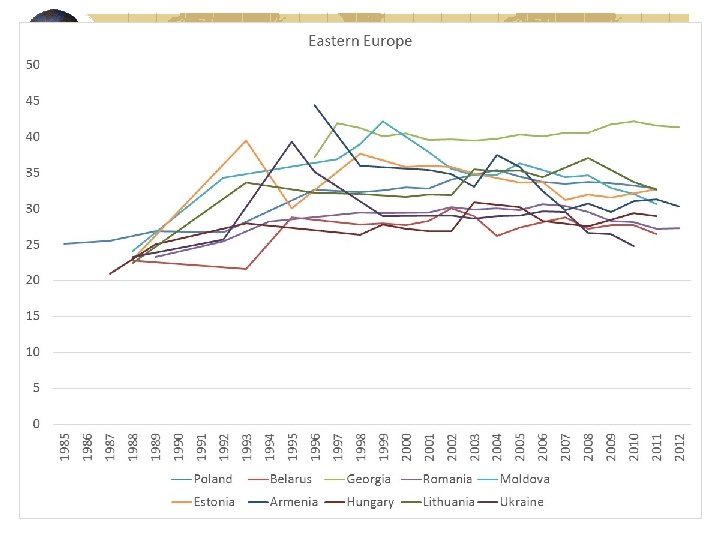
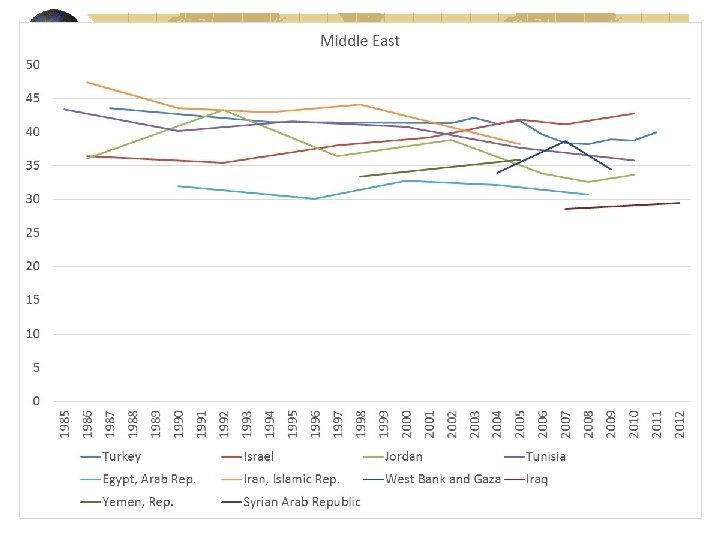
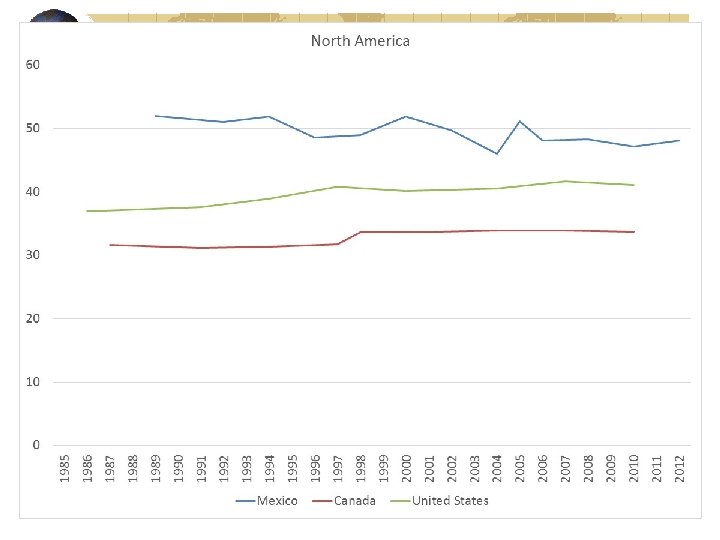
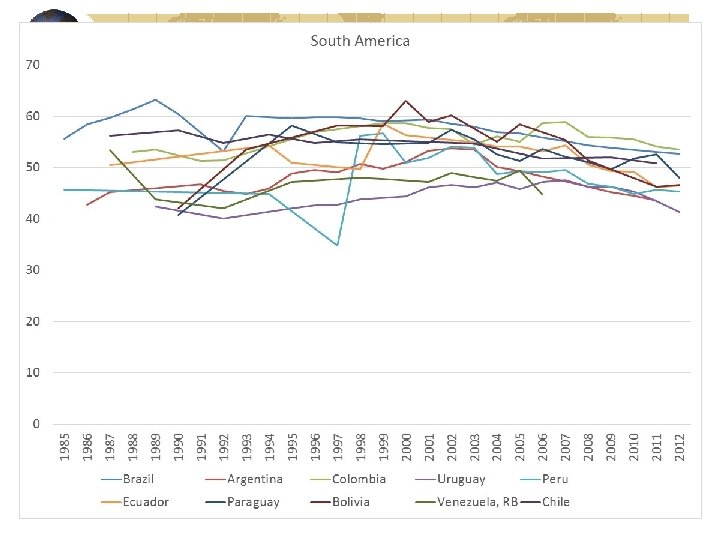
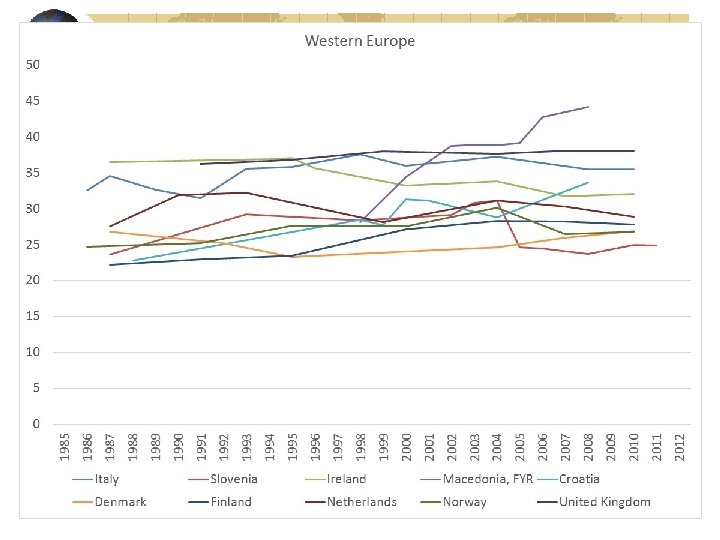
Three-decade trends in Gini by Region
Trend in Inequality The trends shown in the previous regions all seem to portray the same pattern: There is no trend in most countries Countries that were relative unequal three decades ago remain unequal, and vice versa Note that some countries, important countries such as India, have sparse information and are missing; They very well could be exceptions; (a recent Gini for India is about 34%) Richer countries are more equal, but the relation is not strong as indicated in the following graphs of Gini vs. GNI
1992 -1998 65 65 60 60 55 55 50 50 45 45 Gini 1985 -1991 40 40 35 35 30 30 25 25 20 4 5 6 7 8 9 10 11 12 20 4 GNI/Capita (log scale) 5 6 8 9 10 11 1999 -2005 70 70 65 65 60 60 55 55 50 50 Gini 7 GNI/Capita (log scale) 45 40 35 35 30 30 25 25 20 4 5 6 7 8 9 GNI/Capita (log scale) 10 11 12
The Big Puzzle There seems to be a (minor) connection between prosperity and equality Which is the cause and which the effect? Or, cum hoc ergo propter hoc; are both endogenous to other influences that are now widely accepted as causative for prosperity, such as Property rights (+) Corruption (-) Press Freedom (+) Other institutional features related to the judiciary, democracy, the monetary authority, unionization, trade barriers, etc. The populist grandiloquence does not appear to be based on evidence
Thanks for your kind attention