Improvement in Screening Radiologists Performance in an Organized

 began in 1996 • Screens")


 RAD 1 2000 7. 69 2001 6. 76 2002 5.")
")
")


- Slides: 12
Improvement in Screening Radiologists’ Performance in an Organized Screening Program Nancy A. T. Wadden, MD, FRCPC Gregory Doyle, BSc, MBA Breast Screening Program for Newfoundland Labrador Canada
Background • Breast Screening Program for Newfoundland Labrador (BSPNL) began in 1996 • Screens women 50 to 74 with mammography and clinical breast exam • Screens are biennial, annual with significant risk factors
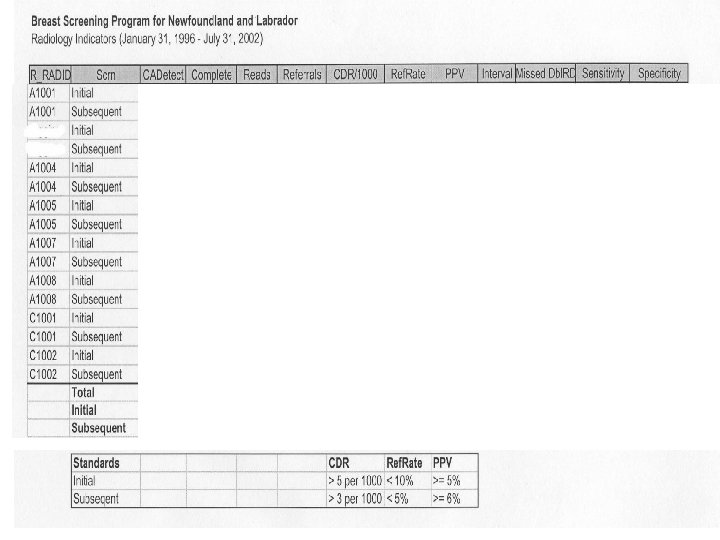
Background • Core indicators and targets for the evaluation of performance and quality of Canadian organized screening programs have been developed in 2002 • The radiologist specific indicators include: – – – – abnormal call rate (<5% 1 st screen, <10% rescn) invasive cancer detection rate (> 5 1 st, >3 rescn) positive predictive value (>= 5 1 st, >= 6 rescreen) benign to malignant open biopsy ratio benign to malignant core biopsy ratio invasive cancer tumour size node negative rate of invasive cancer
Methods • In 1998, a Radiology Review process was instituted for all screening radiologists involved with the BSPNL • All abnormal mammograms were reviewed along with work-up films • Pathology was reviewed when applicable • Screen detected cancers and post screen cancers were reviewed in relation to previous examinations if available • Beginning in 2002, on going confidential feedback was given to each screening radiologist regarding relevant indicators with objectives for improvement if necessary • Progress was reviewed quarterly
Objective • To improve the performance of screening radiologists in an organized screening program as measured by screening program indicators • All radiologists participating in screening were experienced in diagnostic mammography – Avg 13 years experience – Range 7 – 22 years
Results • At the time of the intervention, the average abnormal call rate was almost 9% • Three years after the intervention, the average abnormal call rate was less than 6% – p > 0. 0001 • Sensitivity and specificity rates also increased and interval cancer rates decreased
Radiology Referral Rates (%) RAD 1 2000 7. 69 2001 6. 76 2002 5. 98 2003 8. 66 2004 6. 32 2005 6. 61 2 6. 98 12. 31 15. 67 8. 15 5. 65 5. 30 12. 81 9. 60 9. 12 7. 45 6. 17 3 4 7. 46 7. 12 5. 82 5. 76 4. 93 5. 10 5 6. 45 10. 28 10. 21 9. 89 8. 77 5. 81 6 8. 37 5. 30 7 9. 35 8. 31 6. 69 5. 96 Average 8. 03 8. 33 8. 69 7. 76
Core Performance Indicators How can this be improved? • Abnormal call rate (<5%, <10%) – – – Feedback! Review abnormal cases More feedback! Etc!
Core Performance Indicators How can this be improved? • Abnormal call rate (<5%, <10%) – – – Feedback! Review abnormal cases More feedback! Etc!
Screening Indicators 2003 - 2004 RAD 1 2 3 4 5 6 7 Total/ Avg Ca detected Reads CDR/ 1000 Ref Rate PPV post screen cancers Post scrn /1000 reads specificity
Improving Screening Radiologists’ Performance in an Organized Screening Program • Case review rounds • Radiology/pathology review rounds • Regular review of personal and program stats every 6 months • Cross reference with Cancer Registry to detect missed and interval cancers • Ongoing CME • Intradisciplinary consultation