Implementation and Evaluation of Automatic Editing Jeroen Pannekoek

- Slides: 15
Implementation and Evaluation of Automatic Editing Jeroen Pannekoek, Mark van der Loo and Bart van den Broek
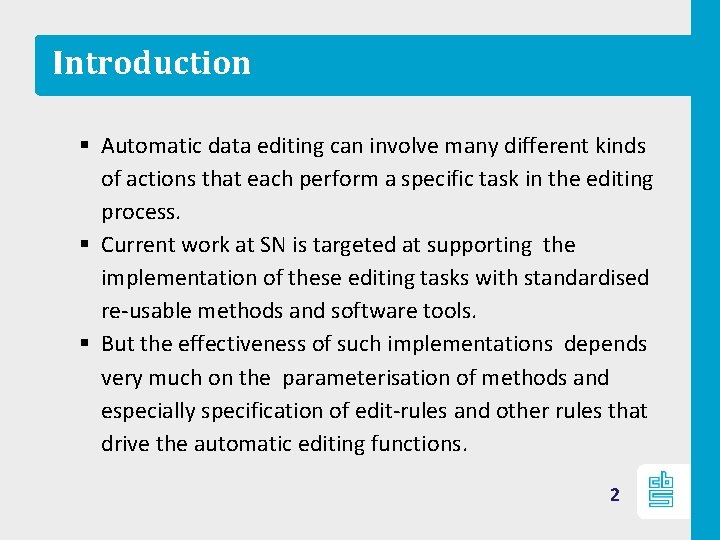
Introduction § Automatic data editing can involve many different kinds of actions that each perform a specific task in the editing process. § Current work at SN is targeted at supporting the implementation of these editing tasks with standardised re-usable methods and software tools. § But the effectiveness of such implementations depends very much on the parameterisation of methods and especially specification of edit-rules and other rules that drive the automatic editing functions. 2
This presentation • The types of rules that are input to the automatic editing • The automatic editing task or process steps Main point: • Ways of generating feetback from the automatic editing process that can help in the improvement of the configuration of the different process steps. 3
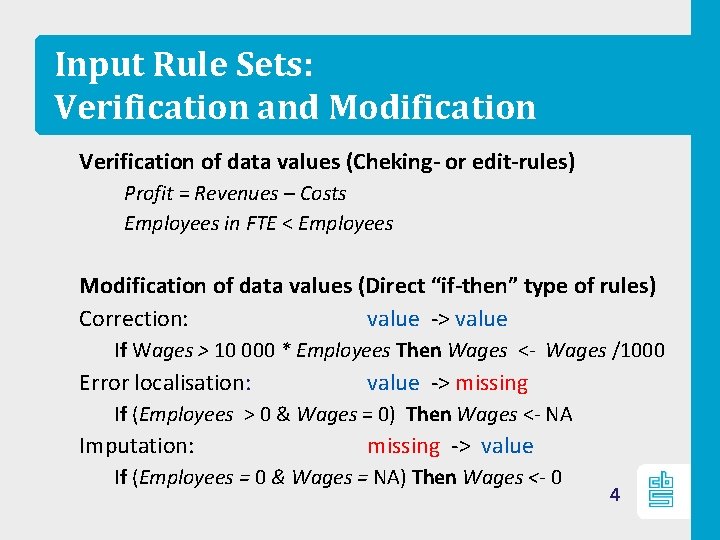
Input Rule Sets: Verification and Modification Verification of data values (Cheking- or edit-rules) Profit = Revenues – Costs Employees in FTE < Employees Modification of data values (Direct “if-then” type of rules) Correction: value -> value If Wages > 10 000 * Employees Then Wages <- Wages /1000 Error localisation: value -> missing If (Employees > 0 & Wages = 0) Then Wages <- NA Imputation: missing -> value If (Employees = 0 & Wages = NA) Then Wages <- 0 4
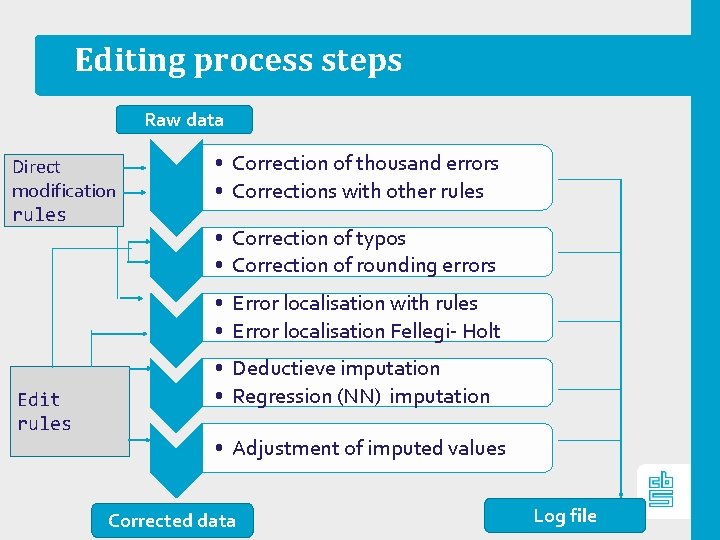
Editing process steps Raw data • Correction of thousand errors • Corrections with other rules Direct modification rules • Correction of typos • Correction of rounding errors • Error localisation with rules • Error localisation Fellegi- Holt Edit rules • Deductieve imputation • Regression (NN) imputation • Adjustment of imputed values Corrected data Log file
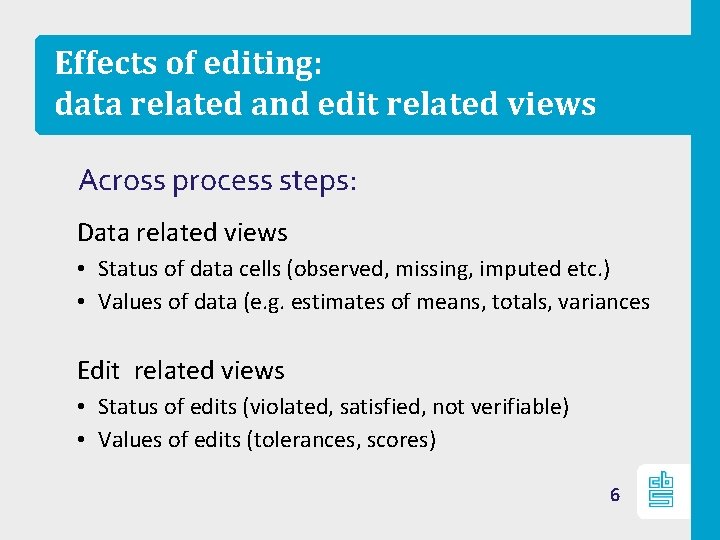
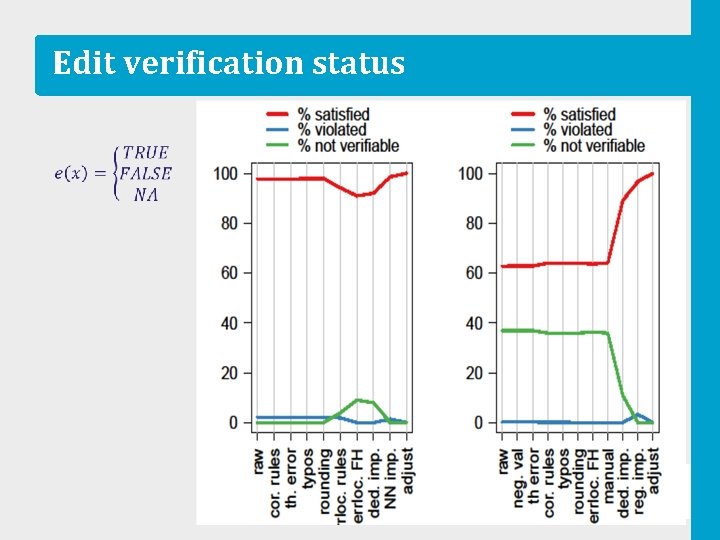
Effects of editing: data related and edit related views Across process steps: Data related views • Status of data cells (observed, missing, imputed etc. ) • Values of data (e. g. estimates of means, totals, variances Edit related views • Status of edits (violated, satisfied, not verifiable) • Values of edits (tolerances, scores) 6
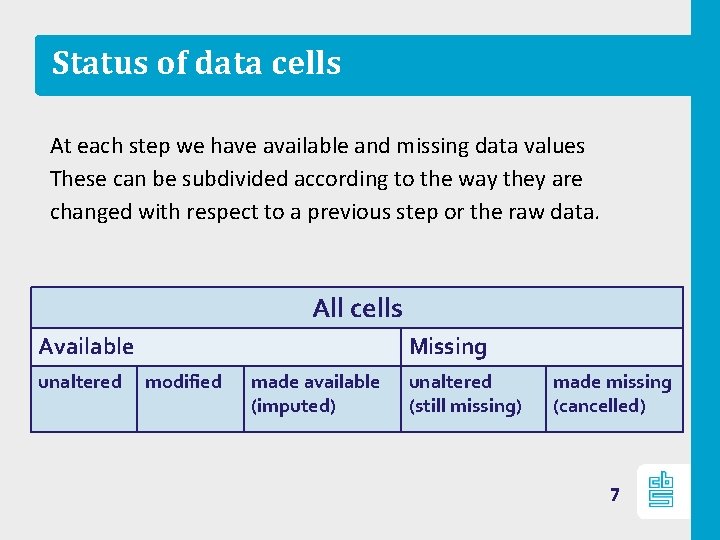
Status of data cells At each step we have available and missing data values These can be subdivided according to the way they are changed with respect to a previous step or the raw data. All cells Available unaltered Missing modified made available (imputed) unaltered (still missing) made missing (cancelled) 7
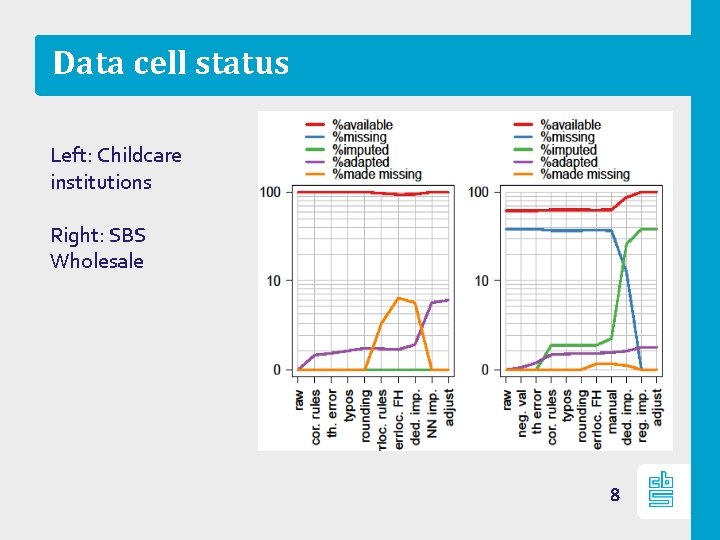
Data cell status Left: Childcare institutions Right: SBS Wholesale 8
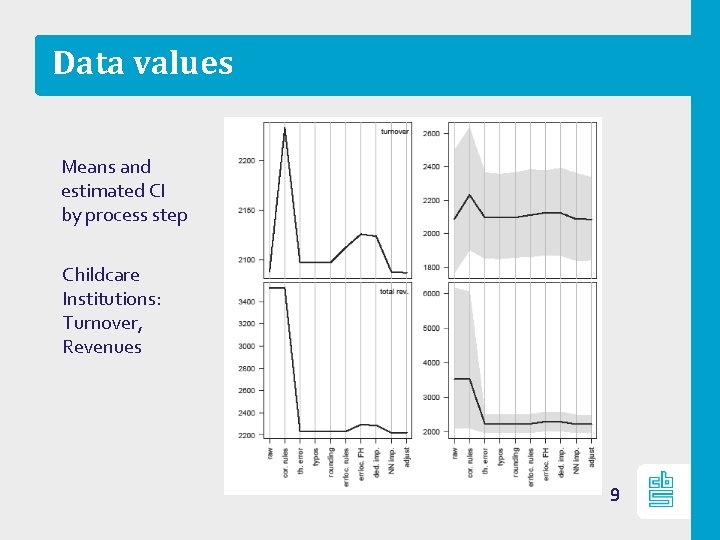
Data values Means and estimated CI by process step Childcare Institutions: Turnover, Revenues 9
Edit verification status 10
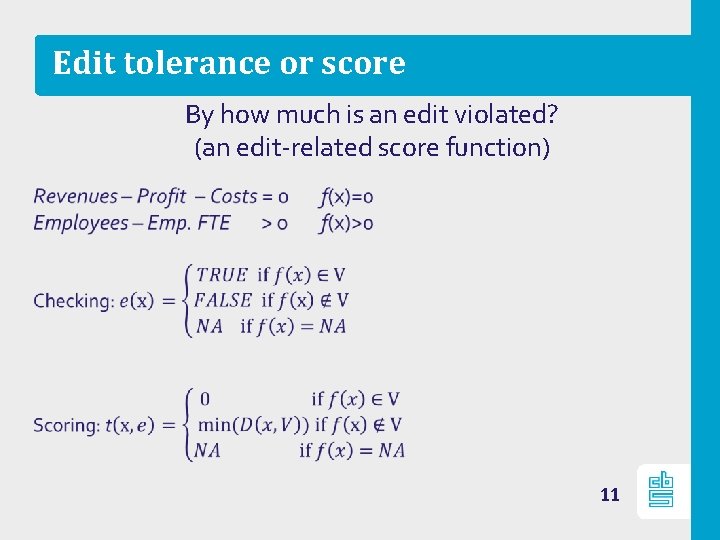
Edit tolerance or score By how much is an edit violated? (an edit-related score function) 11
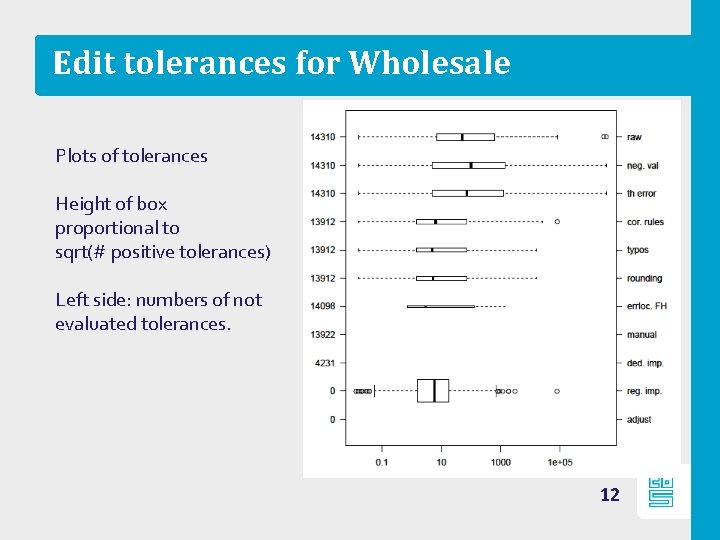
Edit tolerances for Wholesale Plots of tolerances Height of box proportional to sqrt(# positive tolerances) Left side: numbers of not evaluated tolerances. 12
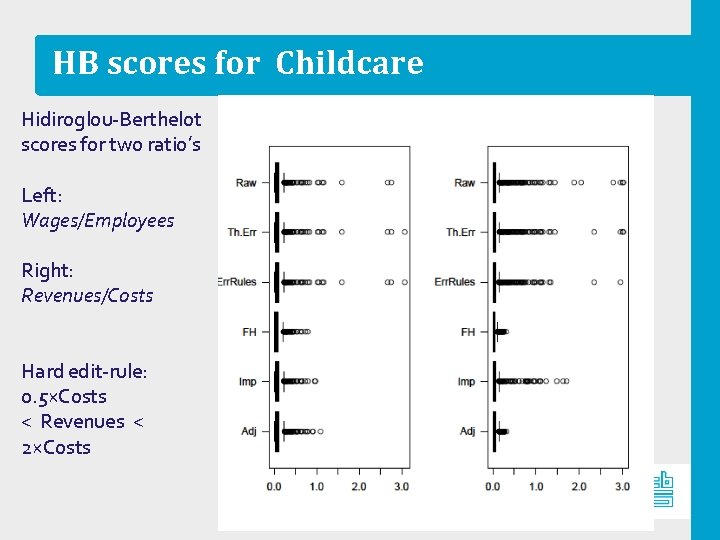
HB scores for Childcare Hidiroglou-Berthelot scores for two ratio’s Left: Wages/Employees Right: Revenues/Costs Hard edit-rule: 0. 5×Costs < Revenues < 2×Costs 13
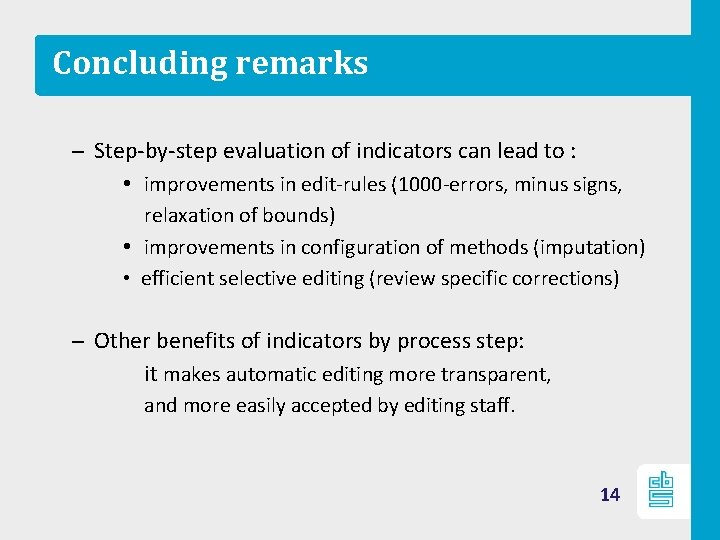
Concluding remarks – Step-by-step evaluation of indicators can lead to : • improvements in edit-rules (1000 -errors, minus signs, relaxation of bounds) • improvements in configuration of methods (imputation) • efficient selective editing (review specific corrections) – Other benefits of indicators by process step: it makes automatic editing more transparent, and more easily accepted by editing staff. 14
Concluding remarks Thank you for your attention! 15