I can see my house Aerial photography and

- Slides: 28
I can see my house! Aerial photography and planning: emerging uses in property research Dr Scott Orford School of City and Regional Planning Cardiff University Geographic Visualization across the Social Sciences: State of the Art Review Manchester 12 -13 th June 2006
Structure of presentation Traditional uses in planning ¡ Google Earth / MSN Virtual Earth ¡ Other UK data providers ¡ l l ¡ Property attribute data-gathering Increasing residential densities CAMA and council tax re-valuations (NI) Mash-ups of housing market data Conclusions
Background ¡ ¡ Long history in planning but remains underdeveloped and under-used tool Traditional uses include: l l l ¡ Photogrammetry Monitoring land cover / land use change Context But – indications that this is changing due to: l l l Digital images (better quality / data integration) More up-to-date images Improved access
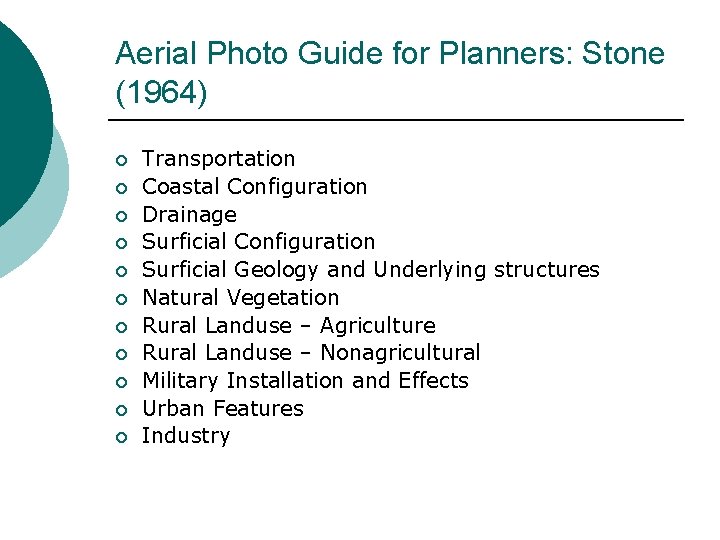
Aerial Photo Guide for Planners: Stone (1964) ¡ ¡ ¡ Transportation Coastal Configuration Drainage Surficial Configuration Surficial Geology and Underlying structures Natural Vegetation Rural Landuse – Agriculture Rural Landuse – Nonagricultural Military Installation and Effects Urban Features Industry
Google Earth ¡ ¡ ¡ Launched June 2005 (“Digital Earth” – Al Gore 1998) Hundreds of thousands of individual satellite and aerial images taken from 100+ sources (NASA’s Landsat, Digital Globe’s Quick. Bird) Urban areas – high as 6 – 12 ins (15 -30 cms) Rural areas / developing countries – 15 metre Landsat or less Refresh 18 month cycle
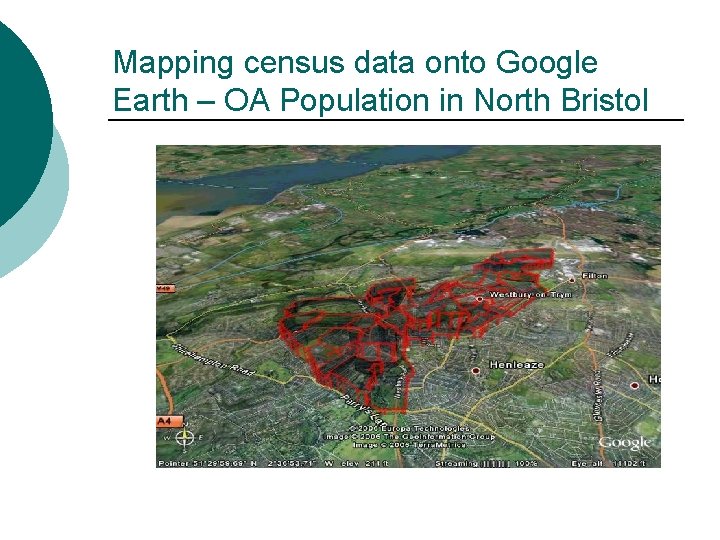
Mapping census data onto Google Earth – OA Population in North Bristol
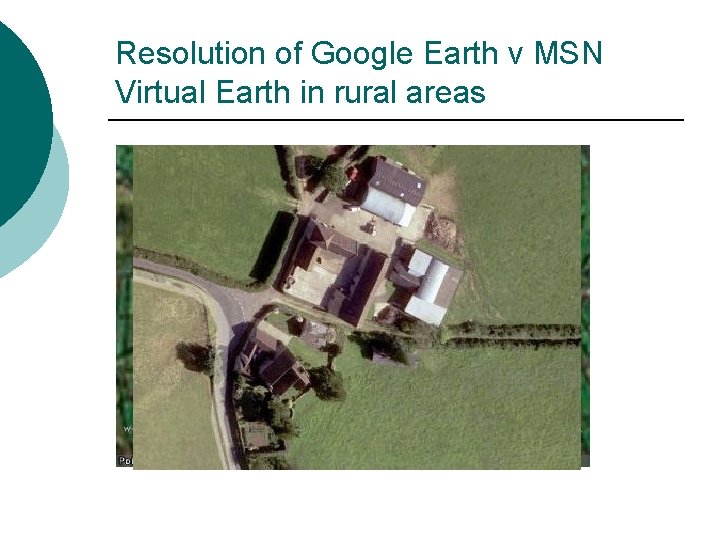
Resolution of Google Earth v MSN Virtual Earth in rural areas
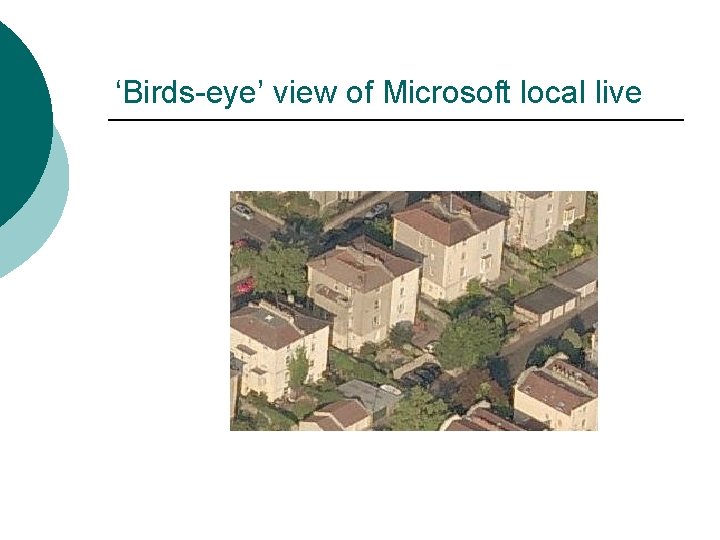
‘Birds-eye’ view of Microsoft local live
UK Perspectives Joint venture Infoterra Ltd. & Blue. Sky International Ltd. ¡ Aerial photos / DTM / DSM / Colour Infrared Imagery for England ¡ Combination 25 cm, 12. 5 cm, 10 cm resolution ¡ Accuracy +/- 1. 1 to +/- 2 metres ¡ Orthorectified ¡ 5 year rolling update programme ¡
getmapping uk ¡ ¡ ¡ ¡ England / Wales / Lowland Scotland Orthorectified aerial photographs 12. 5 cm (27 UK cities) / 25 cm accuracy +/- 1 metre Date - 1999 (Millennium Map) 3 year cycle Re-survey 25% GB 2006 Gloucestershire, Stroud and Cotswolds, S. Oxfordshire, W. Lancashire, Bedfordshire, Huntingdonshire, E. Sussex and Alnwick Idan’s Oblivision – Oblique aerial photos – 3 D visualization
Cities Revealed The Geo. Information Group ¡ Orthorectified aerial photos (mainly cities) UK, Europe, Asia, Africa ¡ 25 cm or greater resolution (5 cm London) ¡ 62% GB population ¡ City. Pack – modern and historic photos (1940 s / 1950 s) and other landuse and GIS data ¡
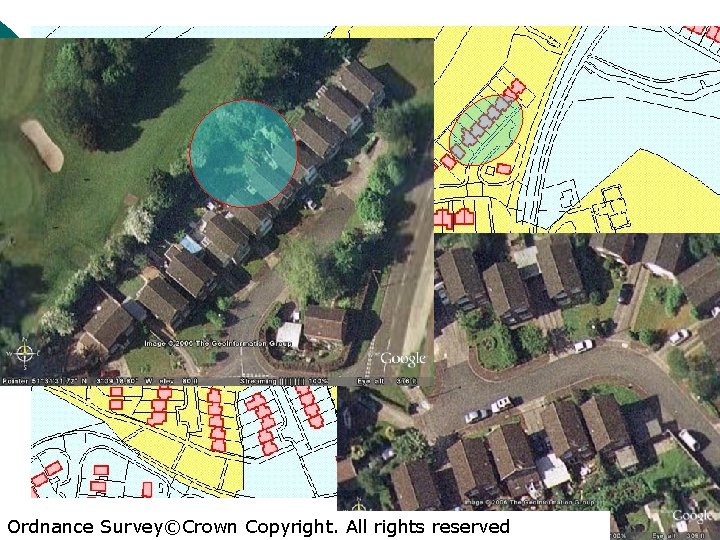
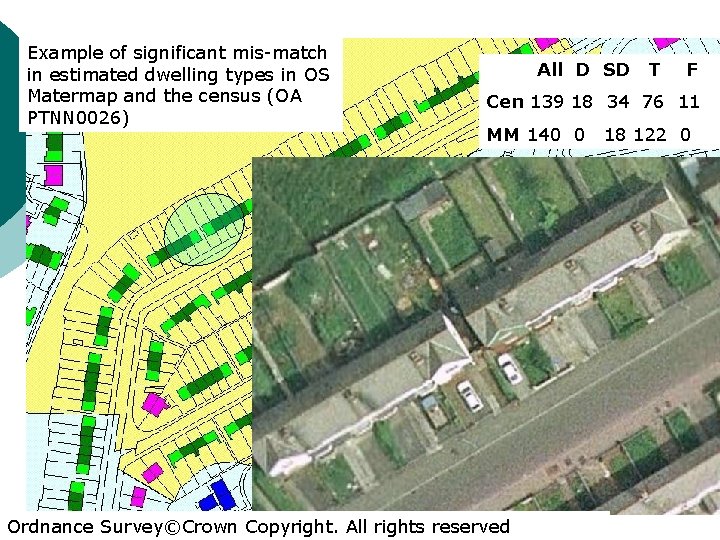
Property attribute data collection ¡ High-resolution aerial photography can provide a number of property attributes of individual dwellings and can be used to enhance existing data sources ¡ Useful where very little data exists (developing world) ¡ In conjunction with OS Mastermap it can provide information on the dwelling type of individual properties. ¡ Very effective in rural and sparsely populated areas ¡ Unreported improvements, such as a new garage.
Ordnance Survey©Crown Copyright. All rights reserved
Automated building extraction ¡ ¡ Automated building extraction – cartography, urban planning and visualisation of cities Aerial photographs to extract 3 D building wire-frames (4) Roof boundary extraction (Elasksher, et al. 2003) – OS Mastermap and Li. DAR data (UK)
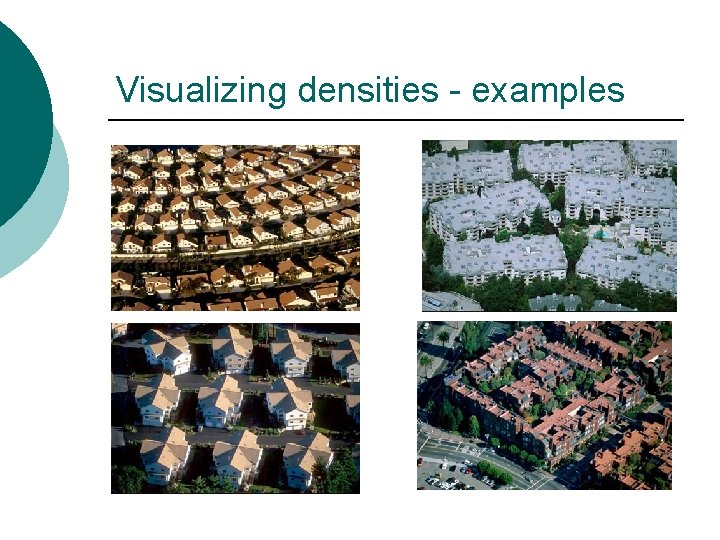
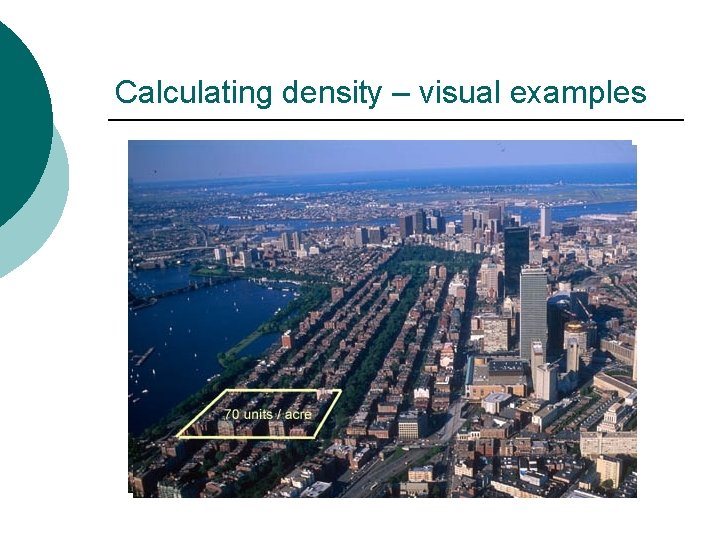
Increasing residential densities “Above and Beyond” Campoli, Mac. Lean & Humstone, (2003) ¡ Charting urban sprawl in the US ¡ Public fear of increasing residential density (overcrowding) ¡ “Visualizing Density” – Lincoln Institute of Land Policy ¡ Pre-occupation with numbers and lack of visual information ¡
Visualizing densities - examples
Calculating density – visual examples
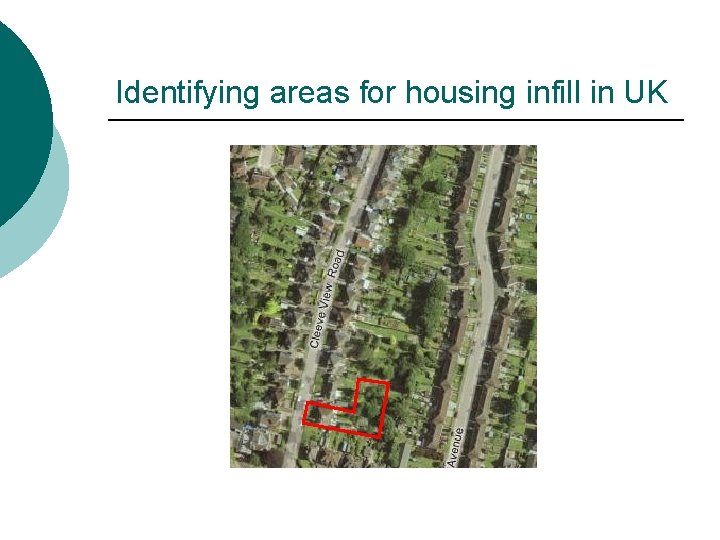
Identifying areas for housing infill in UK
Controversy in the UK? ¡ “Labour use a ‘spy in the sky’ to target your back garden” (Daily Express Monday May 29 th 2006 p. 9) ¡ Brownfield development – increasing densities ¡ Planning & Compulsory Purchase Act (2004) - gardens over 30 metres (99 ft) long could be earmarked. ¡ “Ruth Kelly is creating a database of every garden in the country to help cram more development into suburban communities, regardless of local opinion” Caroline Spelmen MP, Conservative Secretary of State for Local Government, 2006.
NI Valuation and Lands Agency (VLA) – revaluating local taxation ¡ ¡ ¡ ¡ NI Council tax – introduce April 2007. Initial valuation list published June 2006 700, 000 homes across NI Collation, validation and analysis using Computer Assisted Mass Appraisal (CAMA) – first time in UK CAMA – world recognised approach to mass evaluation for property tax purposes Includes aerial photographs Initial valuations verified by local valuer Up-dating domestic property attribute data at same time Collaboration with ESRI Ireland to provide GIS
Political reactions to using aerial photography in council tax re-banding ¡ “It’s ludicrous. It’s not only a waste of resources, it’s a shockingly disproportionate interference with people’s privacy” Shami Chakrabarti, director of Liberty, 2006 ¡ “Northern Ireland is now being used as a testing ground, from the trial of the Big Brother computer database to the levying of a new house price tax, to the use of ‘spies in the sky’ to peer down at home extensions and gardens …. using aerial photography to invade people’s privacy and lay the ground for a new stealth tax on home improvements” Caroline Spelmen MP, 2006.
Diane Leggo: VOA’s director of council tax ¡ ¡ ¡ “aerial photography and photogrammetry matched with geographical positioning systems … allow significant data-gathering without inspections” “The Valuation Office Agency does not currently use aerial or satellite photography for valuation purposes. “ "Any decision to make use of aerial photographs in the future would only be taken if this represented a sensible and cost-effective way of confirming property characteristics and the photos were already in the public domain. "
A problem of privacy? ¡ “Labour have England’s gardens in their sights and they’ll either tax them or concrete over them. ” Caroline Spelmen MP, 2006 ¡ “People might object to a picture of their house being freely available” New Scientist, 13 th August 2005, p. 29
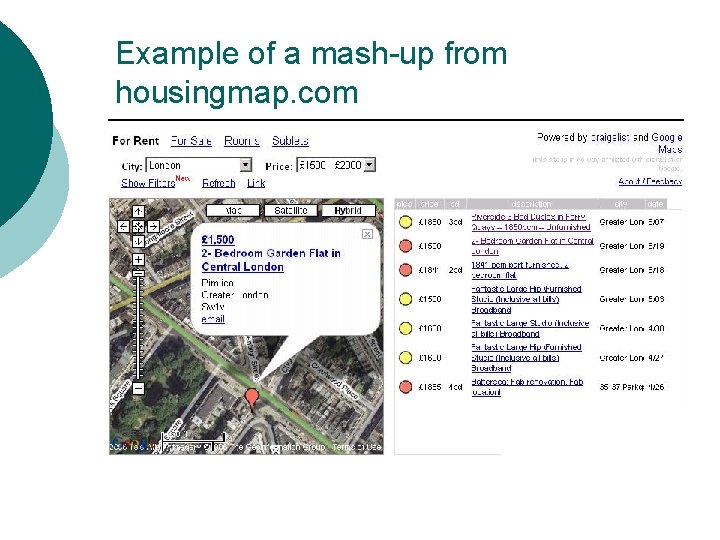
Neighbourhood mash-ups and housing market transactions Internet-based neighbourhood information systems (IBNIS) ¡ Rightmove. co. uk, Housingmaps. com, streetmap. co. uk ¡ House sale details on-line together with neighbourhood ‘images’ / ‘portraits’ ¡ “entirely plausible that members of the public will be motivated to ‘sort themselves out’” Burrows, et al. (2005) ¡
Example of a mash-up from housingmap. com
Some issues with internet-based aerial photography ¡ Accuracy of images (e. g. Apple HQ) l l ¡ ¡ Resolution (urban v rural) Currency Mis-interpretation Inappropriate uses Privacy issues Confidentiality issues (disclosure)
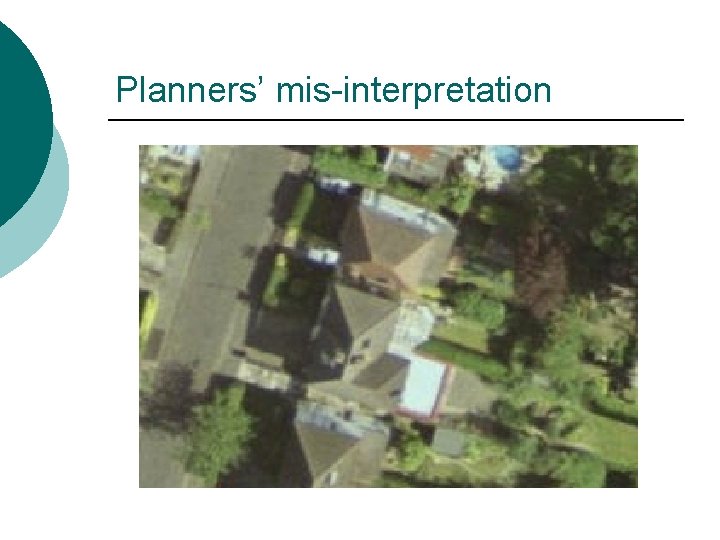
Planners’ mis-interpretation
Example of significant mis-match in estimated dwelling types in OS Matermap and the census (OA PTNN 0026) All D SD T F Cen 139 18 34 76 11 MM 140 0 Ordnance Survey©Crown Copyright. All rights reserved 18 122 0