https xkcd com1775 Properties COMP 309 DIMENSIONALITY REDUCTION
- Slides: 23
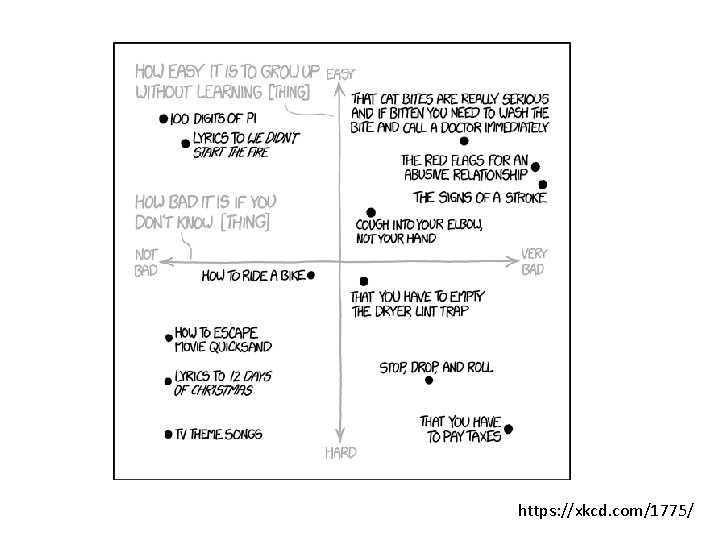
https: //xkcd. com/1775/
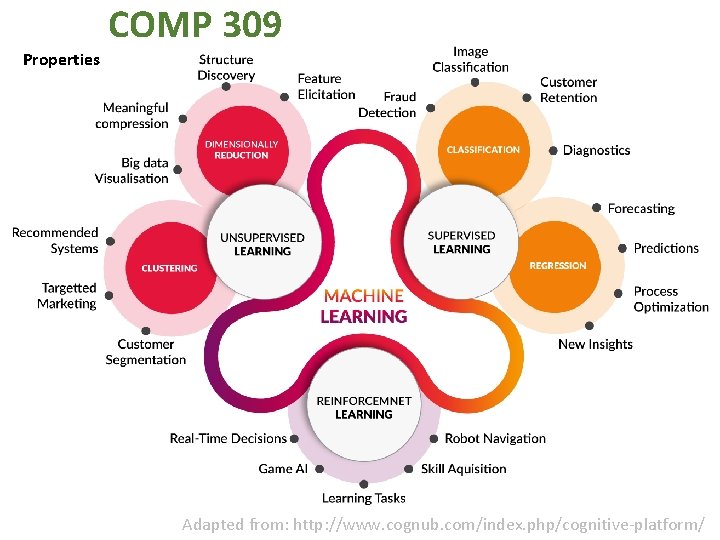
Properties COMP 309 DIMENSIONALITY REDUCTION CLUSTERING CLASSIFICATION UNSUPERVISED LEARNING REGRESSION REINFORCEMENT LEARNING ROBOTICS GAME AI Adapted from: http: //www. cognub. com/index. php/cognitive-platform/
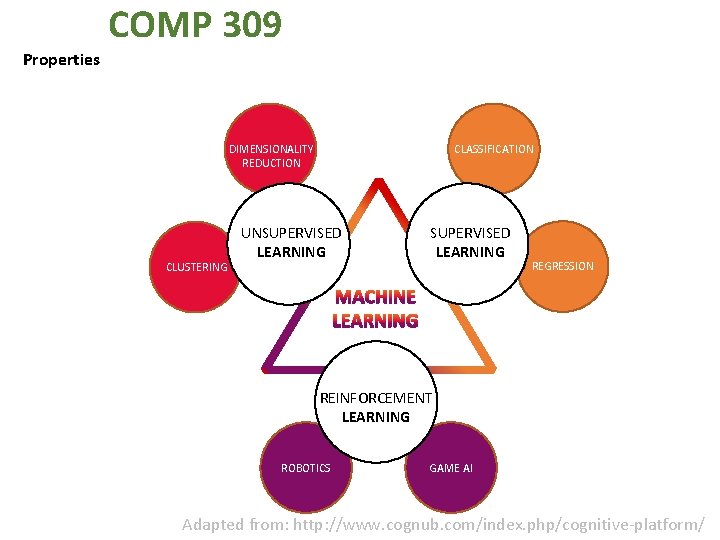
Properties COMP 309 DIMENSIONALITY REDUCTION CLUSTERING CLASSIFICATION UNSUPERVISED LEARNING REGRESSION REINFORCEMENT LEARNING ROBOTICS GAME AI Adapted from: http: //www. cognub. com/index. php/cognitive-platform/
Classification – Why? Agent survival depends on classifying what to do with input data. Pattern recognition: The act of taking in raw data and making an action based on the "category" of the pattern. [Duda et al. ] Classification: The recognition process by which objects can be identified, differentiated and understood. Observations: An object (tangible or intangible) is observed to create an instance with characteristics (features). When the observations include the category, then supervised learning can occur.
Classification – Purpose Wish to build a model, interrogate it and then use it for prediction. Understanding: Identify any redundant/irrelevant features, feature importance and feature relationships to provide insight into the object. • Observations (examples, samples, tuples) in the training set are used for model construction • Models can be rules, decision trees, networks, . . . Prediction: Given past data, construct a model such that a new observation (without its associated category) can be classified. • Estimate the worth of the model, e. g. accuracy • Test set independent of the training set (else overfitting) • If a dataset is used to select/tune models, it is called a validation set
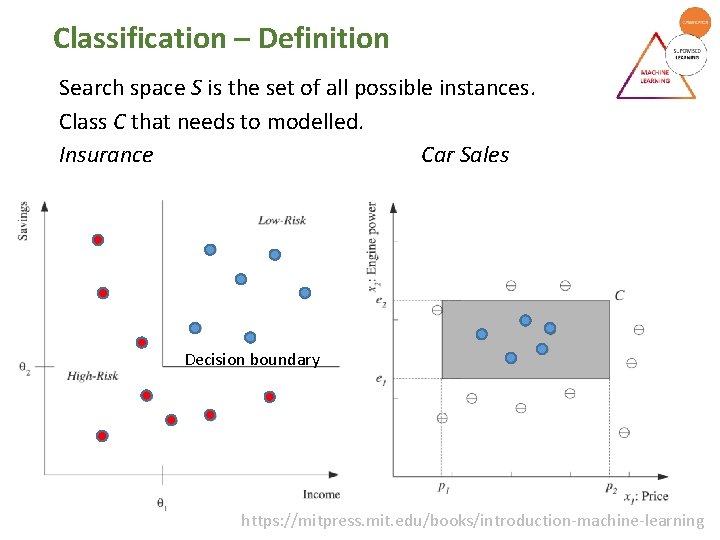
Classification – Definition Search space S is the set of all possible instances. Class C that needs to modelled. Insurance Car Sales Decision boundary https: //mitpress. mit. edu/books/introduction-machine-learning
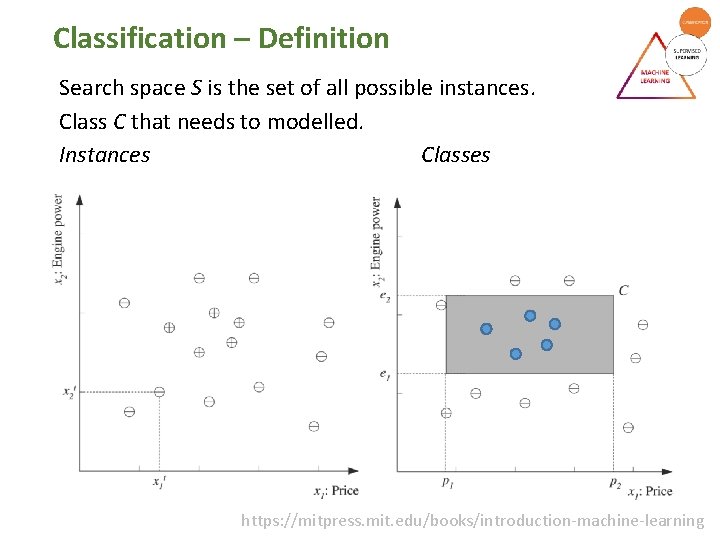
Classification – Definition Search space S is the set of all possible instances. Class C that needs to modelled. Instances Classes https: //mitpress. mit. edu/books/introduction-machine-learning
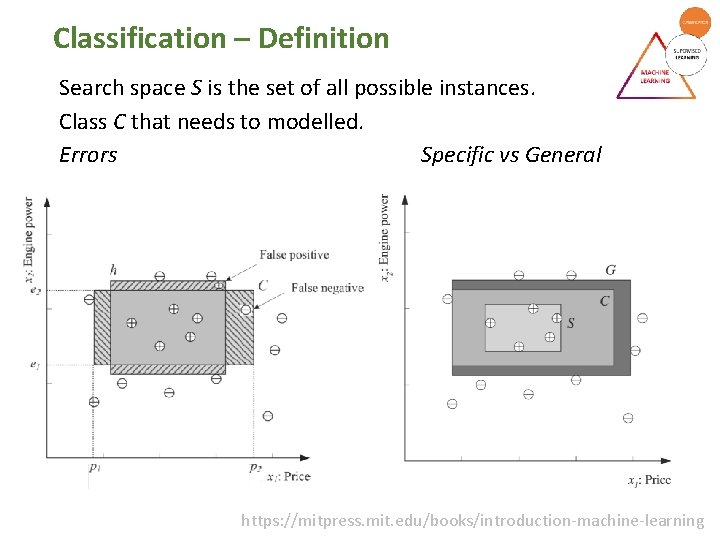
Classification – Definition Search space S is the set of all possible instances. Class C that needs to modelled. Errors Specific vs General https: //mitpress. mit. edu/books/introduction-machine-learning
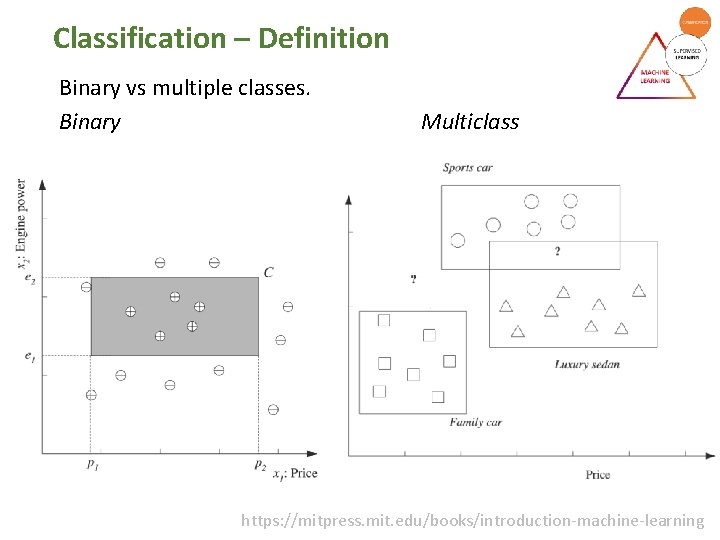
Classification – Definition Binary vs multiple classes. Binary Multiclass https: //mitpress. mit. edu/books/introduction-machine-learning
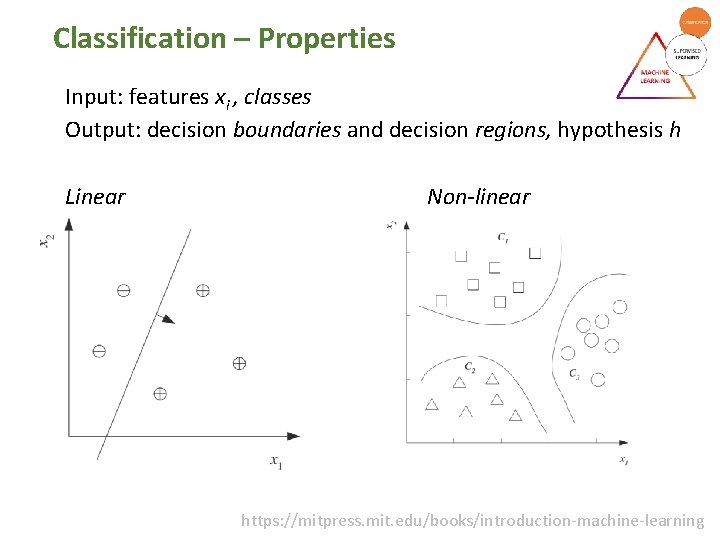
Classification – Properties Input: features xi , classes Output: decision boundaries and decision regions, hypothesis h Linear Non-linear https: //mitpress. mit. edu/books/introduction-machine-learning
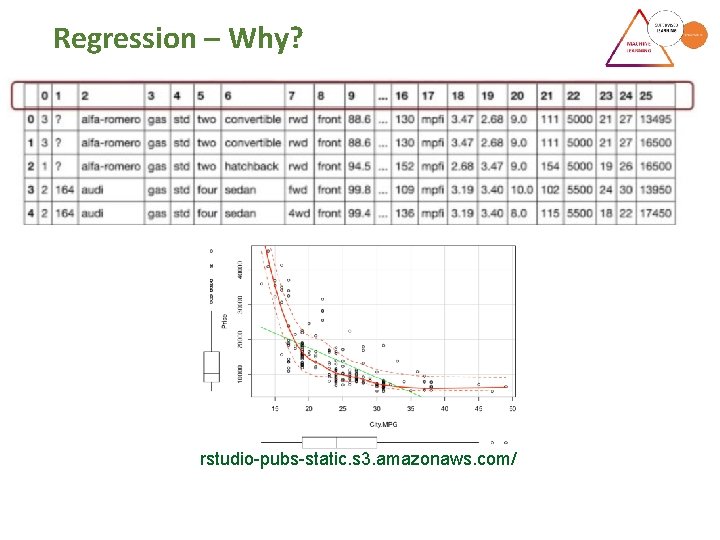
Regression – Why? rstudio-pubs-static. s 3. amazonaws. com/
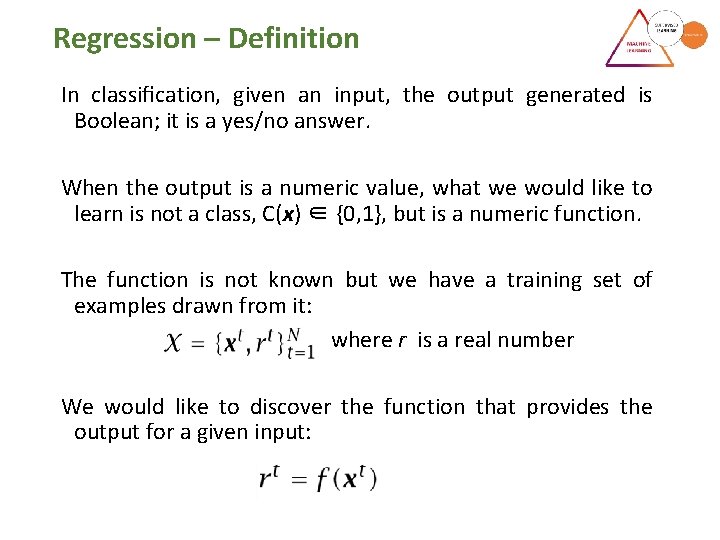
Regression – Definition In classification, given an input, the output generated is Boolean; it is a yes/no answer. When the output is a numeric value, what we would like to learn is not a class, C(x) ∈ {0, 1}, but is a numeric function. The function is not known but we have a training set of examples drawn from it: where r is a real number We would like to discover the function that provides the output for a given input:
Regression – Definition In polynomial interpolation, given N points, we find the (N− 1)st degree polynomial that we can use to predict the output for any x. This is called extrapolation if x is outside of the range of xt in the training set. In extrapolation time-series prediction, for example, we have data up to the present and we want to predict the value for the future. Note: regression does not need to be linear or fit a polynomial. It can also be piecewise by splitting the range.
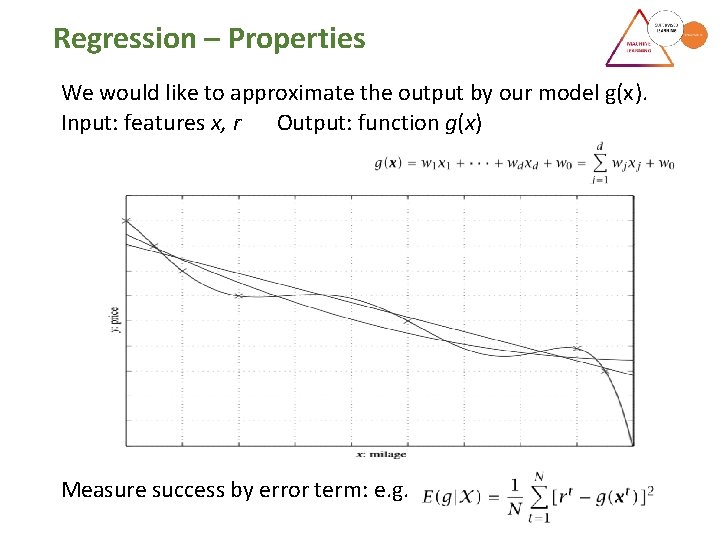
Regression – Properties We would like to approximate the output by our model g(x). Input: features x, r Output: function g(x) Measure success by error term: e. g.
Clustering – Why? Clustering groups a set of objects in an unsupervised manner. Features of objects within a cluster are more similar to each other on a given measure, than to objects outside of the cluster. Intra-class: Similarity between instances of the same class Inter-class: Distance between classes. Observations: An object (tangible or intangible) is observed to create an instance with characteristics (features). Applications include ecology, medicine (epidemiology), computer graphics, security and so forth.
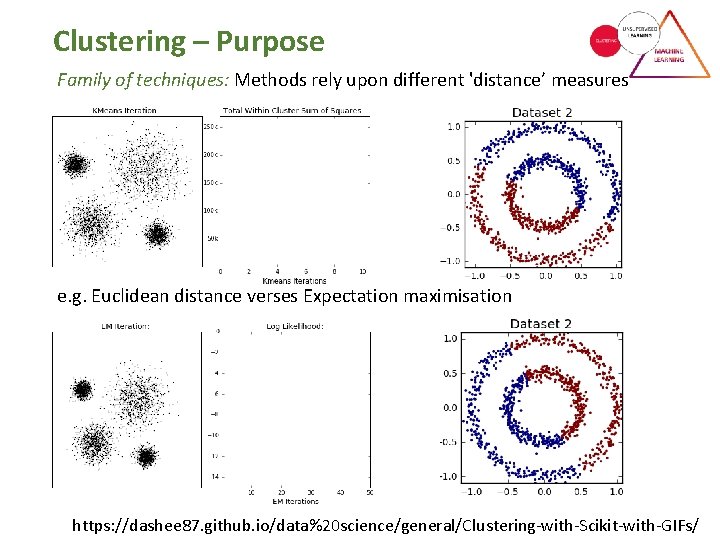
Clustering – Purpose Family of techniques: Methods rely upon different 'distance’ measures e. g. Euclidean distance verses Expectation maximisation https: //dashee 87. github. io/data%20 science/general/Clustering-with-Scikit-with-GIFs/
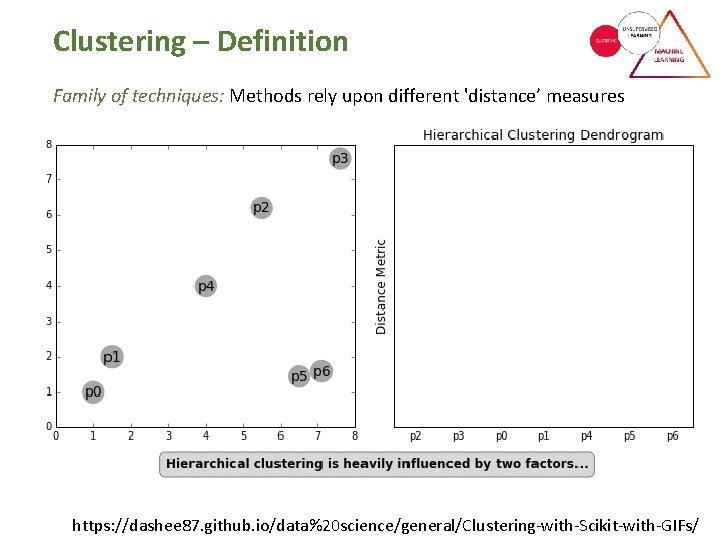
Clustering – Definition Family of techniques: Methods rely upon different 'distance’ measures https: //dashee 87. github. io/data%20 science/general/Clustering-with-Scikit-with-GIFs/
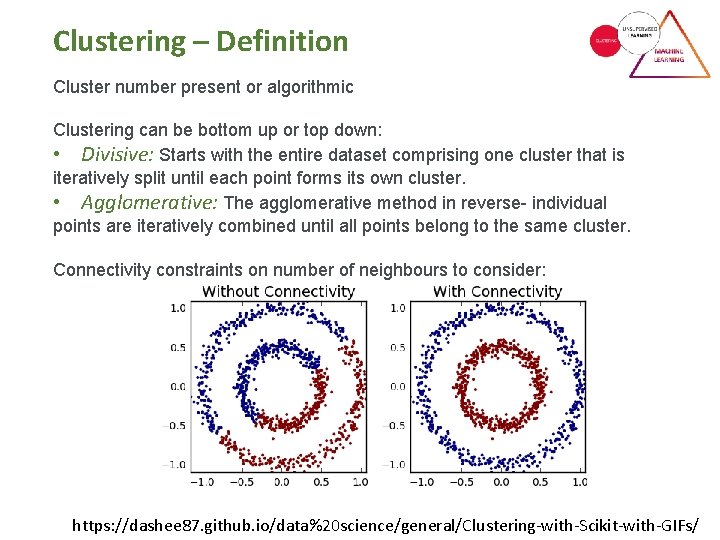
Clustering – Definition Cluster number present or algorithmic Clustering can be bottom up or top down: • Divisive: Starts with the entire dataset comprising one cluster that is iteratively split until each point forms its own cluster. • Agglomerative: The agglomerative method in reverse- individual points are iteratively combined until all points belong to the same cluster. Connectivity constraints on number of neighbours to consider: https: //dashee 87. github. io/data%20 science/general/Clustering-with-Scikit-with-GIFs/
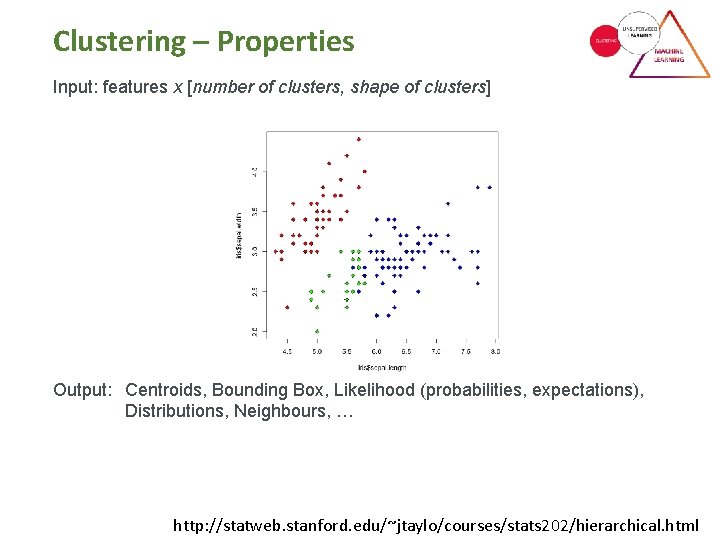
Clustering – Properties Input: features x [number of clusters, shape of clusters] Output: Centroids, Bounding Box, Likelihood (probabilities, expectations), Distributions, Neighbours, … http: //statweb. stanford. edu/~jtaylo/courses/stats 202/hierarchical. html
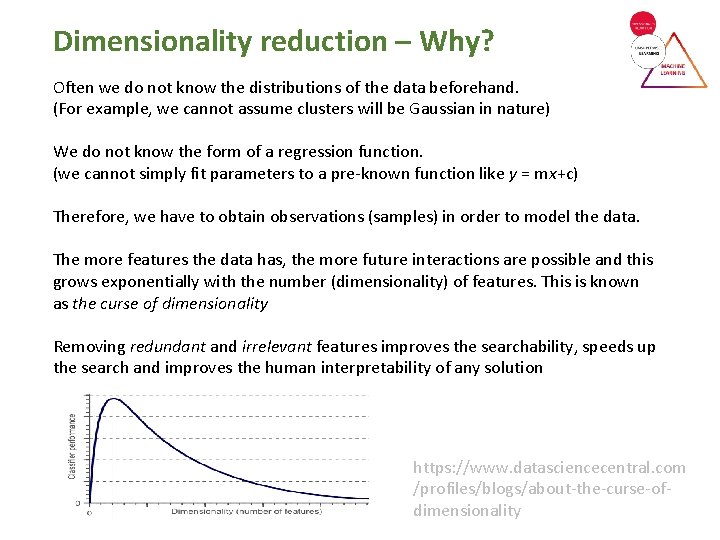
Dimensionality reduction – Why? Often we do not know the distributions of the data beforehand. (For example, we cannot assume clusters will be Gaussian in nature) We do not know the form of a regression function. (we cannot simply fit parameters to a pre-known function like y = mx+c) Therefore, we have to obtain observations (samples) in order to model the data. The more features the data has, the more future interactions are possible and this grows exponentially with the number (dimensionality) of features. This is known as the curse of dimensionality Removing redundant and irrelevant features improves the searchability, speeds up the search and improves the human interpretability of any solution https: //www. datasciencecentral. com /profiles/blogs/about-the-curse-ofdimensionality
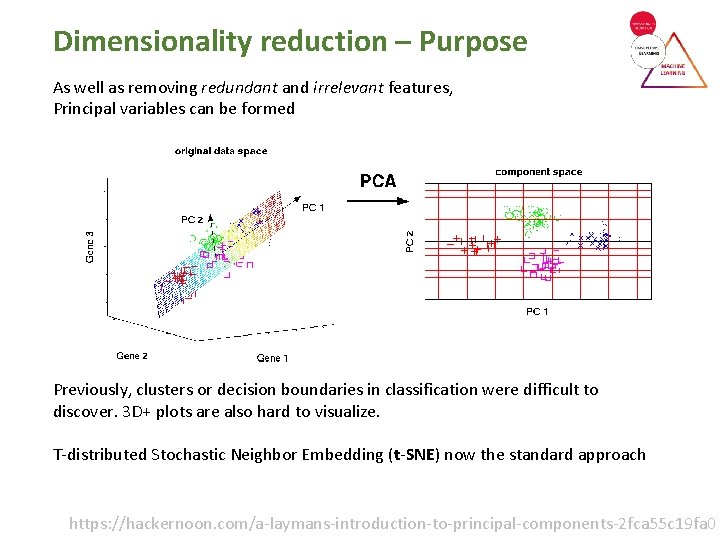
Dimensionality reduction – Purpose As well as removing redundant and irrelevant features, Principal variables can be formed Previously, clusters or decision boundaries in classification were difficult to discover. 3 D+ plots are also hard to visualize. T-distributed Stochastic Neighbor Embedding (t-SNE) now the standard approach https: //hackernoon. com/a-laymans-introduction-to-principal-components-2 fca 55 c 19 fa 0
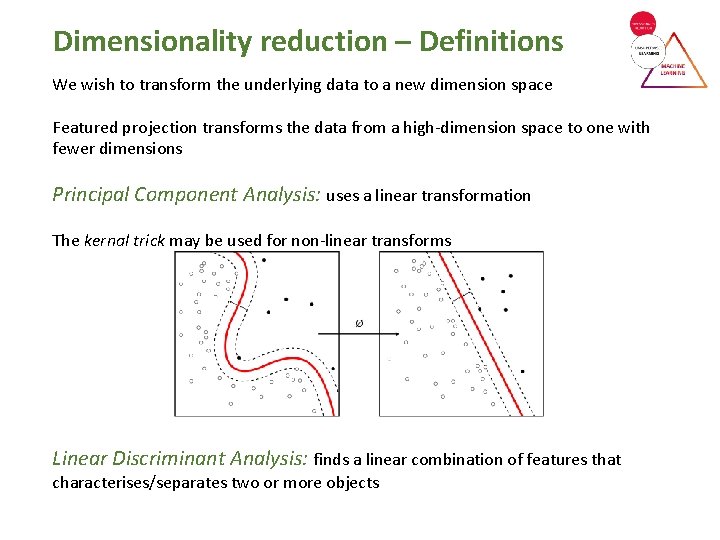
Dimensionality reduction – Definitions We wish to transform the underlying data to a new dimension space Featured projection transforms the data from a high-dimension space to one with fewer dimensions Principal Component Analysis: uses a linear transformation The kernal trick may be used for non-linear transforms Linear Discriminant Analysis: finds a linear combination of features that characterises/separates two or more objects
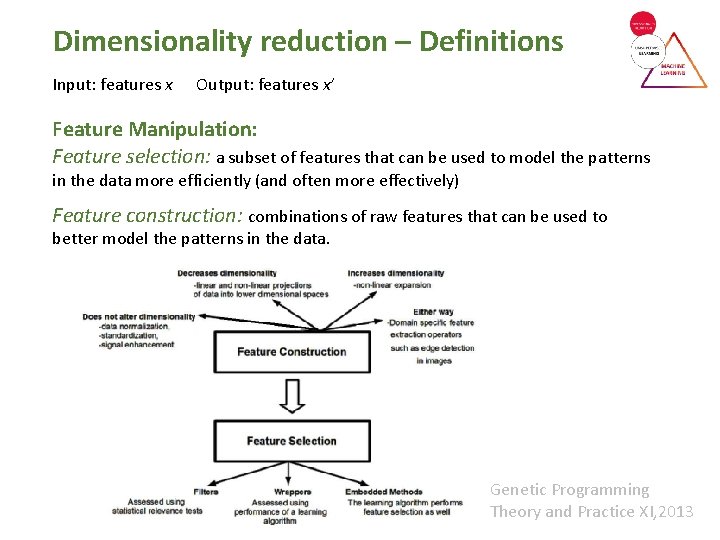
Dimensionality reduction – Definitions Input: features x Output: features x’ Feature Manipulation: Feature selection: a subset of features that can be used to model the patterns in the data more efficiently (and often more effectively) Feature construction: combinations of raw features that can be used to better model the patterns in the data. Genetic Programming Theory and Practice XI, 2013