HPSEE Valgrind Usage www hpsee eu Josip Jaki

![Cachegrind usage (2/2) [josipjakic@ui Valgrind]$ gcc -O 2 -g -o loops-fast. c [josipjakic@ui Valgrind]$ Cachegrind usage (2/2) [josipjakic@ui Valgrind]$ gcc -O 2 -g -o loops-fast. c [josipjakic@ui Valgrind]$](https://slidetodoc.com/presentation_image_h2/944aa74a24e495eb3b256d17be371c1c/image-14.jpg)
![Callgrind usage (1/3) [josipjakic@ui Valgrind]$ valgrind --tool=callgrind --simulate-cache=yes. /loops-fast ==19141== Callgrind, a call-graph generating Callgrind usage (1/3) [josipjakic@ui Valgrind]$ valgrind --tool=callgrind --simulate-cache=yes. /loops-fast ==19141== Callgrind, a call-graph generating](https://slidetodoc.com/presentation_image_h2/944aa74a24e495eb3b256d17be371c1c/image-16.jpg)
- Slides: 20

HP-SEE Valgrind Usage www. hp-see. eu Josip Jakić Scientific Computing Laboratory Institute of Physics Belgrade josipjakic@ipb. ac. rs The HP-SEE initiative is co-funded by the European Commission under the FP 7 Research Infrastructures contract no. 261499

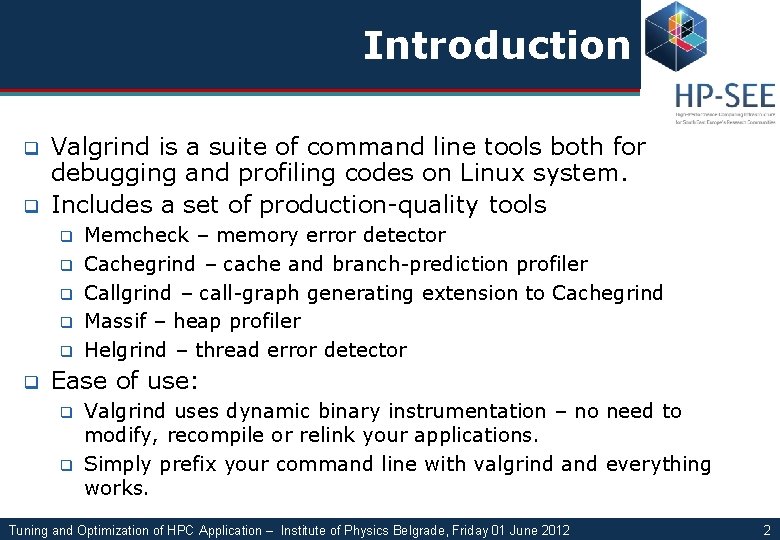
Introduction q q Valgrind is a suite of command line tools both for debugging and profiling codes on Linux system. Includes a set of production-quality tools q q q Memcheck – memory error detector Cachegrind – cache and branch-prediction profiler Callgrind – call-graph generating extension to Cachegrind Massif – heap profiler Helgrind – thread error detector Ease of use: q q Valgrind uses dynamic binary instrumentation – no need to modify, recompile or relink your applications. Simply prefix your command line with valgrind and everything works. Tuning and Optimization of HPC Application – Institute of Physics Belgrade, Friday 01 June 2012 2

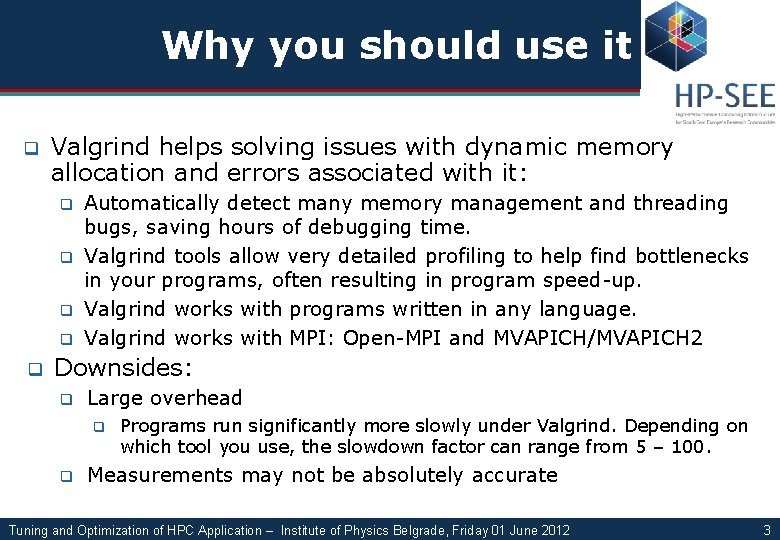
Why you should use it q Valgrind helps solving issues with dynamic memory allocation and errors associated with it: q q q Automatically detect many memory management and threading bugs, saving hours of debugging time. Valgrind tools allow very detailed profiling to help find bottlenecks in your programs, often resulting in program speed-up. Valgrind works with programs written in any language. Valgrind works with MPI: Open-MPI and MVAPICH/MVAPICH 2 Downsides: q Large overhead q q Programs run significantly more slowly under Valgrind. Depending on which tool you use, the slowdown factor can range from 5 – 100. Measurements may not be absolutely accurate Tuning and Optimization of HPC Application – Institute of Physics Belgrade, Friday 01 June 2012 3

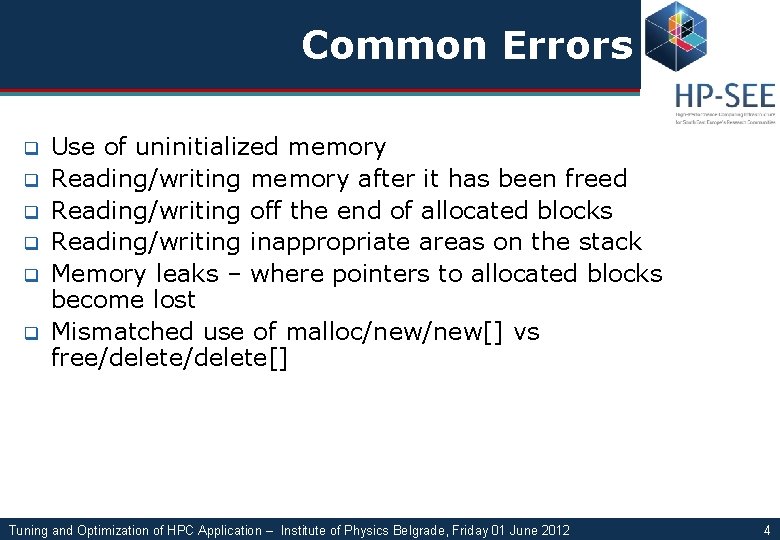
Common Errors q q q Use of uninitialized memory Reading/writing memory after it has been freed Reading/writing off the end of allocated blocks Reading/writing inappropriate areas on the stack Memory leaks – where pointers to allocated blocks become lost Mismatched use of malloc/new[] vs free/delete[] Tuning and Optimization of HPC Application – Institute of Physics Belgrade, Friday 01 June 2012 4

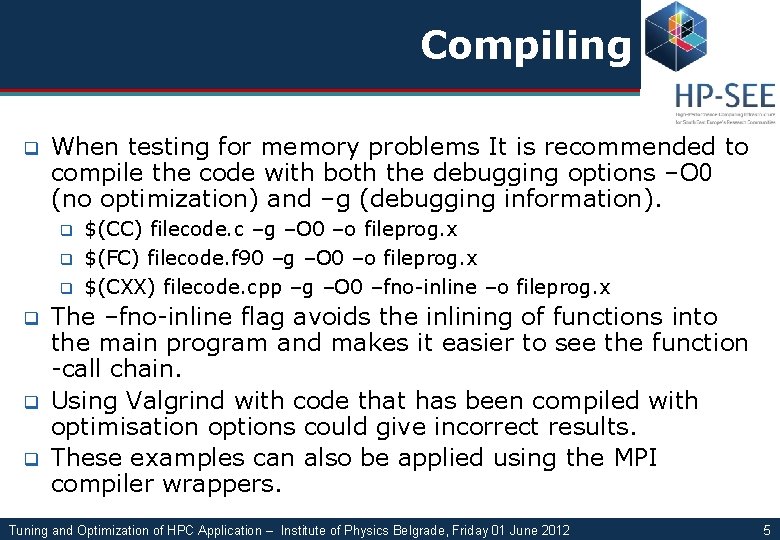
Compiling q When testing for memory problems It is recommended to compile the code with both the debugging options –O 0 (no optimization) and –g (debugging information). q q q $(CC) filecode. c –g –O 0 –o fileprog. x $(FC) filecode. f 90 –g –O 0 –o fileprog. x $(CXX) filecode. cpp –g –O 0 –fno-inline –o fileprog. x The –fno-inline flag avoids the inlining of functions into the main program and makes it easier to see the function -call chain. Using Valgrind with code that has been compiled with optimisation options could give incorrect results. These examples can also be applied using the MPI compiler wrappers. Tuning and Optimization of HPC Application – Institute of Physics Belgrade, Friday 01 June 2012 5

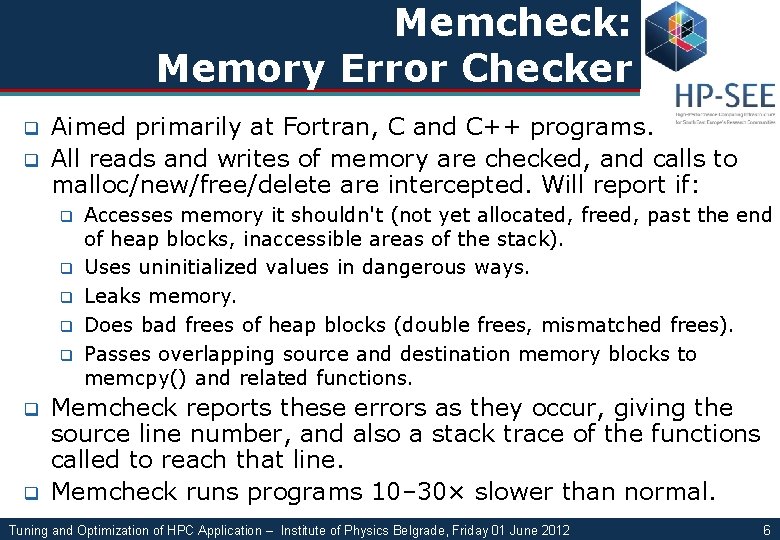
Memcheck: Memory Error Checker q q Aimed primarily at Fortran, C and C++ programs. All reads and writes of memory are checked, and calls to malloc/new/free/delete are intercepted. Will report if: q q q q Accesses memory it shouldn't (not yet allocated, freed, past the end of heap blocks, inaccessible areas of the stack). Uses uninitialized values in dangerous ways. Leaks memory. Does bad frees of heap blocks (double frees, mismatched frees). Passes overlapping source and destination memory blocks to memcpy() and related functions. Memcheck reports these errors as they occur, giving the source line number, and also a stack trace of the functions called to reach that line. Memcheck runs programs 10– 30× slower than normal. Tuning and Optimization of HPC Application – Institute of Physics Belgrade, Friday 01 June 2012 6

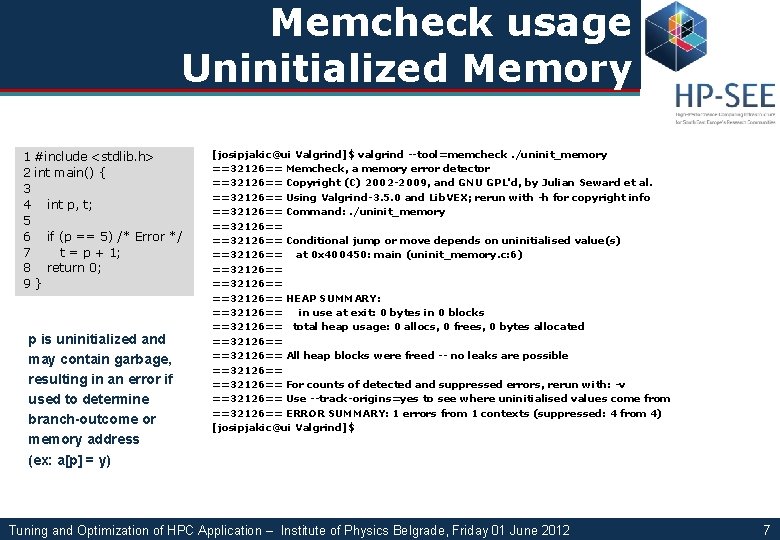
Memcheck usage Uninitialized Memory 1 #include <stdlib. h> 2 int main() { 3 4 int p, t; 5 6 if (p == 5) /* Error */ 7 t = p + 1; 8 return 0; 9} p is uninitialized and may contain garbage, resulting in an error if used to determine branch-outcome or memory address (ex: a[p] = y) [josipjakic@ui Valgrind]$ valgrind --tool=memcheck. /uninit_memory ==32126== Memcheck, a memory error detector ==32126== Copyright (C) 2002 -2009, and GNU GPL'd, by Julian Seward et al. ==32126== Using Valgrind-3. 5. 0 and Lib. VEX; rerun with -h for copyright info ==32126== Command: . /uninit_memory ==32126== Conditional jump or move depends on uninitialised value(s) ==32126== at 0 x 400450: main (uninit_memory. c: 6) ==32126== HEAP SUMMARY: ==32126== in use at exit: 0 bytes in 0 blocks ==32126== total heap usage: 0 allocs, 0 frees, 0 bytes allocated ==32126== All heap blocks were freed -- no leaks are possible ==32126== For counts of detected and suppressed errors, rerun with: -v ==32126== Use --track-origins=yes to see where uninitialised values come from ==32126== ERROR SUMMARY: 1 errors from 1 contexts (suppressed: 4 from 4) [josipjakic@ui Valgrind]$ Tuning and Optimization of HPC Application – Institute of Physics Belgrade, Friday 01 June 2012 7

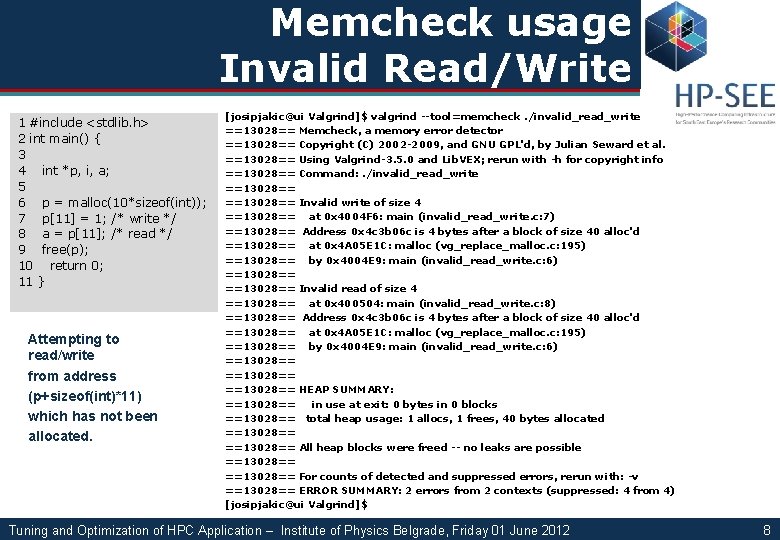
Memcheck usage Invalid Read/Write 1 #include <stdlib. h> 2 int main() { 3 4 int *p, i, a; 5 6 p = malloc(10*sizeof(int)); 7 p[11] = 1; /* write */ 8 a = p[11]; /* read */ 9 free(p); 10 return 0; 11 } Attempting to read/write from address (p+sizeof(int)*11) which has not been allocated. [josipjakic@ui Valgrind]$ valgrind --tool=memcheck. /invalid_read_write ==13028== Memcheck, a memory error detector ==13028== Copyright (C) 2002 -2009, and GNU GPL'd, by Julian Seward et al. ==13028== Using Valgrind-3. 5. 0 and Lib. VEX; rerun with -h for copyright info ==13028== Command: . /invalid_read_write ==13028== Invalid write of size 4 ==13028== at 0 x 4004 F 6: main (invalid_read_write. c: 7) ==13028== Address 0 x 4 c 3 b 06 c is 4 bytes after a block of size 40 alloc'd ==13028== at 0 x 4 A 05 E 1 C: malloc (vg_replace_malloc. c: 195) ==13028== by 0 x 4004 E 9: main (invalid_read_write. c: 6) ==13028== Invalid read of size 4 ==13028== at 0 x 400504: main (invalid_read_write. c: 8) ==13028== Address 0 x 4 c 3 b 06 c is 4 bytes after a block of size 40 alloc'd ==13028== at 0 x 4 A 05 E 1 C: malloc (vg_replace_malloc. c: 195) ==13028== by 0 x 4004 E 9: main (invalid_read_write. c: 6) ==13028== HEAP SUMMARY: ==13028== in use at exit: 0 bytes in 0 blocks ==13028== total heap usage: 1 allocs, 1 frees, 40 bytes allocated ==13028== All heap blocks were freed -- no leaks are possible ==13028== For counts of detected and suppressed errors, rerun with: -v ==13028== ERROR SUMMARY: 2 errors from 2 contexts (suppressed: 4 from 4) [josipjakic@ui Valgrind]$ Tuning and Optimization of HPC Application – Institute of Physics Belgrade, Friday 01 June 2012 8

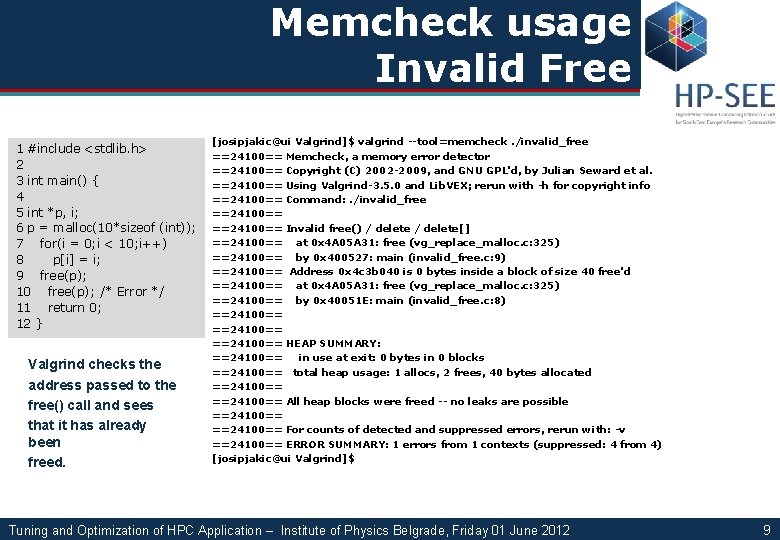
Memcheck usage Invalid Free 1 #include <stdlib. h> 2 3 int main() { 4 5 int *p, i; 6 p = malloc(10*sizeof (int)); 7 for(i = 0; i < 10; i++) 8 p[i] = i; 9 free(p); 10 free(p); /* Error */ 11 return 0; 12 } Valgrind checks the address passed to the free() call and sees that it has already been freed. [josipjakic@ui Valgrind]$ valgrind --tool=memcheck. /invalid_free ==24100== Memcheck, a memory error detector ==24100== Copyright (C) 2002 -2009, and GNU GPL'd, by Julian Seward et al. ==24100== Using Valgrind-3. 5. 0 and Lib. VEX; rerun with -h for copyright info ==24100== Command: . /invalid_free ==24100== Invalid free() / delete[] ==24100== at 0 x 4 A 05 A 31: free (vg_replace_malloc. c: 325) ==24100== by 0 x 400527: main (invalid_free. c: 9) ==24100== Address 0 x 4 c 3 b 040 is 0 bytes inside a block of size 40 free'd ==24100== at 0 x 4 A 05 A 31: free (vg_replace_malloc. c: 325) ==24100== by 0 x 40051 E: main (invalid_free. c: 8) ==24100== HEAP SUMMARY: ==24100== in use at exit: 0 bytes in 0 blocks ==24100== total heap usage: 1 allocs, 2 frees, 40 bytes allocated ==24100== All heap blocks were freed -- no leaks are possible ==24100== For counts of detected and suppressed errors, rerun with: -v ==24100== ERROR SUMMARY: 1 errors from 1 contexts (suppressed: 4 from 4) [josipjakic@ui Valgrind]$ Tuning and Optimization of HPC Application – Institute of Physics Belgrade, Friday 01 June 2012 9

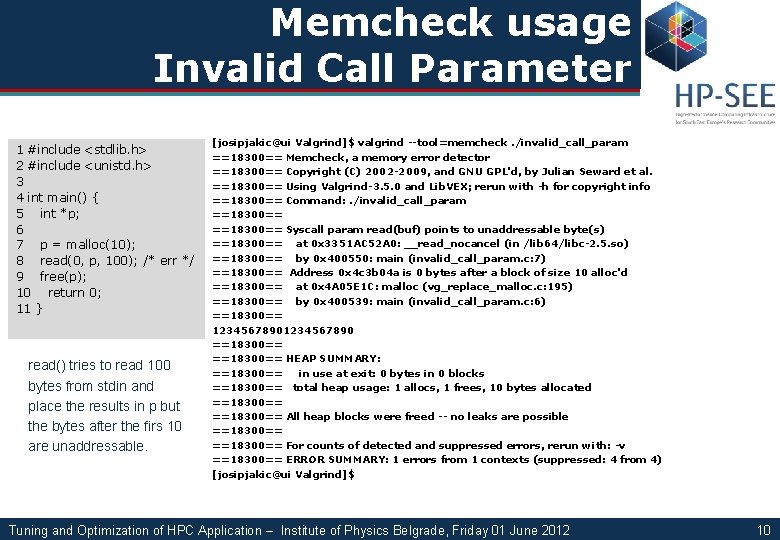
Memcheck usage Invalid Call Parameter 1 #include <stdlib. h> 2 #include <unistd. h> 3 4 int main() { 5 int *p; 6 7 p = malloc(10); 8 read(0, p, 100); /* err */ 9 free(p); 10 return 0; 11 } read() tries to read 100 bytes from stdin and place the results in p but the bytes after the firs 10 are unaddressable. [josipjakic@ui Valgrind]$ valgrind --tool=memcheck. /invalid_call_param ==18300== Memcheck, a memory error detector ==18300== Copyright (C) 2002 -2009, and GNU GPL'd, by Julian Seward et al. ==18300== Using Valgrind-3. 5. 0 and Lib. VEX; rerun with -h for copyright info ==18300== Command: . /invalid_call_param ==18300== Syscall param read(buf) points to unaddressable byte(s) ==18300== at 0 x 3351 AC 52 A 0: __read_nocancel (in /lib 64/libc-2. 5. so) ==18300== by 0 x 400550: main (invalid_call_param. c: 7) ==18300== Address 0 x 4 c 3 b 04 a is 0 bytes after a block of size 10 alloc'd ==18300== at 0 x 4 A 05 E 1 C: malloc (vg_replace_malloc. c: 195) ==18300== by 0 x 400539: main (invalid_call_param. c: 6) ==18300== 1234567890 ==18300== HEAP SUMMARY: ==18300== in use at exit: 0 bytes in 0 blocks ==18300== total heap usage: 1 allocs, 1 frees, 10 bytes allocated ==18300== All heap blocks were freed -- no leaks are possible ==18300== For counts of detected and suppressed errors, rerun with: -v ==18300== ERROR SUMMARY: 1 errors from 1 contexts (suppressed: 4 from 4) [josipjakic@ui Valgrind]$ Tuning and Optimization of HPC Application – Institute of Physics Belgrade, Friday 01 June 2012 10

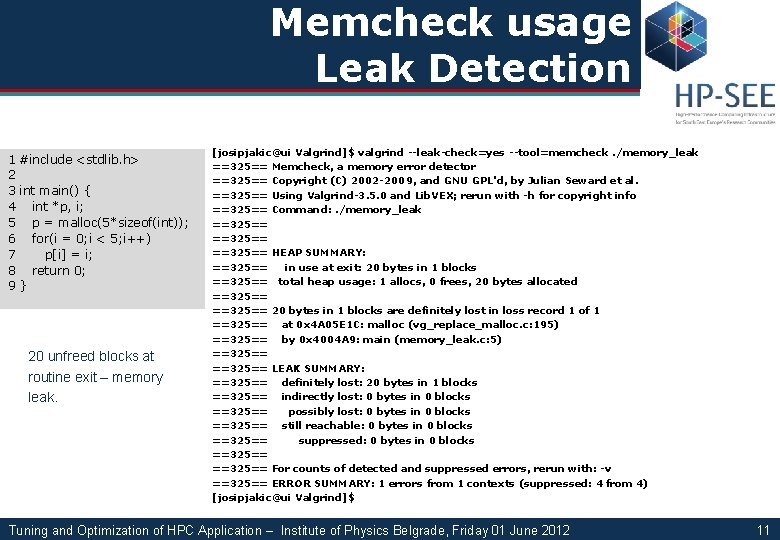
Memcheck usage Leak Detection 1 #include <stdlib. h> 2 3 int main() { 4 int *p, i; 5 p = malloc(5*sizeof(int)); 6 for(i = 0; i < 5; i++) 7 p[i] = i; 8 return 0; 9} 20 unfreed blocks at routine exit – memory leak. [josipjakic@ui Valgrind]$ valgrind --leak-check=yes --tool=memcheck. /memory_leak ==325== Memcheck, a memory error detector ==325== Copyright (C) 2002 -2009, and GNU GPL'd, by Julian Seward et al. ==325== Using Valgrind-3. 5. 0 and Lib. VEX; rerun with -h for copyright info ==325== Command: . /memory_leak ==325== HEAP SUMMARY: ==325== in use at exit: 20 bytes in 1 blocks ==325== total heap usage: 1 allocs, 0 frees, 20 bytes allocated ==325== 20 bytes in 1 blocks are definitely lost in loss record 1 of 1 ==325== at 0 x 4 A 05 E 1 C: malloc (vg_replace_malloc. c: 195) ==325== by 0 x 4004 A 9: main (memory_leak. c: 5) ==325== LEAK SUMMARY: ==325== definitely lost: 20 bytes in 1 blocks ==325== indirectly lost: 0 bytes in 0 blocks ==325== possibly lost: 0 bytes in 0 blocks ==325== still reachable: 0 bytes in 0 blocks ==325== suppressed: 0 bytes in 0 blocks ==325== For counts of detected and suppressed errors, rerun with: -v ==325== ERROR SUMMARY: 1 errors from 1 contexts (suppressed: 4 from 4) [josipjakic@ui Valgrind]$ Tuning and Optimization of HPC Application – Institute of Physics Belgrade, Friday 01 June 2012 11

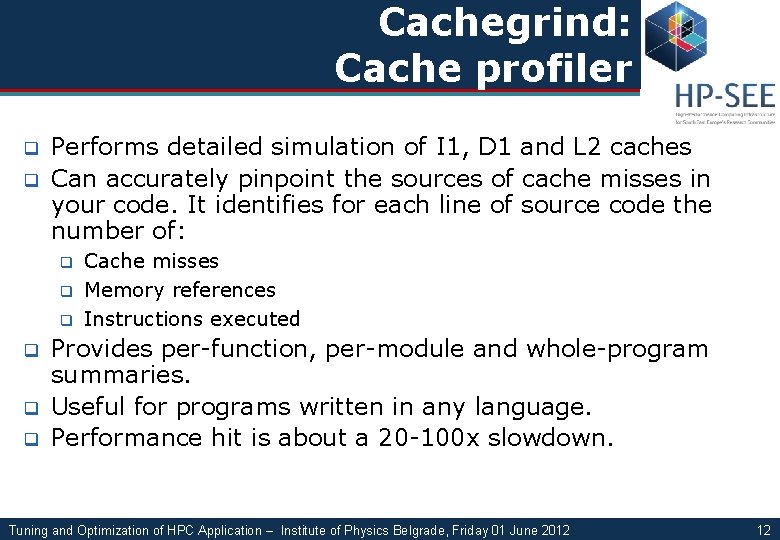
Cachegrind: Cache profiler q q Performs detailed simulation of I 1, D 1 and L 2 caches Can accurately pinpoint the sources of cache misses in your code. It identifies for each line of source code the number of: q q q Cache misses Memory references Instructions executed Provides per-function, per-module and whole-program summaries. Useful for programs written in any language. Performance hit is about a 20 -100 x slowdown. Tuning and Optimization of HPC Application – Institute of Physics Belgrade, Friday 01 June 2012 12

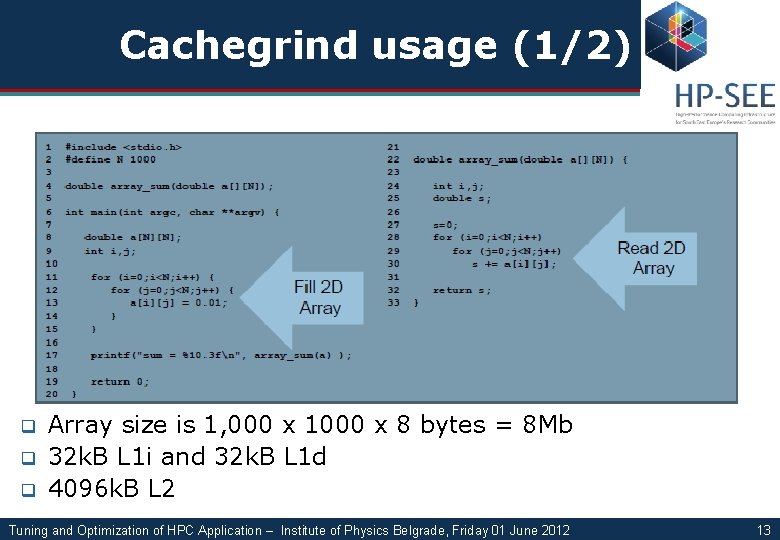
Cachegrind usage (1/2) q q q Array size is 1, 000 x 1000 x 8 bytes = 8 Mb 32 k. B L 1 i and 32 k. B L 1 d 4096 k. B L 2 Tuning and Optimization of HPC Application – Institute of Physics Belgrade, Friday 01 June 2012 13
![Cachegrind usage 22 josipjakicui Valgrind gcc O 2 g o loopsfast c josipjakicui Valgrind Cachegrind usage (2/2) [josipjakic@ui Valgrind]$ gcc -O 2 -g -o loops-fast. c [josipjakic@ui Valgrind]$](https://slidetodoc.com/presentation_image_h2/944aa74a24e495eb3b256d17be371c1c/image-14.jpg)
Cachegrind usage (2/2) [josipjakic@ui Valgrind]$ gcc -O 2 -g -o loops-fast. c [josipjakic@ui Valgrind]$ valgrind --tool=cachegrind. /loops-fast ==23430== Cachegrind, a cache and branch-prediction profiler ==23430== Copyright (C) 2002 -2009, and GNU GPL'd, by Nicholas Nethercote et al. ==23430== Using Valgrind-3. 5. 0 and Lib. VEX; rerun with -h for copyright info ==23430== Command: . /loops-fast ==23430== sum = 10000. 000 ==23430== I refs: 10, 122, 886 ==23430== I 1 misses: 847 ==23430== L 2 i misses: 846 ==23430== I 1 miss rate: 0. 00% ==23430== L 2 i miss rate: 0. 00% ==23430== D refs: 2, 041, 972 (1, 029, 938 rd + 1, 012, 034 wr) ==23430== D 1 misses: 251, 113 ( 125, 846 rd + 125, 267 wr) ==23430== L 2 d misses: 251, 047 ( 125, 785 rd + 125, 262 wr) ==23430== D 1 miss rate: 12. 2% ( 12. 2% + 12. 3% ) ==23430== L 2 d miss rate: 12. 2% ( 12. 2% + 12. 3% ) ==23430== L 2 refs: 251, 960 ( 126, 693 rd + 125, 267 wr) ==23430== L 2 misses: 251, 893 ( 126, 631 rd + 125, 262 wr) ==23430== L 2 miss rate: 2. 0% ( 1. 1% + 12. 3% ) [josipjakic@ui Valgrind]$ Tuning and Optimization of HPC Application – Institute of Physics Belgrade, Friday 01 June 2012 14

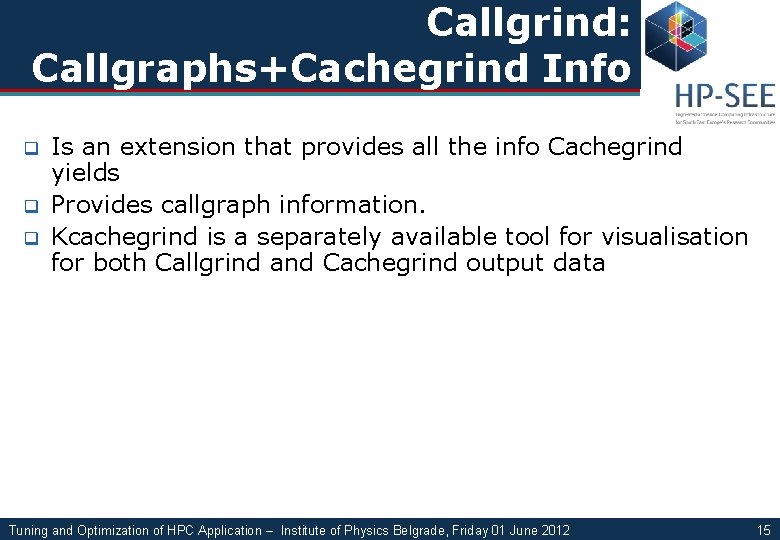
Callgrind: Callgraphs+Cachegrind Info q q q Is an extension that provides all the info Cachegrind yields Provides callgraph information. Kcachegrind is a separately available tool for visualisation for both Callgrind and Cachegrind output data Tuning and Optimization of HPC Application – Institute of Physics Belgrade, Friday 01 June 2012 15
![Callgrind usage 13 josipjakicui Valgrind valgrind toolcallgrind simulatecacheyes loopsfast 19141 Callgrind a callgraph generating Callgrind usage (1/3) [josipjakic@ui Valgrind]$ valgrind --tool=callgrind --simulate-cache=yes. /loops-fast ==19141== Callgrind, a call-graph generating](https://slidetodoc.com/presentation_image_h2/944aa74a24e495eb3b256d17be371c1c/image-16.jpg)
Callgrind usage (1/3) [josipjakic@ui Valgrind]$ valgrind --tool=callgrind --simulate-cache=yes. /loops-fast ==19141== Callgrind, a call-graph generating cache profiler ==19141== Copyright (C) 2002 -2009, and GNU GPL'd, by Josef Weidendorfer et al. ==19141== Using Valgrind-3. 5. 0 and Lib. VEX; rerun with -h for copyright info ==19141== Command: . /loops-fast ==19141== For interactive control, run 'callgrind_control -h'. sum = 10000. 000 ==19141== Events : Ir Dr Dw I 1 mr D 1 mw I 2 mr D 2 mw ==19141== Collected : 10122883 1029478 1012494 847 125838 125275 846 125777 125270 ==19141== I refs: 10, 122, 883 ==19141== I 1 misses: 847 ==19141== L 2 i misses: 846 ==19141== I 1 miss rate: 0. 0% ==19141== L 2 i miss rate: 0. 0% ==19141== D refs: 2, 041, 972 (1, 029, 478 rd + 1, 012, 494 wr) ==19141== D 1 misses: 251, 113 ( 125, 838 rd + 125, 275 wr) ==19141== L 2 d misses: 251, 047 ( 125, 777 rd + 125, 270 wr) ==19141== D 1 miss rate: 12. 2% ( 12. 2% + 12. 3% ) ==19141== L 2 d miss rate: 12. 2% ( 12. 2% + 12. 3% ) ==19141== L 2 refs: 251, 960 ( 126, 685 rd + 125, 275 wr) ==19141== L 2 misses: 251, 893 ( 126, 623 rd + 125, 270 wr) ==19141== L 2 miss rate: 2. 0% ( 1. 1% + 12. 3% ) [josipjakic@ui Valgrind]$ Tuning and Optimization of HPC Application – Institute of Physics Belgrade, Friday 01 June 2012 16

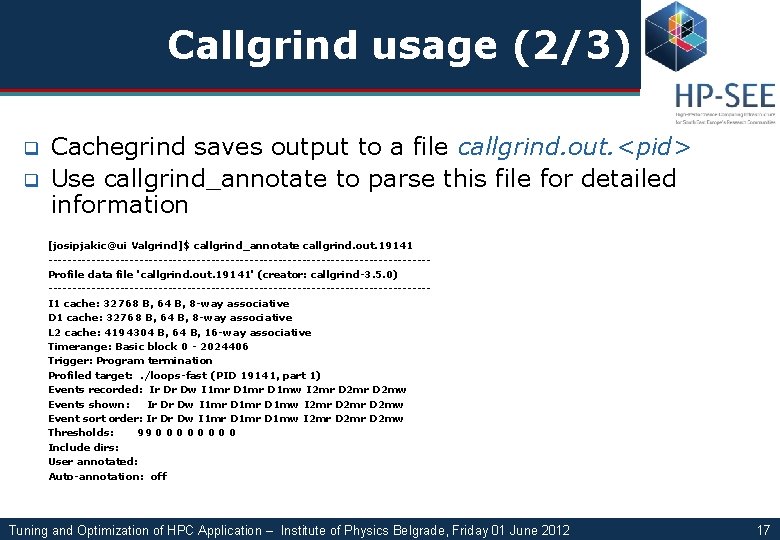
Callgrind usage (2/3) q q Cachegrind saves output to a file callgrind. out. <pid> Use callgrind_annotate to parse this file for detailed information [josipjakic@ui Valgrind]$ callgrind_annotate callgrind. out. 19141 ----------------------------------------Profile data file 'callgrind. out. 19141' (creator: callgrind-3. 5. 0) ----------------------------------------I 1 cache: 32768 B, 64 B, 8 -way associative D 1 cache: 32768 B, 64 B, 8 -way associative L 2 cache: 4194304 B, 64 B, 16 -way associative Timerange: Basic block 0 - 2024406 Trigger: Program termination Profiled target: . /loops-fast (PID 19141, part 1) Events recorded: Ir Dr Dw I 1 mr D 1 mw I 2 mr D 2 mw Events shown: Ir Dr Dw I 1 mr D 1 mw I 2 mr D 2 mw Event sort order: Ir Dr Dw I 1 mr D 1 mw I 2 mr D 2 mw Thresholds: 99 0 0 0 0 Include dirs: User annotated: Auto-annotation: off Tuning and Optimization of HPC Application – Institute of Physics Belgrade, Friday 01 June 2012 17

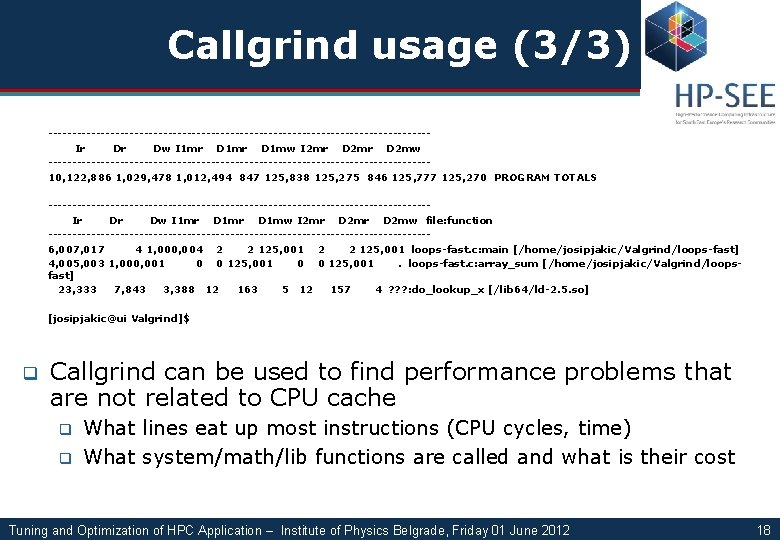
Callgrind usage (3/3) ----------------------------------------Ir Dr Dw I 1 mr D 1 mw I 2 mr D 2 mw ----------------------------------------10, 122, 886 1, 029, 478 1, 012, 494 847 125, 838 125, 275 846 125, 777 125, 270 PROGRAM TOTALS ----------------------------------------Ir Dr Dw I 1 mr D 1 mw I 2 mr D 2 mw file: function ----------------------------------------6, 007, 017 4 1, 000, 004 2 2 125, 001 loops-fast. c: main [/home/josipjakic/Valgrind/loops-fast] 4, 005, 003 1, 000, 001 0 0 125, 001. loops-fast. c: array_sum [/home/josipjakic/Valgrind/loopsfast] 23, 333 7, 843 3, 388 12 163 5 12 157 4 ? ? ? : do_lookup_x [/lib 64/ld-2. 5. so] [josipjakic@ui Valgrind]$ q Callgrind can be used to find performance problems that are not related to CPU cache q q What lines eat up most instructions (CPU cycles, time) What system/math/lib functions are called and what is their cost Tuning and Optimization of HPC Application – Institute of Physics Belgrade, Friday 01 June 2012 18

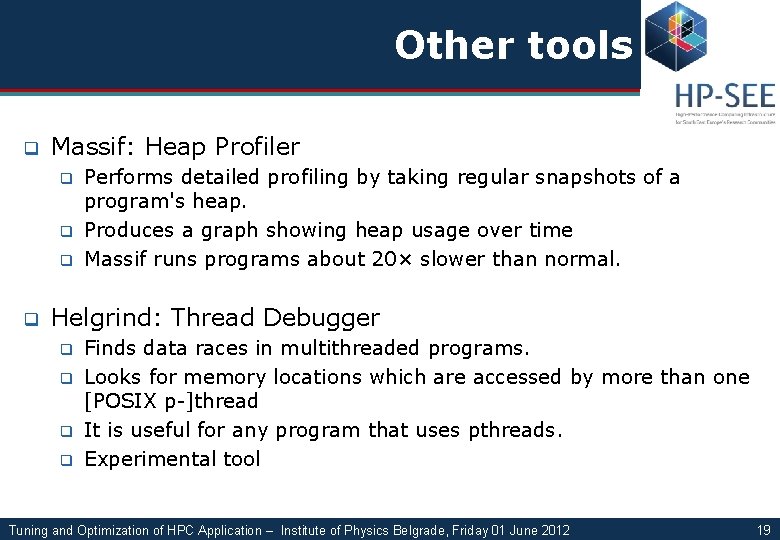
Other tools q Massif: Heap Profiler q q Performs detailed profiling by taking regular snapshots of a program's heap. Produces a graph showing heap usage over time Massif runs programs about 20× slower than normal. Helgrind: Thread Debugger q q Finds data races in multithreaded programs. Looks for memory locations which are accessed by more than one [POSIX p-]thread It is useful for any program that uses pthreads. Experimental tool Tuning and Optimization of HPC Application – Institute of Physics Belgrade, Friday 01 June 2012 19

References q Valgrind is freely available from: http: //www. valgrind. org Tuning and Optimization of HPC Application – Institute of Physics Belgrade, Friday 01 June 2012 20