1 Profiling Optimization David Geldreich DREAM 1 Profiling
- Slides: 34

1 Profiling & Optimization David Geldreich (DREAM) 1

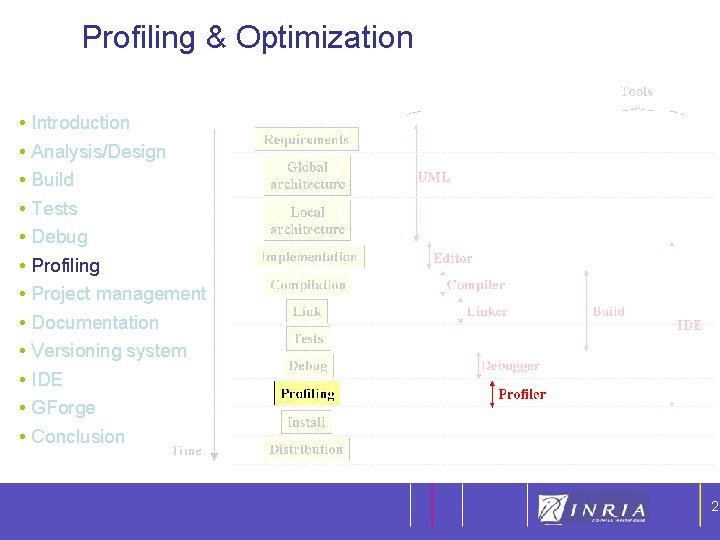
Profiling & Optimization 2 • Introduction • Analysis/Design • Build • Tests • Debug • Profiling • Project management • Documentation • Versioning system • IDE • GForge • Conclusion 2

3 Outline • Profiling • Tools • Optimization 3

4 Profiling No optimization without profiling Not everyone has a P 4 @ 3 Ghz “We should forget about small efficiencies, say about 97% of the time : premature optimization is the root of all evil. ” Donald Knuth 4

5 Profiling : When ? • To choose among several algorithms for a given problem • To check the awaited behavior at runtime • To find the parts of the code to be optimized 5

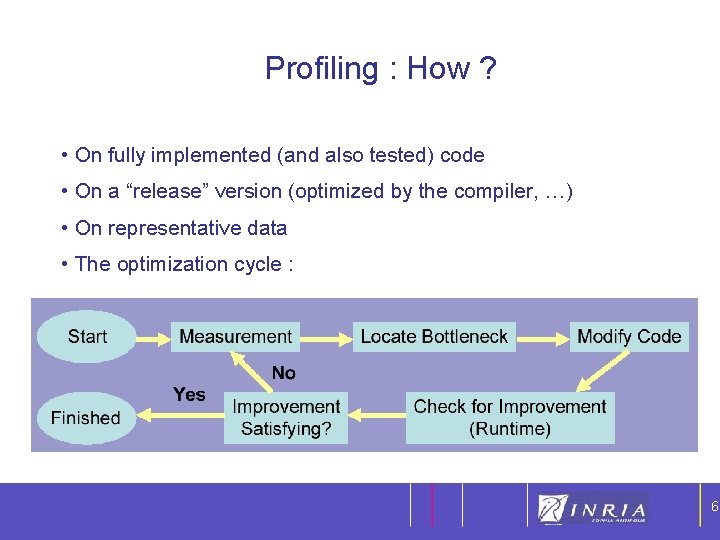
6 Profiling : How ? • On fully implemented (and also tested) code • On a “release” version (optimized by the compiler, …) • On representative data • The optimization cycle : 6

7 What do we measure ? • Understand what’s going on : • • OS: scheduling, memory management, hard drives, network Compiler : optimization CPU architecture, chipset, memory Libraries used • If an application is limited by its I/O, useless to improve the calculation part. • Here we’ll limit ourselves to CPU & memory performance. 7

8 Measurement methods • Manual • Source instrumentation • Statistical measure (sampling) • Simulation • Hardware counters 8

9 Outline • Profiling • Tools • Optimization 9

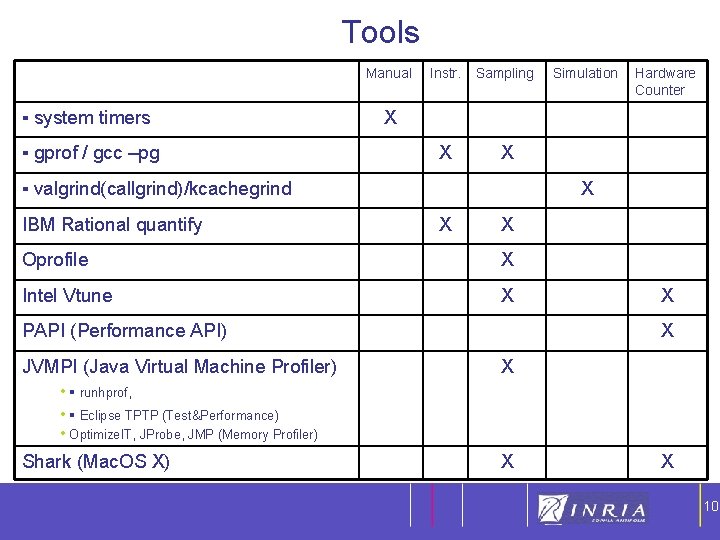
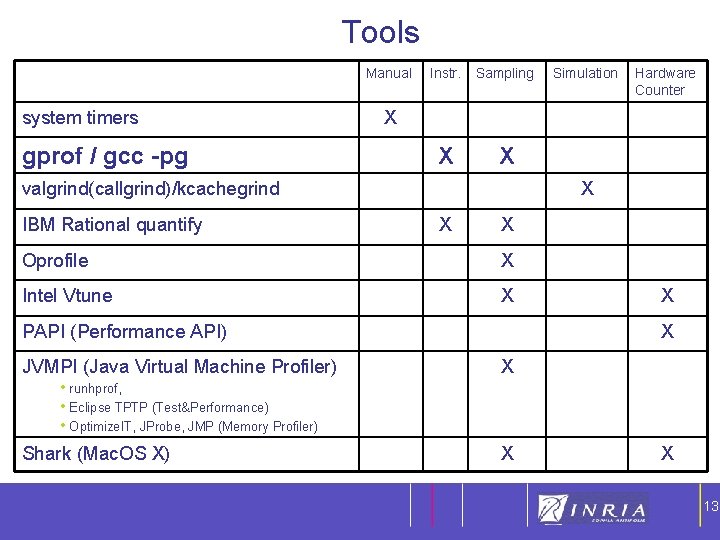
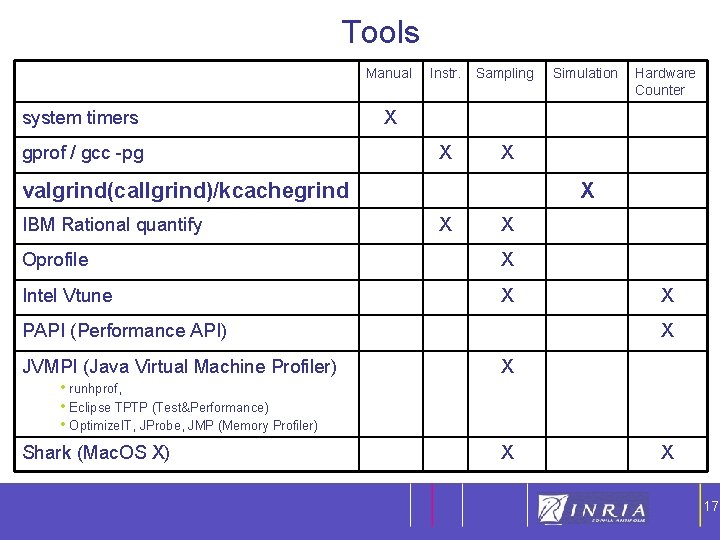
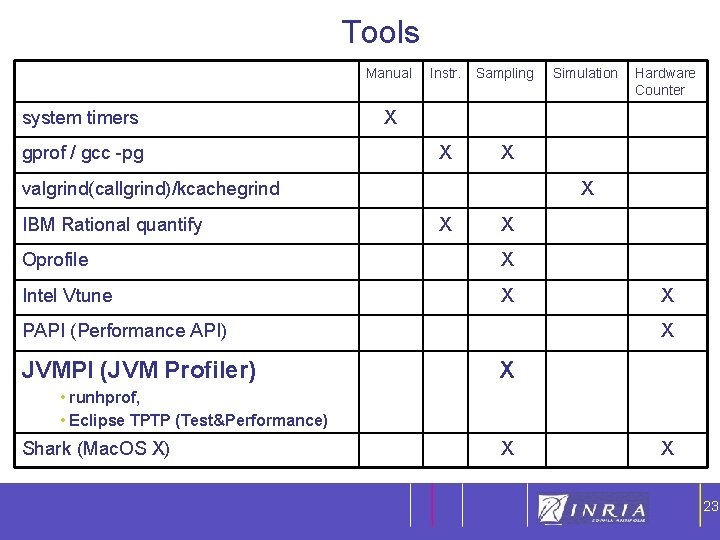
10 Tools Manual ▪ system timers ▪ gprof / gcc –pg Instr. Sampling X X X Oprofile X Intel Vtune X PAPI (Performance API) JVMPI (Java Virtual Machine Profiler) Hardware Counter X ▪ valgrind(callgrind)/kcachegrind IBM Rational quantify Simulation X X X • ▪ runhprof, • ▪ Eclipse TPTP (Test&Performance) • Optimize. IT, JProbe, JMP (Memory Profiler) Shark (Mac. OS X) X X 10

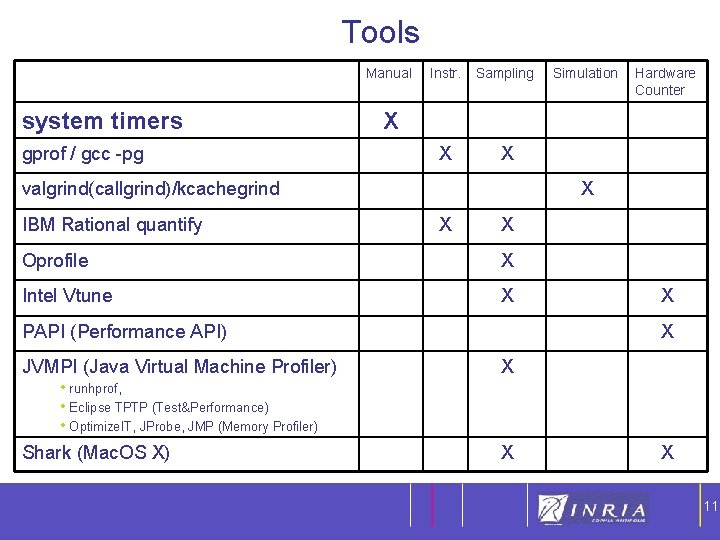
11 Tools Manual system timers gprof / gcc -pg Instr. Sampling X X X Oprofile X Intel Vtune X PAPI (Performance API) JVMPI (Java Virtual Machine Profiler) Hardware Counter X valgrind(callgrind)/kcachegrind IBM Rational quantify Simulation X X X • runhprof, • Eclipse TPTP (Test&Performance) • Optimize. IT, JProbe, JMP (Memory Profiler) Shark (Mac. OS X) X X 11

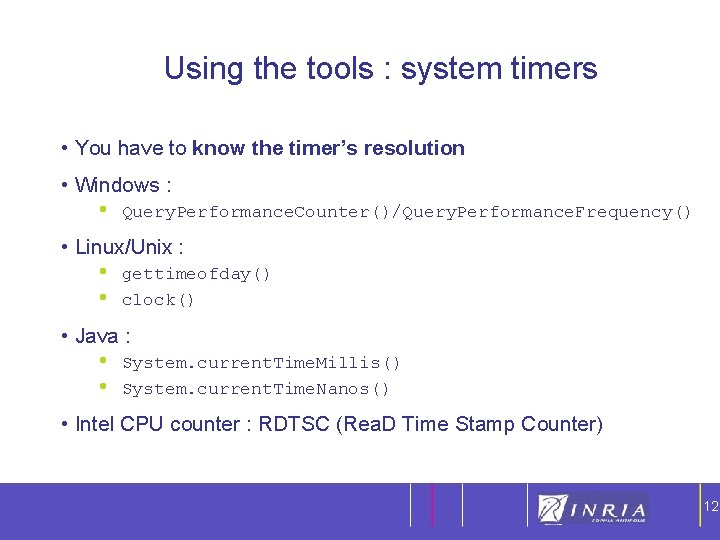
12 Using the tools : system timers • You have to know the timer’s resolution • Windows : • Query. Performance. Counter()/Query. Performance. Frequency() • Linux/Unix : • • gettimeofday() clock() • Java : • • System. current. Time. Millis() System. current. Time. Nanos() • Intel CPU counter : RDTSC (Rea. D Time Stamp Counter) 12

13 Tools Manual system timers gprof / gcc -pg Instr. Sampling X X X Oprofile X Intel Vtune X PAPI (Performance API) JVMPI (Java Virtual Machine Profiler) Hardware Counter X valgrind(callgrind)/kcachegrind IBM Rational quantify Simulation X X X • runhprof, • Eclipse TPTP (Test&Performance) • Optimize. IT, JProbe, JMP (Memory Profiler) Shark (Mac. OS X) X X 13

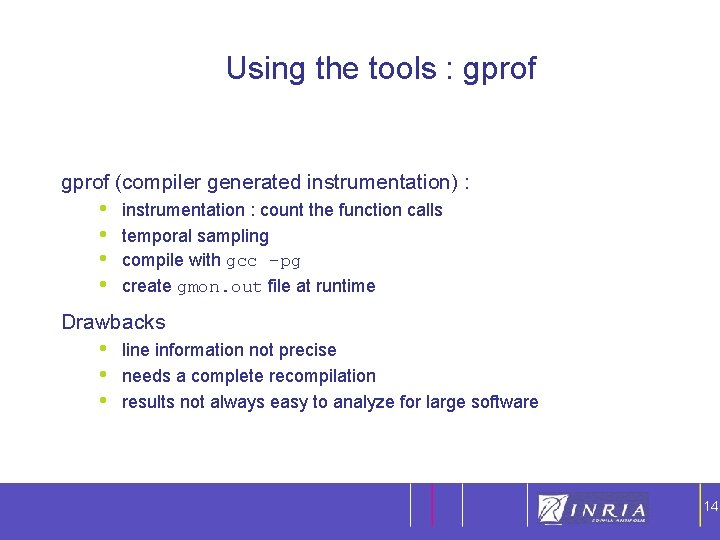
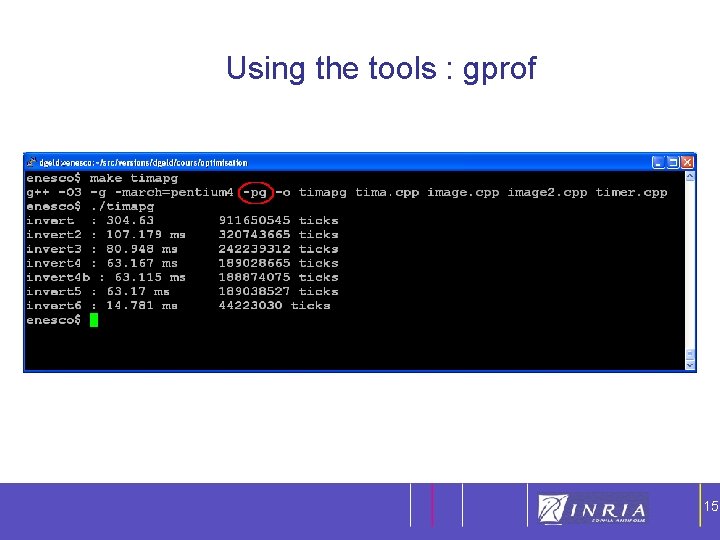
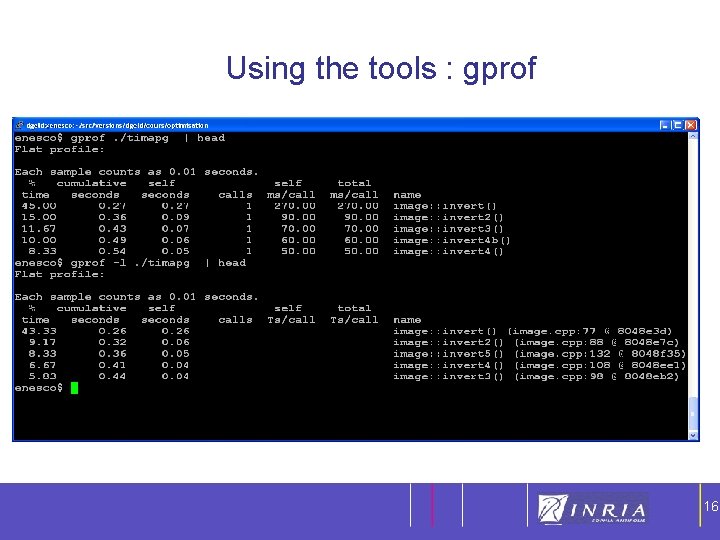
14 Using the tools : gprof (compiler generated instrumentation) : • • instrumentation : count the function calls temporal sampling compile with gcc -pg create gmon. out file at runtime Drawbacks • • • line information not precise needs a complete recompilation results not always easy to analyze for large software 14

15 Using the tools : gprof 15

16 Using the tools : gprof 16

17 Tools Manual system timers gprof / gcc -pg Instr. Sampling X X X Oprofile X Intel Vtune X PAPI (Performance API) JVMPI (Java Virtual Machine Profiler) Hardware Counter X valgrind(callgrind)/kcachegrind IBM Rational quantify Simulation X X X • runhprof, • Eclipse TPTP (Test&Performance) • Optimize. IT, JProbe, JMP (Memory Profiler) Shark (Mac. OS X) X X 17

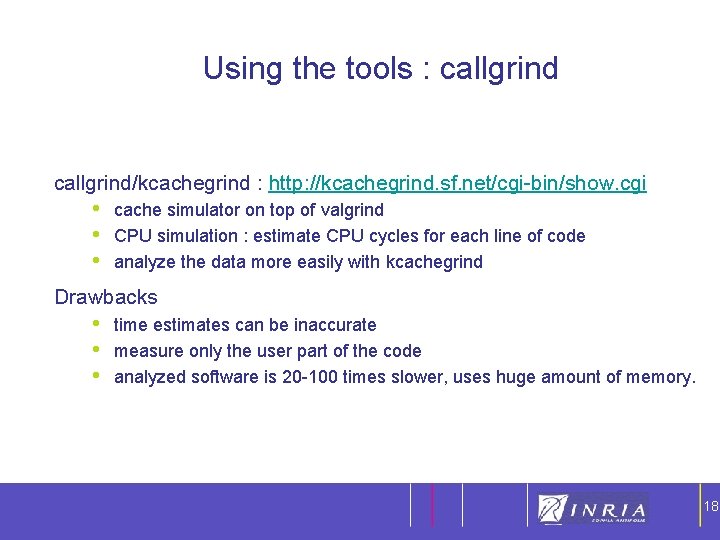
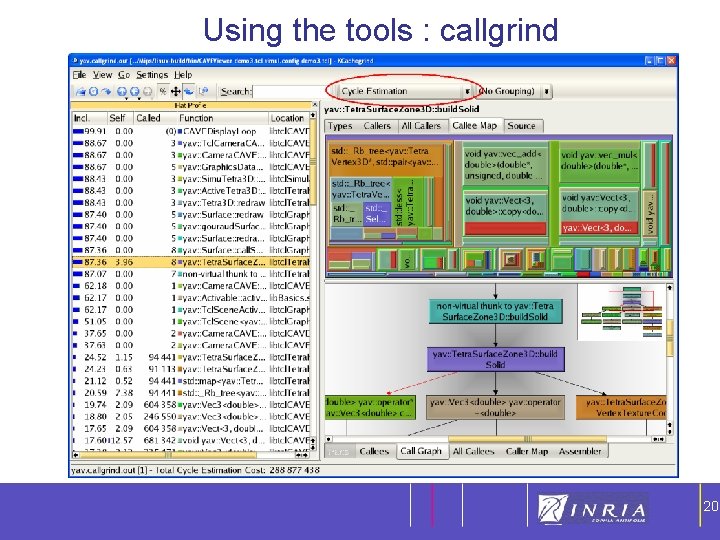
18 Using the tools : callgrind/kcachegrind : http: //kcachegrind. sf. net/cgi-bin/show. cgi • • • cache simulator on top of valgrind CPU simulation : estimate CPU cycles for each line of code analyze the data more easily with kcachegrind Drawbacks • • • time estimates can be inaccurate measure only the user part of the code analyzed software is 20 -100 times slower, uses huge amount of memory. 18

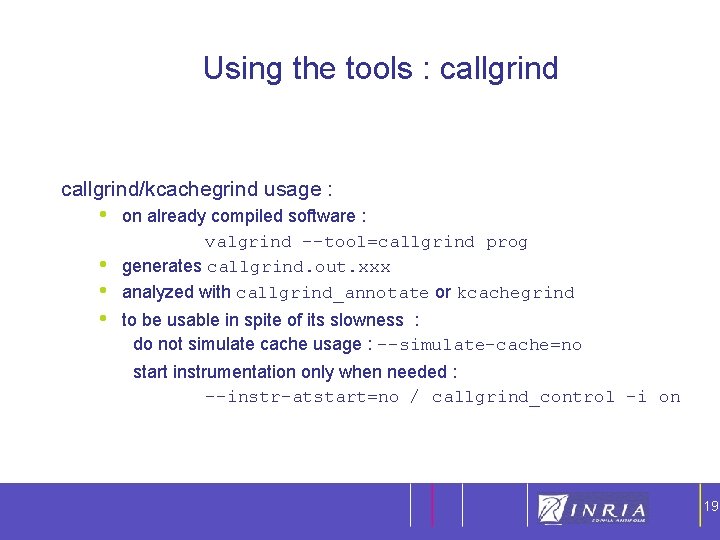
19 Using the tools : callgrind/kcachegrind usage : • • on already compiled software : valgrind --tool=callgrind prog generates callgrind. out. xxx analyzed with callgrind_annotate or kcachegrind to be usable in spite of its slowness : do not simulate cache usage : --simulate-cache=no start instrumentation only when needed : --instr-atstart=no / callgrind_control -i on 19

Using the tools : callgrind 20 20

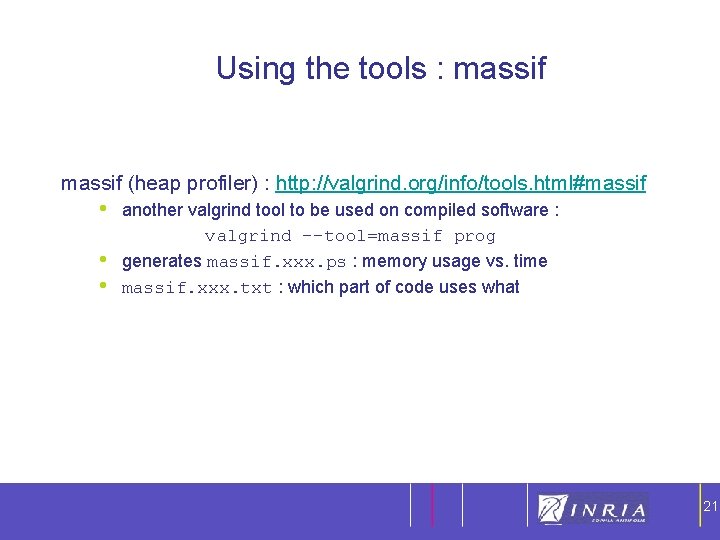
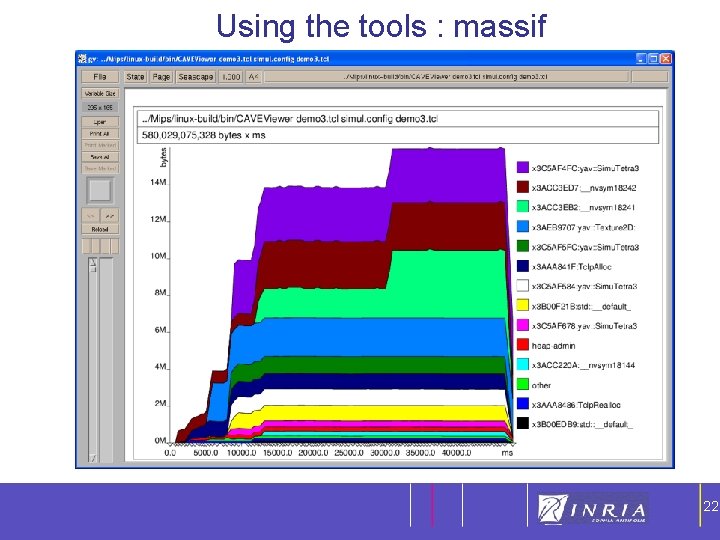
21 Using the tools : massif (heap profiler) : http: //valgrind. org/info/tools. html#massif • • • another valgrind tool to be used on compiled software : valgrind --tool=massif prog generates massif. xxx. ps : memory usage vs. time massif. xxx. txt : which part of code uses what 21

Using the tools : massif 22 22

23 Tools Manual system timers gprof / gcc -pg Instr. Sampling X X X Oprofile X Intel Vtune X PAPI (Performance API) JVMPI (JVM Profiler) Hardware Counter X valgrind(callgrind)/kcachegrind IBM Rational quantify Simulation X X X • runhprof, • Eclipse TPTP (Test&Performance) Shark (Mac. OS X) X X 23

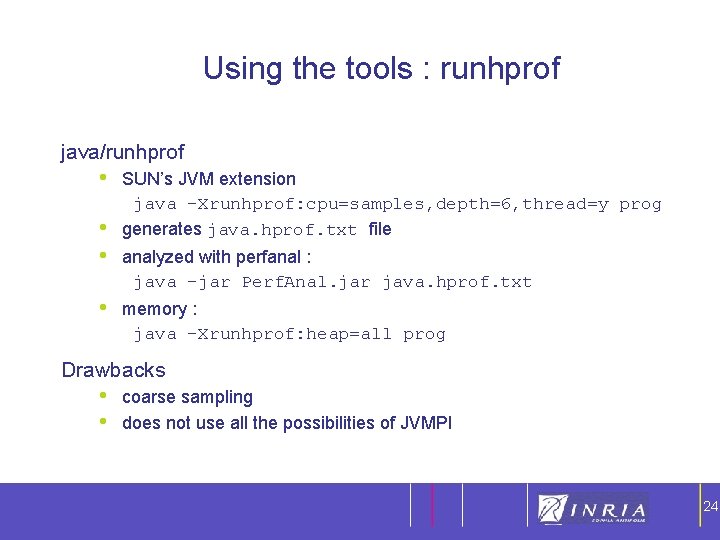
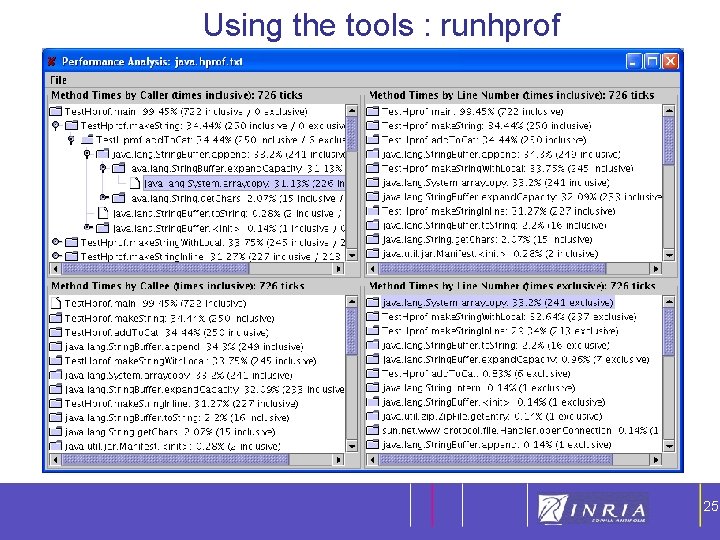
24 Using the tools : runhprof java/runhprof • • SUN’s JVM extension java -Xrunhprof: cpu=samples, depth=6, thread=y prog generates java. hprof. txt file analyzed with perfanal : java -jar Perf. Anal. jar java. hprof. txt memory : java -Xrunhprof: heap=all prog Drawbacks • • coarse sampling does not use all the possibilities of JVMPI 24

Using the tools : runhprof 25 25

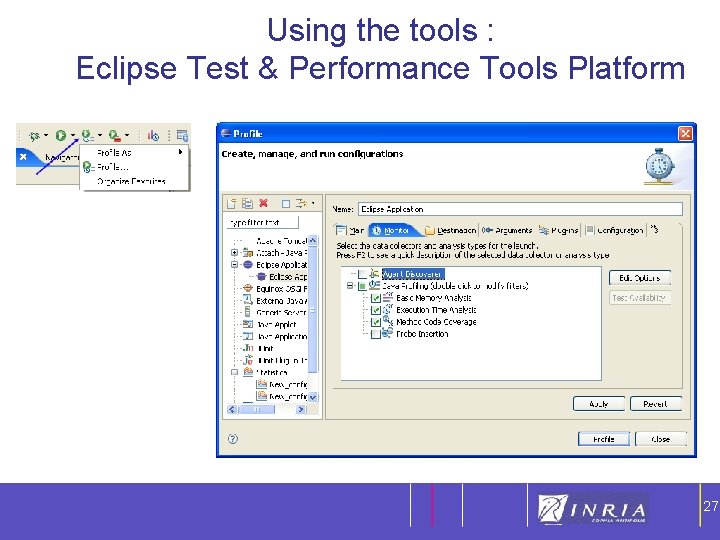
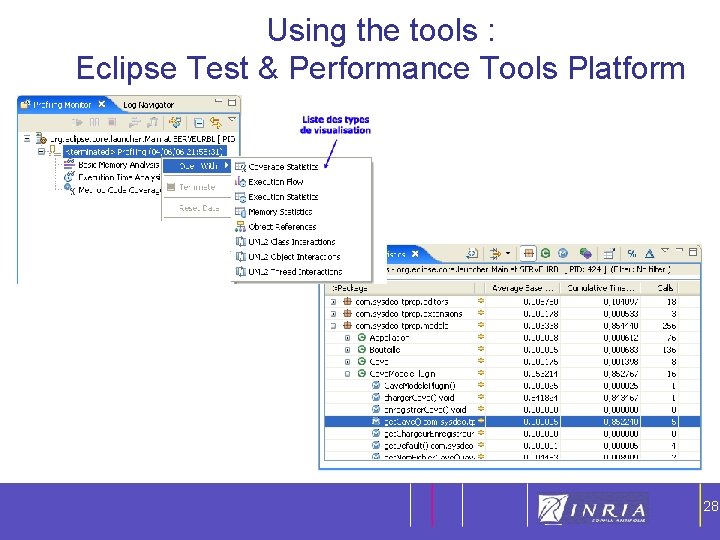
Using the tools : Eclipse Test & Performance Tools Platform 26 TPTP : tools integrated into Eclipse Supports only Java (for the moment) Profiling of local or distributed software 26

Using the tools : Eclipse Test & Performance Tools Platform 27 27

Using the tools : Eclipse Test & Performance Tools Platform 28 28

29 Outline • Profiling • Tools • Optimization 29

30 Optimization • No premature optimization • Keep the code maintainable • Do not over-optimize 30

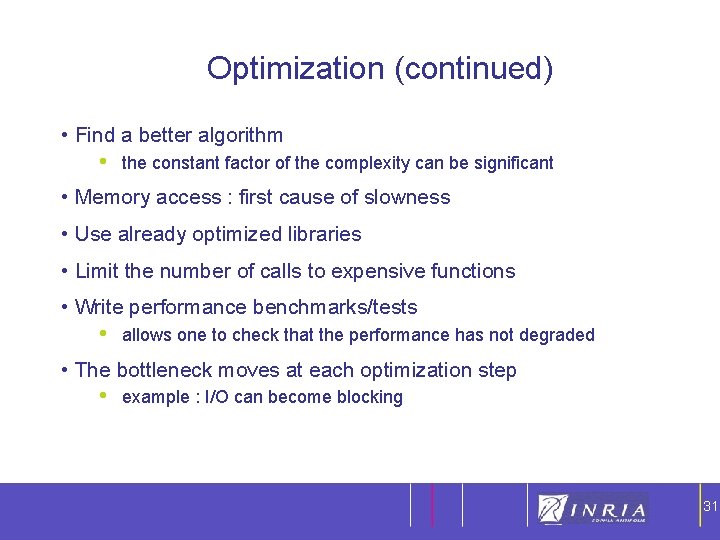
31 Optimization (continued) • Find a better algorithm • the constant factor of the complexity can be significant • Memory access : first cause of slowness • Use already optimized libraries • Limit the number of calls to expensive functions • Write performance benchmarks/tests • allows one to check that the performance has not degraded • The bottleneck moves at each optimization step • example : I/O can become blocking 31

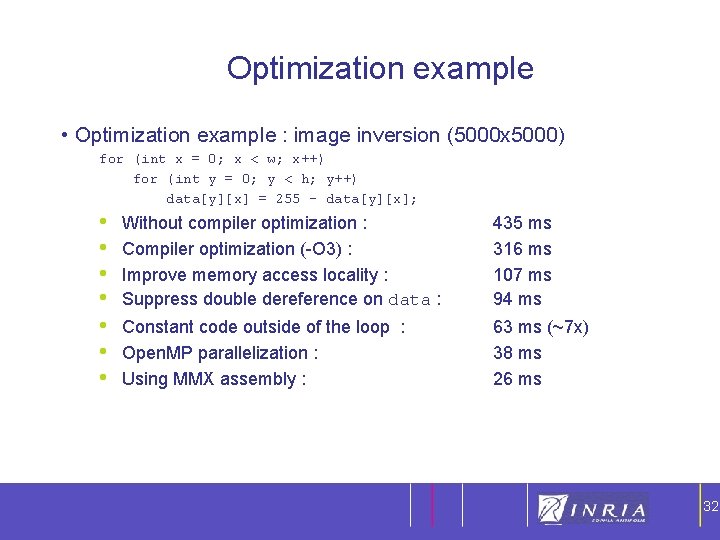
32 Optimization example • Optimization example : image inversion (5000 x 5000) for (int x = 0; x < w; x++) for (int y = 0; y < h; y++) data[y][x] = 255 - data[y][x]; • • Without compiler optimization : Compiler optimization (-O 3) : Improve memory access locality : Suppress double dereference on data : 435 ms 316 ms 107 ms 94 ms Constant code outside of the loop : Open. MP parallelization : Using MMX assembly : 63 ms (~7 x) 38 ms 26 ms 32

33 Conclusion • No premature optimization • Know your profiling tool • Keep the code maintainable • Do not over-optimize 33

34 Questions ? 34