
A Framework for Tracking Memory Accesses in Scientific

- Slides: 27
A Framework for Tracking Memory Accesses in Scientific Applications Antonio J. Peña Argonne National Laboratory apenya@anl. gov Pavan Balaji Argonne National Laboratory balaji@anl. gov
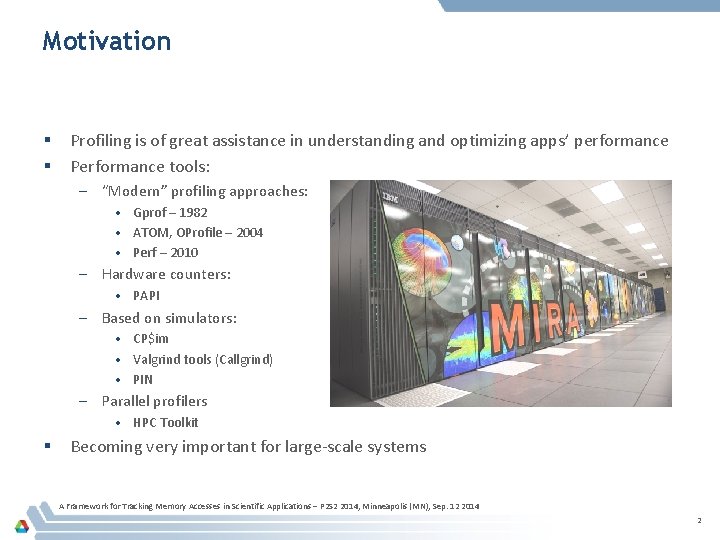
Motivation § § Profiling is of great assistance in understanding and optimizing apps’ performance Performance tools: – “Modern” profiling approaches: • Gprof – 1982 • ATOM, OProfile – 2004 • Perf – 2010 – Hardware counters: • PAPI – Based on simulators: • CP$im • Valgrind tools (Callgrind) • PIN – Parallel profilers • HPC Toolkit § Becoming very important for large-scale systems A Framework for Tracking Memory Accesses in Scientific Applications – P 2 S 2 2014, Minneapolis (MN), Sep. 12 2014 2
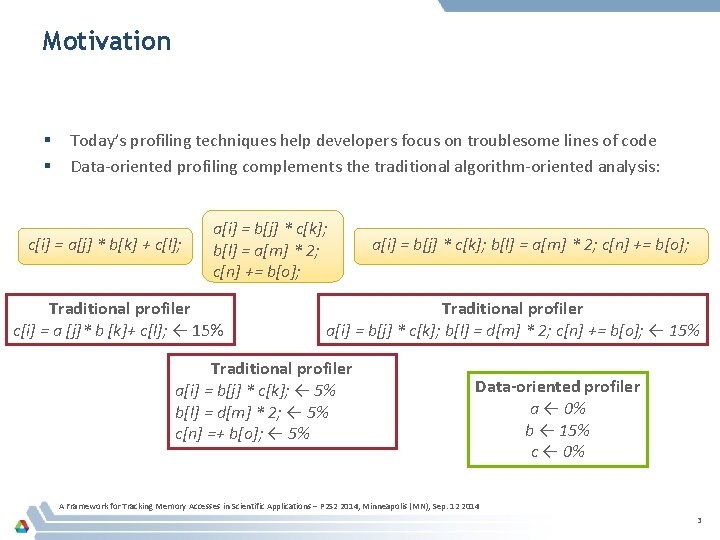
Motivation § § Today’s profiling techniques help developers focus on troublesome lines of code Data-oriented profiling complements the traditional algorithm-oriented analysis: c[i] = a[j] * b[k] + c[l]; a[i] = b[j] * c[k]; b[l] = a[m] * 2; c[n] += b[o]; Traditional profiler c[i] = a [j]* b [k]+ c[l]; ← 15% a[i] = b[j] * c[k]; b[l] = a[m] * 2; c[n] += b[o]; Traditional profiler a[i] = b[j] * c[k]; b[l] = d[m] * 2; c[n] += b[o]; ← 15% Traditional profiler a[i] = b[j] * c[k]; ← 5% b[l] = d[m] * 2; ← 5% c[n] =+ b[o]; ← 5% Data-oriented profiler a ← 0% b ← 15% c ← 0% A Framework for Tracking Memory Accesses in Scientific Applications – P 2 S 2 2014, Minneapolis (MN), Sep. 12 2014 3
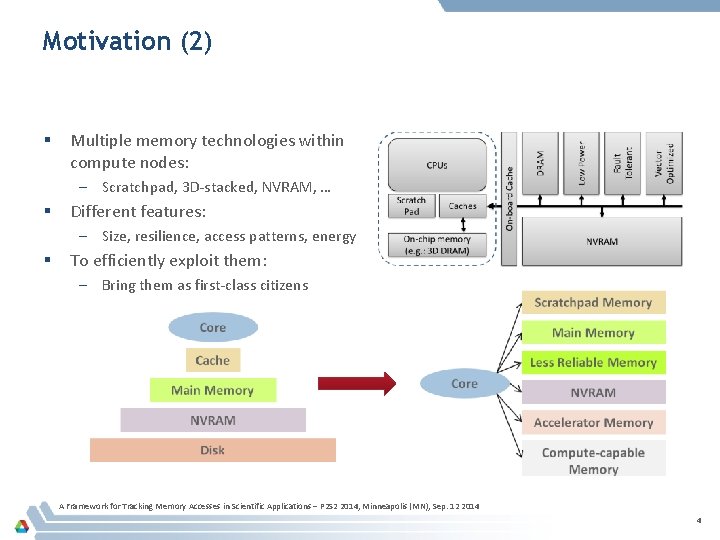
Motivation (2) § Multiple memory technologies within compute nodes: – Scratchpad, 3 D-stacked, NVRAM, … § Different features: – Size, resilience, access patterns, energy § To efficiently exploit them: – Bring them as first-class citizens A Framework for Tracking Memory Accesses in Scientific Applications – P 2 S 2 2014, Minneapolis (MN), Sep. 12 2014 4
Contents § § § Introduction Background: Valgrind Core Extensions Extending Valgrind Tools Heterogeneous Memory Conclusions A Framework for Tracking Memory Accesses in Scientific Applications – P 2 S 2 2014, Minneapolis (MN), Sep. 12 2014 5
Introduction § Goals: – Pofiling-based – data oriented – Memory object granularity § Solution: – Valgrind core and tools extensions § Heterogeneous Memory: – Assess optimal distribution A Framework for Tracking Memory Accesses in Scientific Applications – P 2 S 2 2014, Minneapolis (MN), Sep. 12 2014 6
Valgrind A Framework for Tracking Memory Accesses in Scientific Applications – P 2 S 2 2014, Minneapolis (MN), Sep. 12 2014 7
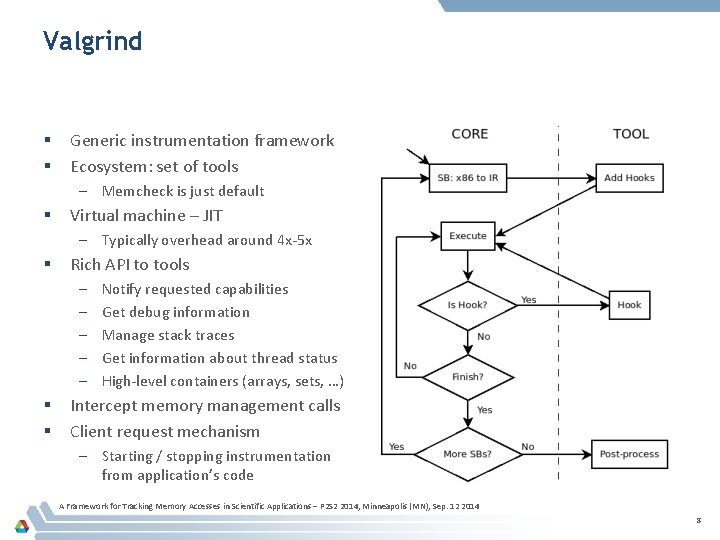
Valgrind § § Generic instrumentation framework Ecosystem: set of tools – Memcheck is just default § Virtual machine – JIT – Typically overhead around 4 x-5 x § Rich API to tools – – – § § Notify requested capabilities Get debug information Manage stack traces Get information about thread status High-level containers (arrays, sets, …) Intercept memory management calls Client request mechanism – Starting / stopping instrumentation from application’s code A Framework for Tracking Memory Accesses in Scientific Applications – P 2 S 2 2014, Minneapolis (MN), Sep. 12 2014 8
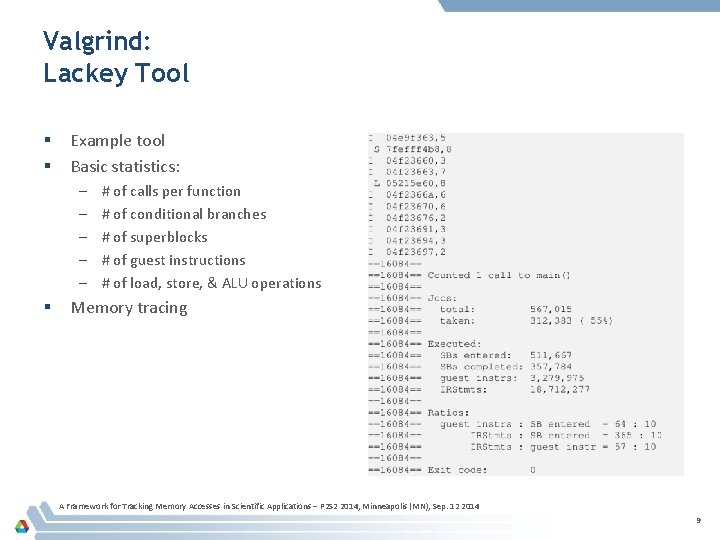
Valgrind: Lackey Tool § § Example tool Basic statistics: – – – § # of calls per function # of conditional branches # of superblocks # of guest instructions # of load, store, & ALU operations Memory tracing A Framework for Tracking Memory Accesses in Scientific Applications – P 2 S 2 2014, Minneapolis (MN), Sep. 12 2014 9
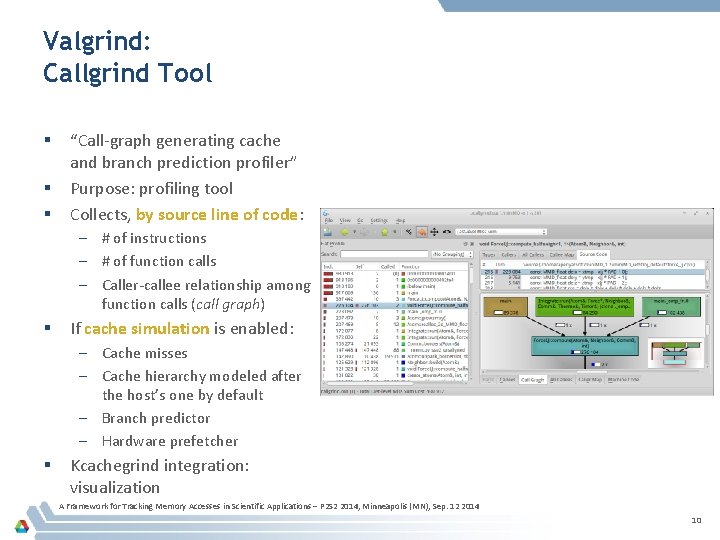
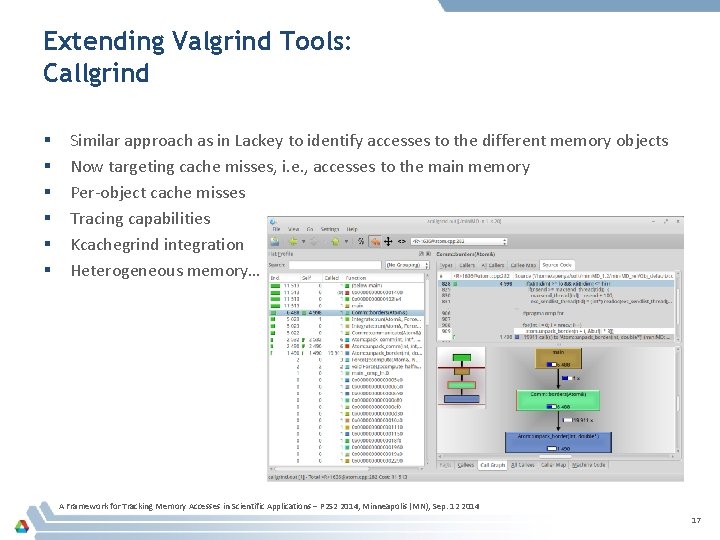
Valgrind: Callgrind Tool § § § “Call-graph generating cache and branch prediction profiler” Purpose: profiling tool Collects, by source line of code: – # of instructions – # of function calls – Caller-callee relationship among function calls (call graph) § If cache simulation is enabled: – Cache misses – Cache hierarchy modeled after the host’s one by default – Branch predictor – Hardware prefetcher § Kcachegrind integration: visualization A Framework for Tracking Memory Accesses in Scientific Applications – P 2 S 2 2014, Minneapolis (MN), Sep. 12 2014 10
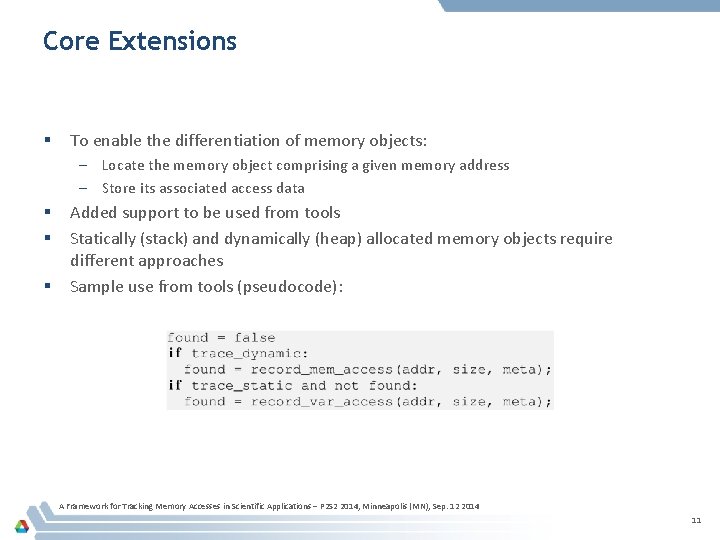
Core Extensions § To enable the differentiation of memory objects: – Locate the memory object comprising a given memory address – Store its associated access data § § § Added support to be used from tools Statically (stack) and dynamically (heap) allocated memory objects require different approaches Sample use from tools (pseudocode): A Framework for Tracking Memory Accesses in Scientific Applications – P 2 S 2 2014, Minneapolis (MN), Sep. 12 2014 11
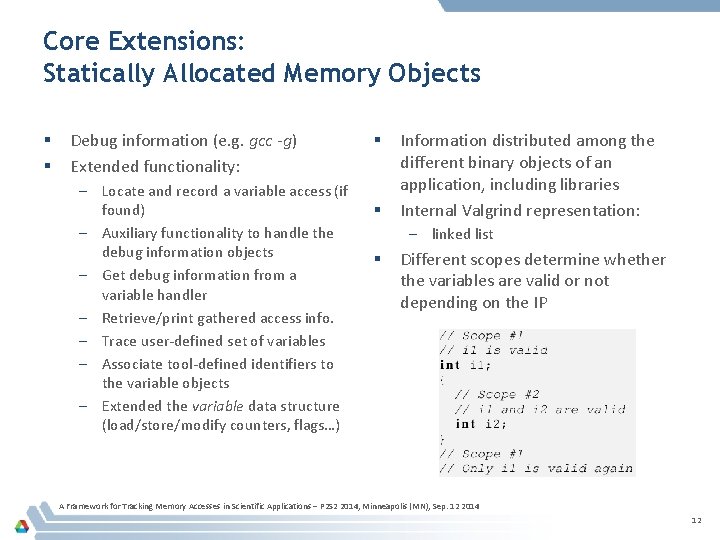
Core Extensions: Statically Allocated Memory Objects § § Debug information (e. g. gcc -g) Extended functionality: – Locate and record a variable access (if found) – Auxiliary functionality to handle the debug information objects – Get debug information from a variable handler – Retrieve/print gathered access info. – Trace user-defined set of variables – Associate tool-defined identifiers to the variable objects – Extended the variable data structure (load/store/modify counters, flags…) § § Information distributed among the different binary objects of an application, including libraries Internal Valgrind representation: – linked list § Different scopes determine whether the variables are valid or not depending on the IP A Framework for Tracking Memory Accesses in Scientific Applications – P 2 S 2 2014, Minneapolis (MN), Sep. 12 2014 12
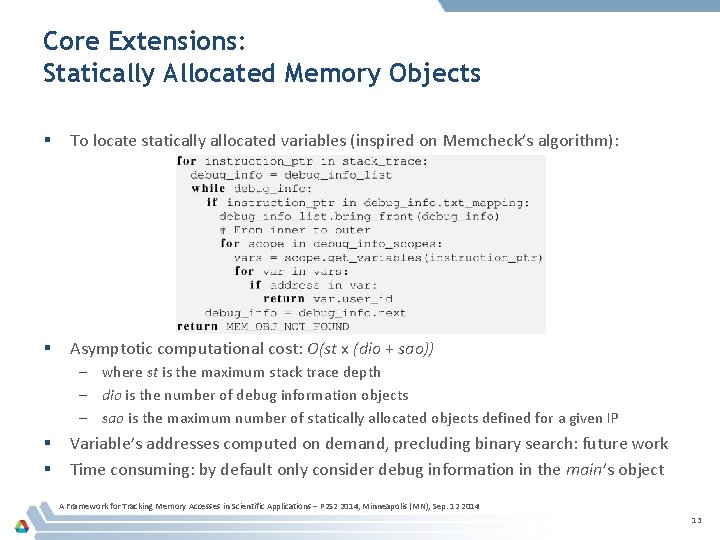
Core Extensions: Statically Allocated Memory Objects § To locate statically allocated variables (inspired on Memcheck’s algorithm): § Asymptotic computational cost: O(st x (dio + sao)) – where st is the maximum stack trace depth – dio is the number of debug information objects – sao is the maximum number of statically allocated objects defined for a given IP § § Variable’s addresses computed on demand, precluding binary search: future work Time consuming: by default only consider debug information in the main’s object A Framework for Tracking Memory Accesses in Scientific Applications – P 2 S 2 2014, Minneapolis (MN), Sep. 12 2014 13
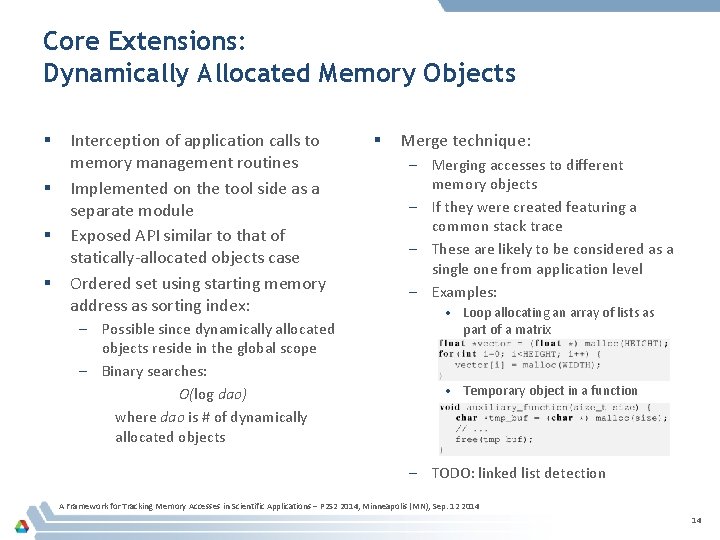
Core Extensions: Dynamically Allocated Memory Objects § § Interception of application calls to memory management routines Implemented on the tool side as a separate module Exposed API similar to that of statically-allocated objects case Ordered set using starting memory address as sorting index: – Possible since dynamically allocated objects reside in the global scope – Binary searches: O(log dao) where dao is # of dynamically allocated objects § Merge technique: – Merging accesses to different memory objects – If they were created featuring a common stack trace – These are likely to be considered as a single one from application level – Examples: • Loop allocating an array of lists as part of a matrix • Temporary object in a function – TODO: linked list detection A Framework for Tracking Memory Accesses in Scientific Applications – P 2 S 2 2014, Minneapolis (MN), Sep. 12 2014 14
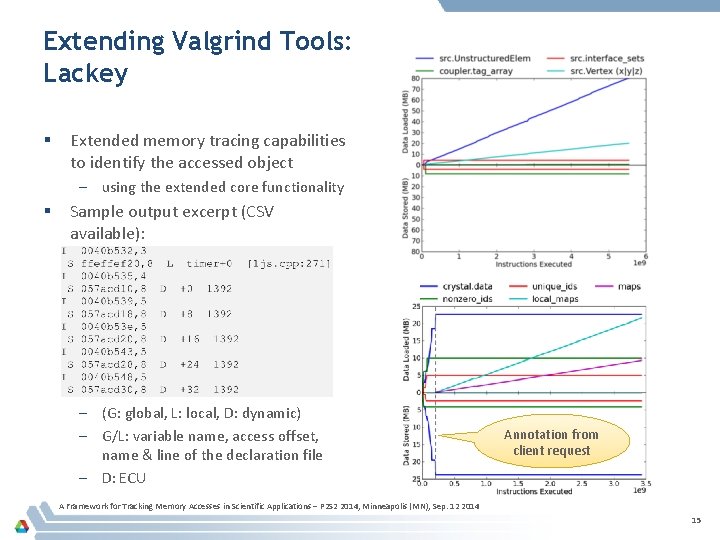
Extending Valgrind Tools: Lackey § Extended memory tracing capabilities to identify the accessed object – using the extended core functionality § Sample output excerpt (CSV available): – (G: global, L: local, D: dynamic) – G/L: variable name, access offset, name & line of the declaration file – D: ECU Annotation from client request A Framework for Tracking Memory Accesses in Scientific Applications – P 2 S 2 2014, Minneapolis (MN), Sep. 12 2014 15
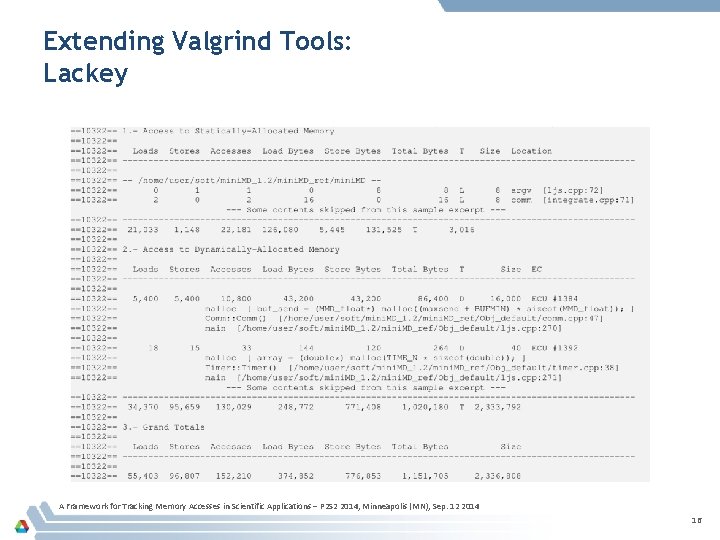
Extending Valgrind Tools: Lackey A Framework for Tracking Memory Accesses in Scientific Applications – P 2 S 2 2014, Minneapolis (MN), Sep. 12 2014 16
Extending Valgrind Tools: Callgrind § § § Similar approach as in Lackey to identify accesses to the different memory objects Now targeting cache misses, i. e. , accesses to the main memory Per-object cache misses Tracing capabilities Kcachegrind integration Heterogeneous memory… A Framework for Tracking Memory Accesses in Scientific Applications – P 2 S 2 2014, Minneapolis (MN), Sep. 12 2014 17
Heterogeneous Memory A Framework for Tracking Memory Accesses in Scientific Applications – P 2 S 2 2014, Minneapolis (MN), Sep. 12 2014 18
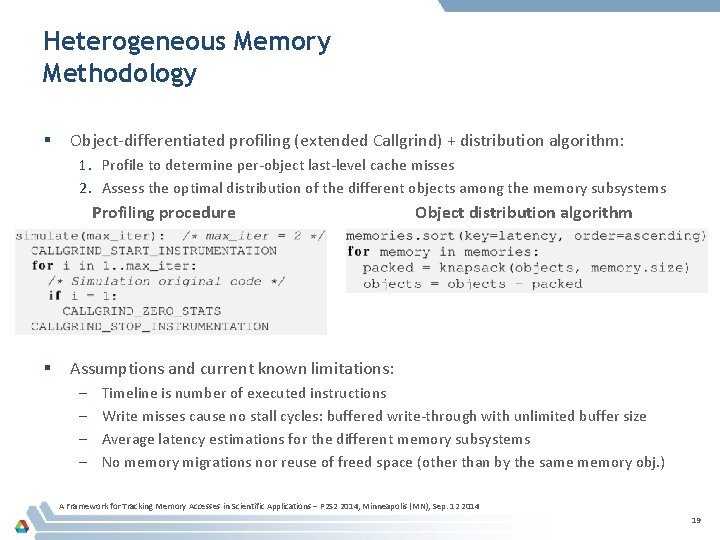
Heterogeneous Memory Methodology § Object-differentiated profiling (extended Callgrind) + distribution algorithm: 1. Profile to determine per-object last-level cache misses 2. Assess the optimal distribution of the different objects among the memory subsystems Profiling procedure § Object distribution algorithm Assumptions and current known limitations: – – Timeline is number of executed instructions Write misses cause no stall cycles: buffered write-through with unlimited buffer size Average latency estimations for the different memory subsystems No memory migrations nor reuse of freed space (other than by the same memory obj. ) A Framework for Tracking Memory Accesses in Scientific Applications – P 2 S 2 2014, Minneapolis (MN), Sep. 12 2014 19
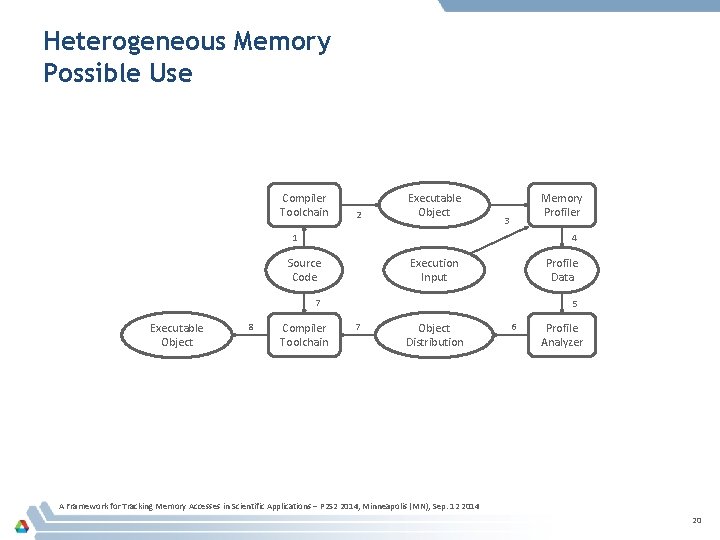
Heterogeneous Memory Possible Use Compiler Toolchain 2 Executable Object Memory Profiler 3 4 1 Execution Input Source Code Profile Data 7 Executable Object 8 Compiler Toolchain 5 7 Object Distribution 6 Profile Analyzer A Framework for Tracking Memory Accesses in Scientific Applications – P 2 S 2 2014, Minneapolis (MN), Sep. 12 2014 20
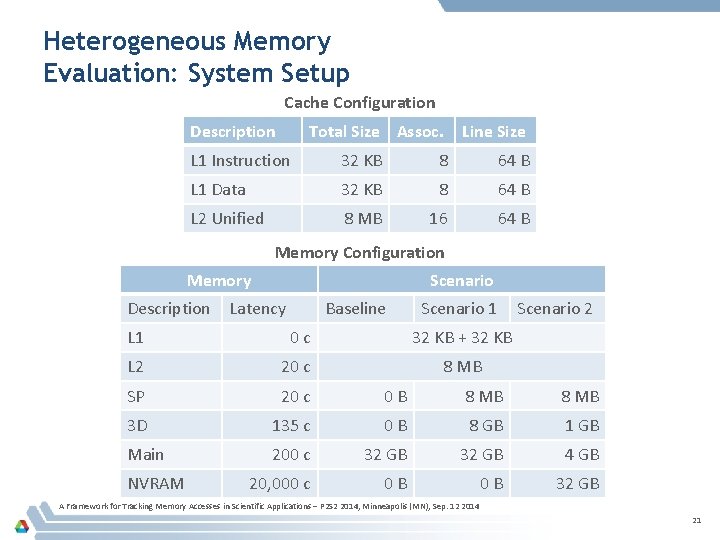
Heterogeneous Memory Evaluation: System Setup Cache Configuration Description Total Size Assoc. Line Size L 1 Instruction 32 KB 8 64 B L 1 Data 32 KB 8 64 B L 2 Unified 8 MB 16 64 B Memory Configuration Memory Description Scenario Latency Baseline Scenario 1 Scenario 2 L 1 0 c 32 KB + 32 KB L 2 20 c 8 MB SP 20 c 0 B 8 MB 3 D 135 c 0 B 8 GB 1 GB Main 200 c 32 GB 4 GB 20, 000 c 0 B 0 B 32 GB NVRAM A Framework for Tracking Memory Accesses in Scientific Applications – P 2 S 2 2014, Minneapolis (MN), Sep. 12 2014 21
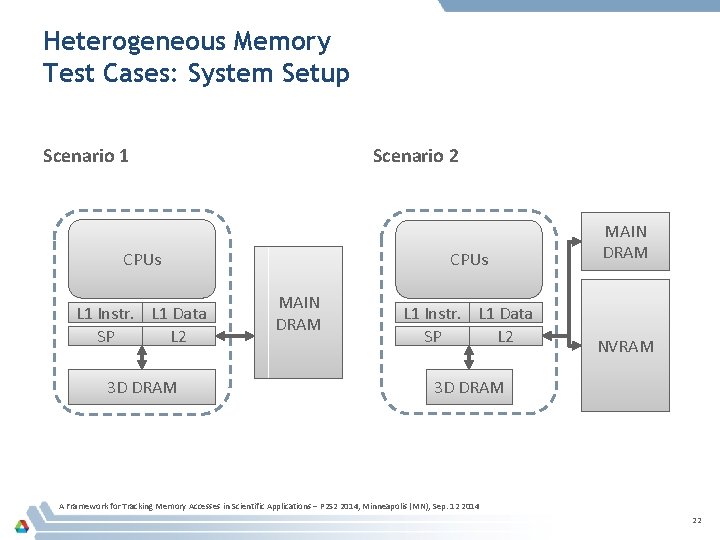
Heterogeneous Memory Test Cases: System Setup Scenario 1 Scenario 2 CPUs L 1 Instr. L 1 Data SP L 2 3 D DRAM CPUs MAIN DRAM L 1 Instr. L 1 Data SP L 2 MAIN DRAM NVRAM 3 D DRAM A Framework for Tracking Memory Accesses in Scientific Applications – P 2 S 2 2014, Minneapolis (MN), Sep. 12 2014 22
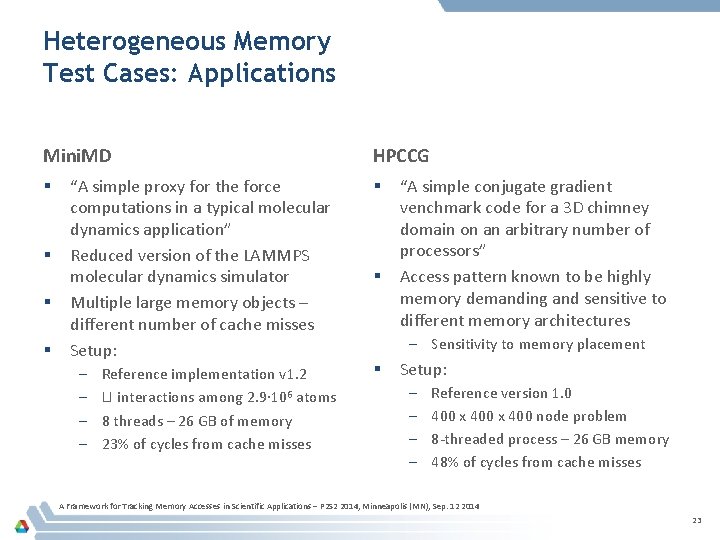
Heterogeneous Memory Test Cases: Applications Mini. MD § § “A simple proxy for the force computations in a typical molecular dynamics application” Reduced version of the LAMMPS molecular dynamics simulator Multiple large memory objects – different number of cache misses Setup: – – Reference implementation v 1. 2 LJ interactions among 2. 9· 106 atoms 8 threads – 26 GB of memory 23% of cycles from cache misses HPCCG § § “A simple conjugate gradient venchmark code for a 3 D chimney domain on an arbitrary number of processors” Access pattern known to be highly memory demanding and sensitive to different memory architectures – Sensitivity to memory placement § Setup: – – Reference version 1. 0 400 x 400 node problem 8 -threaded process – 26 GB memory 48% of cycles from cache misses A Framework for Tracking Memory Accesses in Scientific Applications – P 2 S 2 2014, Minneapolis (MN), Sep. 12 2014 23
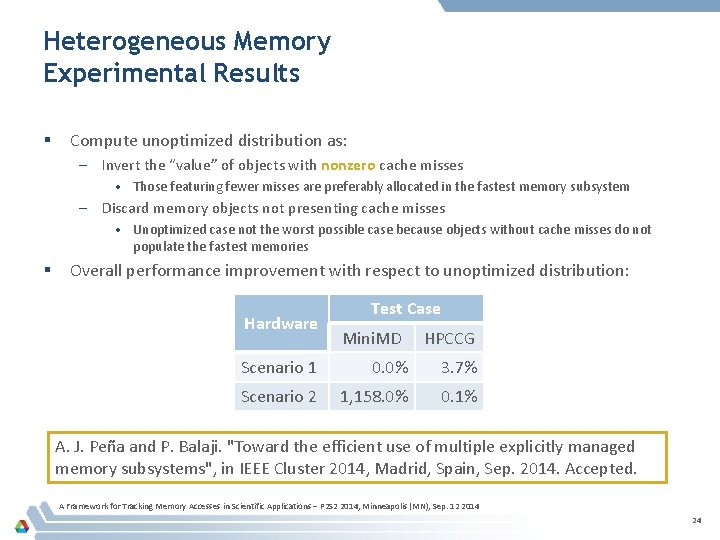
Heterogeneous Memory Experimental Results § Compute unoptimized distribution as: – Invert the “value” of objects with nonzero cache misses • Those featuring fewer misses are preferably allocated in the fastest memory subsystem – Discard memory objects not presenting cache misses • Unoptimized case not the worst possible case because objects without cache misses do not populate the fastest memories § Overall performance improvement with respect to unoptimized distribution: Hardware Test Case Mini. MD HPCCG Scenario 1 0. 0% 3. 7% Scenario 2 1, 158. 0% 0. 1% A. J. Peña and P. Balaji. "Toward the efficient use of multiple explicitly managed memory subsystems", in IEEE Cluster 2014, Madrid, Spain, Sep. 2014. Accepted. A Framework for Tracking Memory Accesses in Scientific Applications – P 2 S 2 2014, Minneapolis (MN), Sep. 12 2014 24
Conclusions A Framework for Tracking Memory Accesses in Scientific Applications – P 2 S 2 2014, Minneapolis (MN), Sep. 12 2014 25
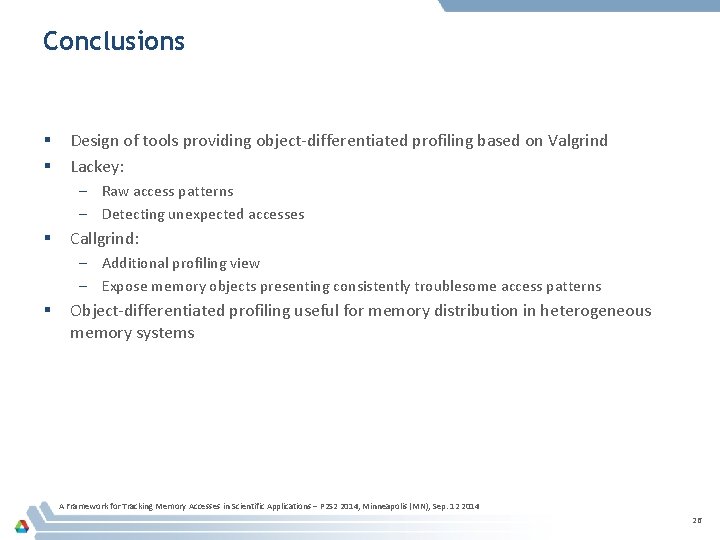
Conclusions § § Design of tools providing object-differentiated profiling based on Valgrind Lackey: – Raw access patterns – Detecting unexpected accesses § Callgrind: – Additional profiling view – Expose memory objects presenting consistently troublesome access patterns § Object-differentiated profiling useful for memory distribution in heterogeneous memory systems A Framework for Tracking Memory Accesses in Scientific Applications – P 2 S 2 2014, Minneapolis (MN), Sep. 12 2014 26
apenya@mcs. anl. gov A Framework for Tracking Memory Accesses in Scientific Applications – P 2 S 2 2014, Minneapolis (MN), Sep. 12 2014 27