High Moisture Corn Drying and Storage Kenneth Hellevang



- Slides: 30
High Moisture Corn Drying and Storage Kenneth Hellevang, Ph. D. , P. E. Extension Engineer & Professor
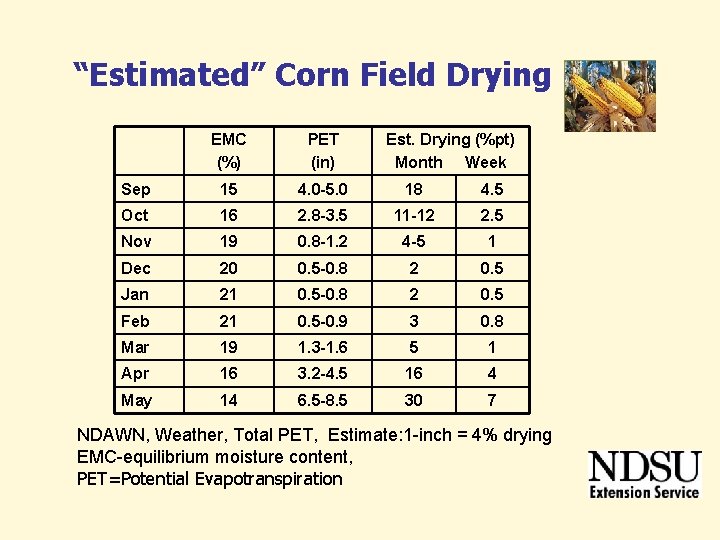
“Estimated” Corn Field Drying EMC (%) PET (in) Est. Drying (%pt) Month Week Sep 15 4. 0 -5. 0 18 4. 5 Oct 16 2. 8 -3. 5 11 -12 2. 5 Nov 19 0. 8 -1. 2 4 -5 1 Dec 20 0. 5 -0. 8 2 0. 5 Jan 21 0. 5 -0. 8 2 0. 5 Feb 21 0. 5 -0. 9 3 0. 8 Mar 19 1. 3 -1. 6 5 1 Apr 16 3. 2 -4. 5 16 4 May 14 6. 5 -8. 5 30 7 NDAWN, Weather, Total PET, Estimate: 1 -inch = 4% drying EMC-equilibrium moisture content, PET=Potential Evapotranspiration
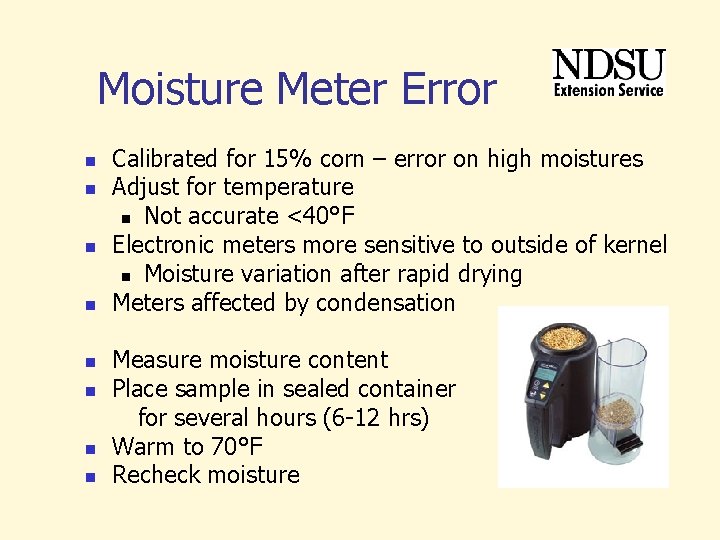
Moisture Meter Error n n n n Calibrated for 15% corn – error on high moistures Adjust for temperature n Not accurate <40°F Electronic meters more sensitive to outside of kernel n Moisture variation after rapid drying Meters affected by condensation Measure moisture content Place sample in sealed container for several hours (6 -12 hrs) Warm to 70°F Recheck moisture
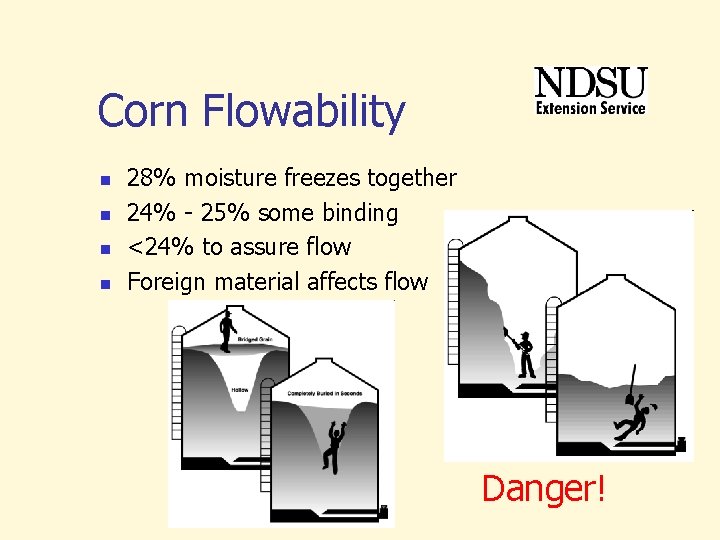
Corn Flowability n n 28% moisture freezes together 24% - 25% some binding <24% to assure flow Foreign material affects flow Danger!
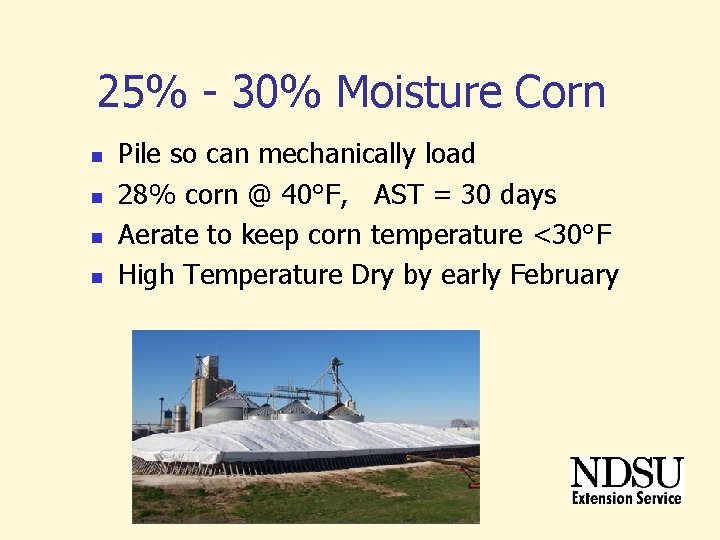
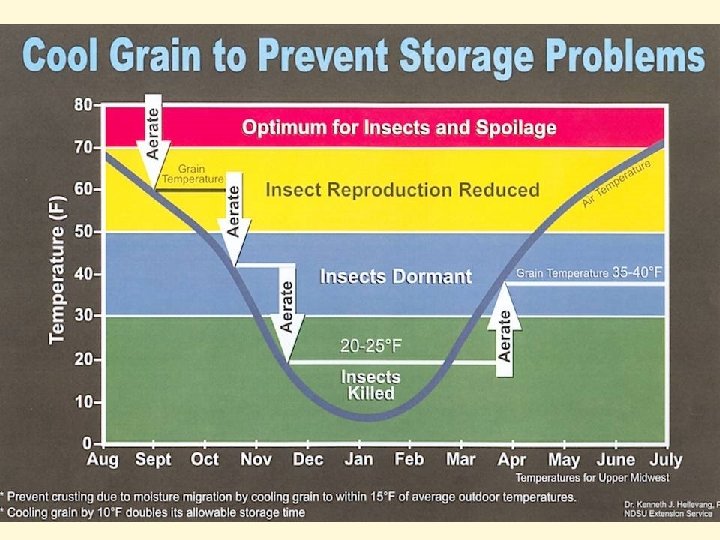
25% - 30% Moisture Corn n n Pile so can mechanically load 28% corn @ 40°F, AST = 30 days Aerate to keep corn temperature <30°F High Temperature Dry by early February
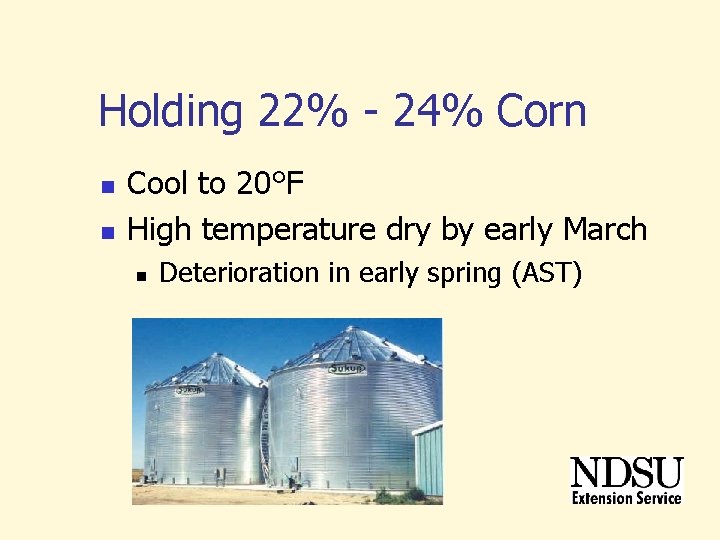
Holding 22% - 24% Corn n n Cool to 20°F High temperature dry by early March n Deterioration in early spring (AST)
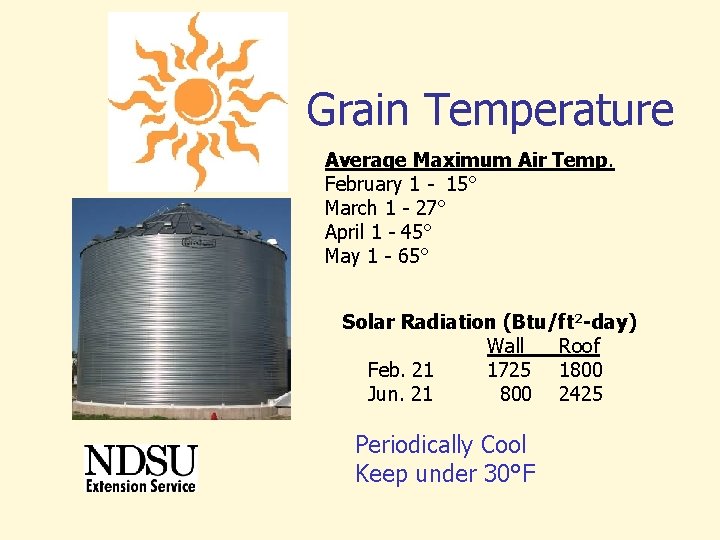
Grain Temperature Average Maximum Air Temp. February 1 - 15° March 1 - 27° April 1 - 45° May 1 - 65° Solar Radiation (Btu/ft 2 -day) Wall Roof Feb. 21 1725 1800 Jun. 21 800 2425 Periodically Cool Keep under 30°F
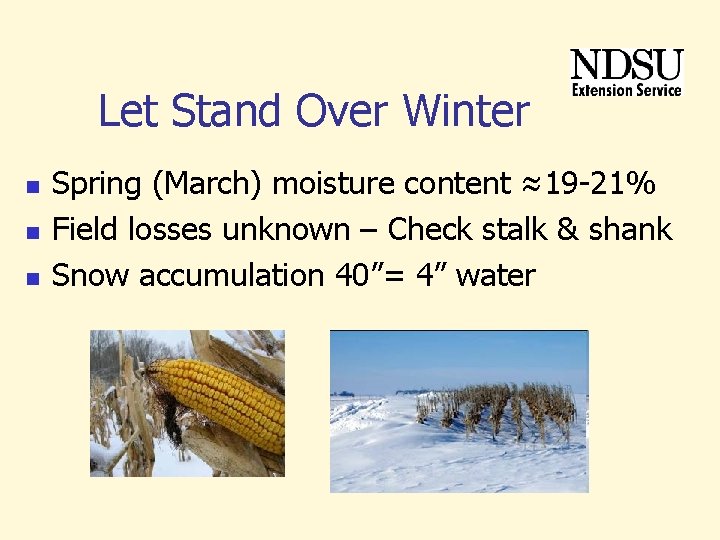
Let Stand Over Winter n n n Spring (March) moisture content ≈19 -21% Field losses unknown – Check stalk & shank Snow accumulation 40”= 4” water
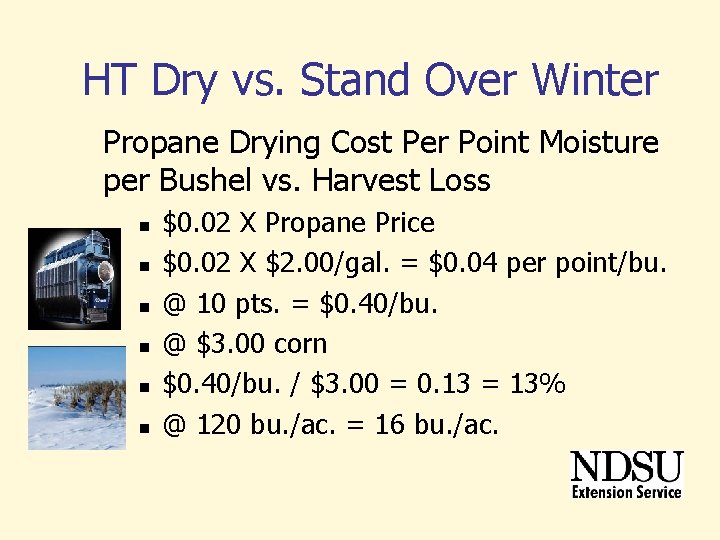
HT Dry vs. Stand Over Winter Propane Drying Cost Per Point Moisture per Bushel vs. Harvest Loss n n n $0. 02 X Propane Price $0. 02 X $2. 00/gal. = $0. 04 per point/bu. @ 10 pts. = $0. 40/bu. @ $3. 00 corn $0. 40/bu. / $3. 00 = 0. 13 = 13% @ 120 bu. /ac. = 16 bu. /ac.
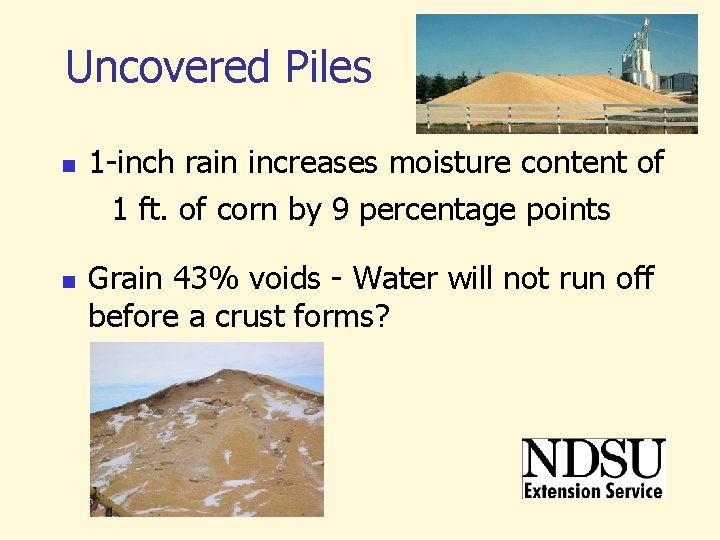
Uncovered Piles n n 1 -inch rain increases moisture content of 1 ft. of corn by 9 percentage points Grain 43% voids - Water will not run off before a crust forms?
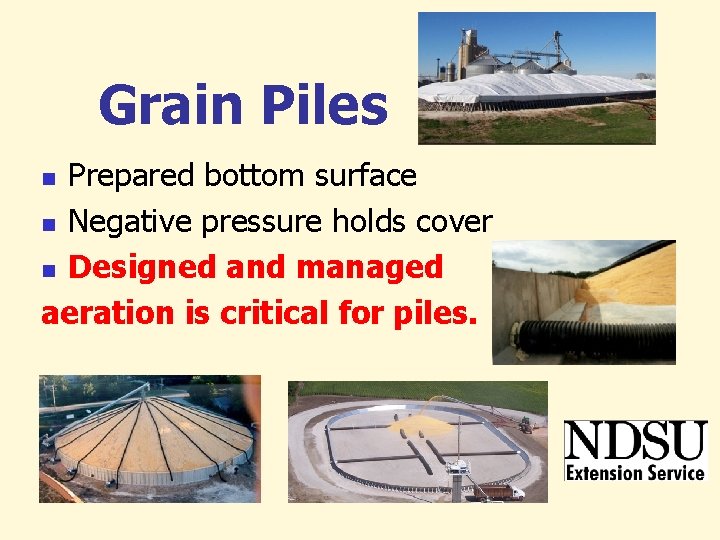
Grain Piles Prepared bottom surface n Negative pressure holds cover n Designed and managed aeration is critical for piles. n
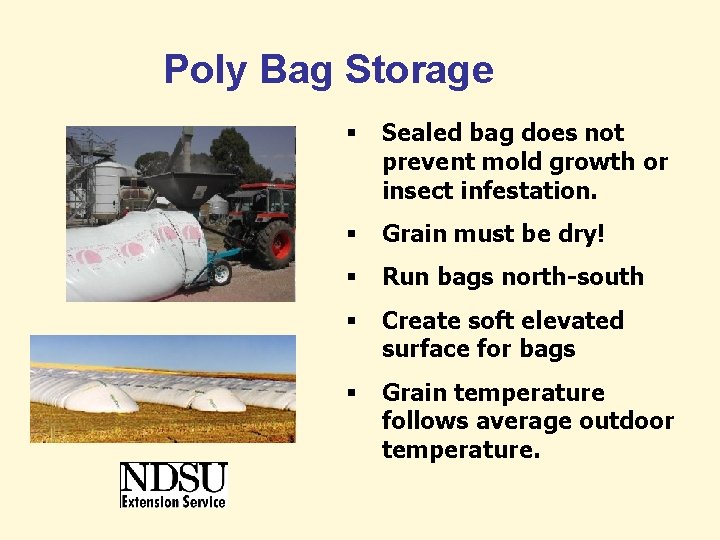
Poly Bag Storage § Sealed bag does not prevent mold growth or insect infestation. § Grain must be dry! § Run bags north-south § Create soft elevated surface for bags § Grain temperature follows average outdoor temperature.
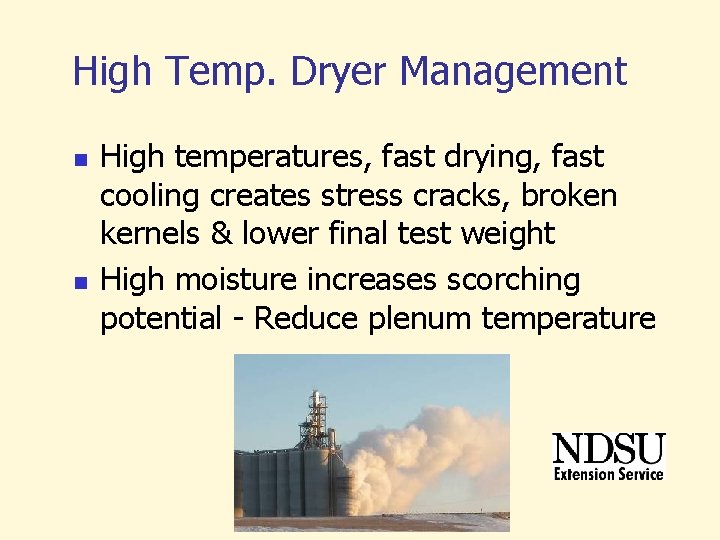
High Temp. Dryer Management n n High temperatures, fast drying, fast cooling creates stress cracks, broken kernels & lower final test weight High moisture increases scorching potential - Reduce plenum temperature
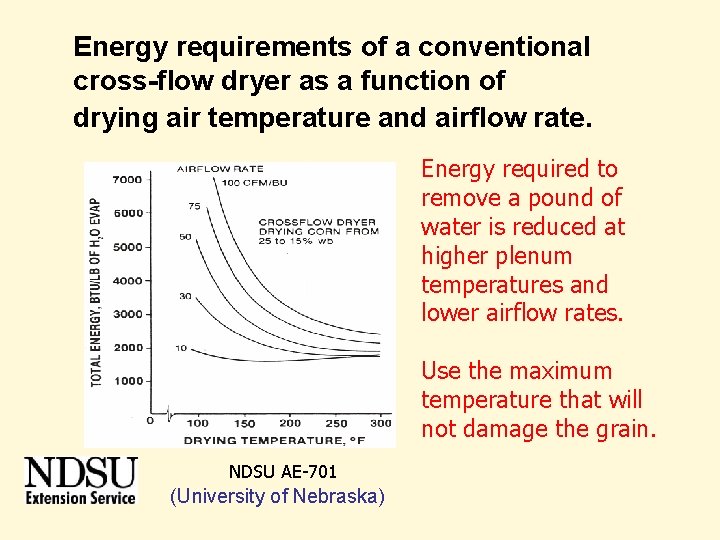
Energy requirements of a conventional cross-flow dryer as a function of drying air temperature and airflow rate. Energy required to remove a pound of water is reduced at higher plenum temperatures and lower airflow rates. Use the maximum temperature that will not damage the grain. NDSU AE-701 (University of Nebraska)
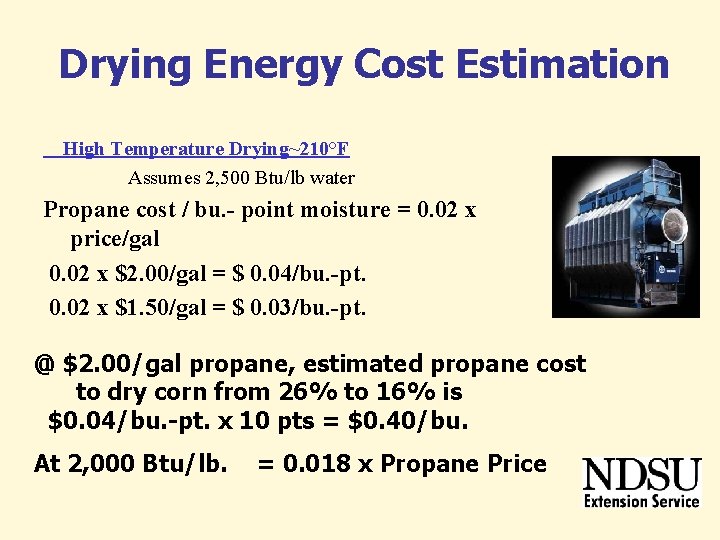
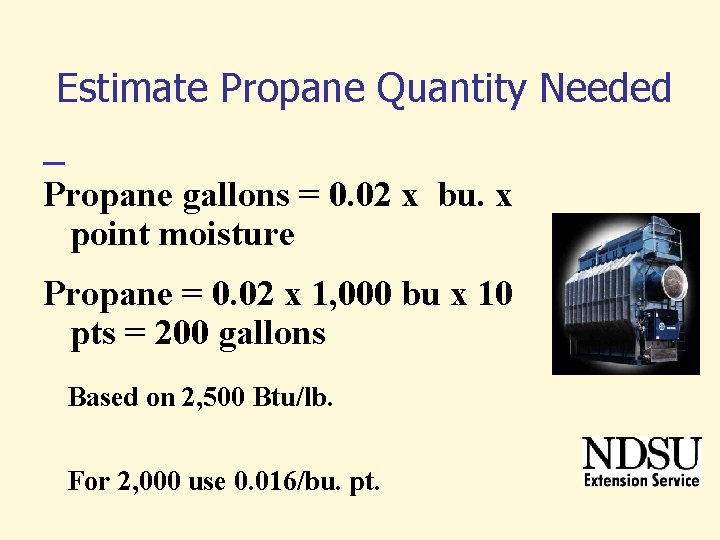
Drying Energy Cost Estimation High Temperature Drying~210°F Assumes 2, 500 Btu/lb water Propane cost / bu. - point moisture = 0. 02 x price/gal 0. 02 x $2. 00/gal = $ 0. 04/bu. -pt. 0. 02 x $1. 50/gal = $ 0. 03/bu. -pt. @ $2. 00/gal propane, estimated propane cost to dry corn from 26% to 16% is $0. 04/bu. -pt. x 10 pts = $0. 40/bu. At 2, 000 Btu/lb. = 0. 018 x Propane Price
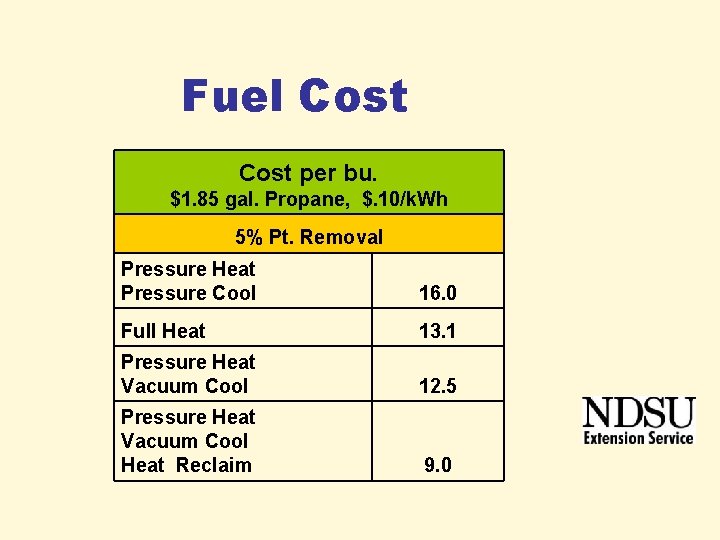
Fuel Cost per bu. $1. 85 gal. Propane, $. 10/k. Wh 5% Pt. Removal Pressure Heat Pressure Cool 16. 0 Full Heat 13. 1 Pressure Heat Vacuum Cool 12. 5 Pressure Heat Vacuum Cool Heat Reclaim 9. 0
Estimate Propane Quantity Needed Propane gallons = 0. 02 x bu. x point moisture Propane = 0. 02 x 1, 000 bu x 10 pts = 200 gallons Based on 2, 500 Btu/lb. For 2, 000 use 0. 016/bu. pt.
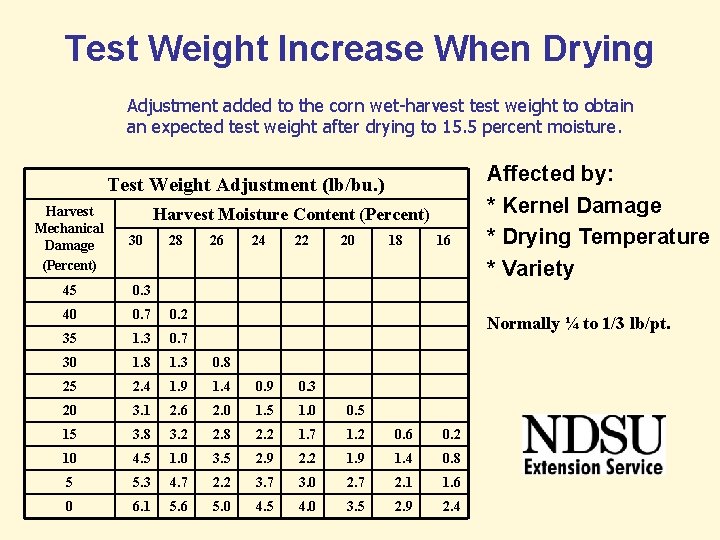
Test Weight Increase When Drying Adjustment added to the corn wet-harvest test weight to obtain an expected test weight after drying to 15. 5 percent moisture. Test Weight Adjustment (lb/bu. ) Harvest Mechanical Damage (Percent) Harvest Moisture Content (Percent) 30 28 26 24 22 20 18 16 45 0. 3 40 0. 7 0. 2 35 1. 3 0. 7 30 1. 8 1. 3 0. 8 25 2. 4 1. 9 1. 4 0. 9 0. 3 20 3. 1 2. 6 2. 0 1. 5 1. 0 0. 5 15 3. 8 3. 2 2. 8 2. 2 1. 7 1. 2 0. 6 0. 2 10 4. 5 1. 0 3. 5 2. 9 2. 2 1. 9 1. 4 0. 8 5 5. 3 4. 7 2. 2 3. 7 3. 0 2. 7 2. 1 1. 6 0 6. 1 5. 6 5. 0 4. 5 4. 0 3. 5 2. 9 2. 4 Affected by: * Kernel Damage * Drying Temperature * Variety Normally ¼ to 1/3 lb/pt.
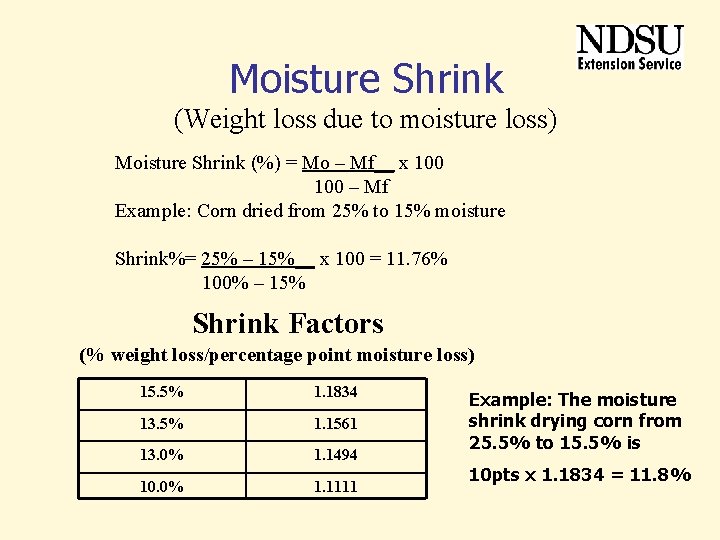
Moisture Shrink (Weight loss due to moisture loss) Moisture Shrink (%) = Mo – Mf__ x 100 – Mf Example: Corn dried from 25% to 15% moisture Shrink%= 25% – 15%__ x 100 = 11. 76% 100% – 15% Shrink Factors (% weight loss/percentage point moisture loss) 15. 5% 1. 1834 13. 5% 1. 1561 13. 0% 1. 1494 10. 0% 1. 1111 Example: The moisture shrink drying corn from 25. 5% to 15. 5% is 10 pts x 1. 1834 = 11. 8%
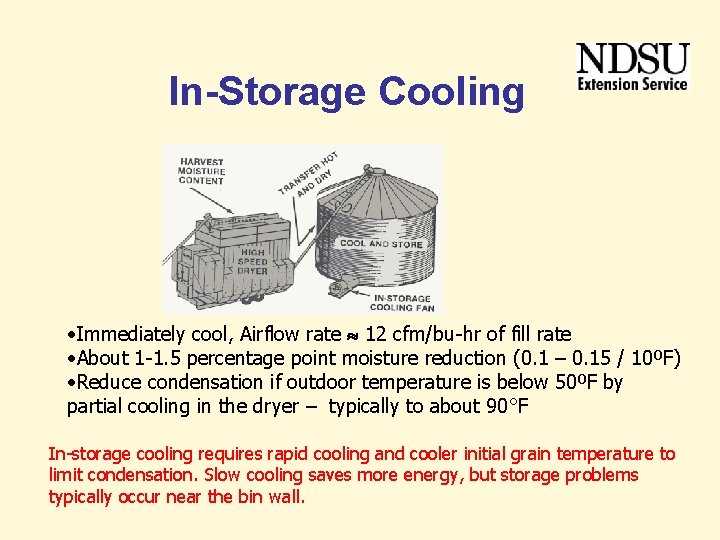
In-Storage Cooling • Immediately cool, Airflow rate 12 cfm/bu-hr of fill rate • About 1 -1. 5 percentage point moisture reduction (0. 1 – 0. 15 / 10ºF) • Reduce condensation if outdoor temperature is below 50ºF by partial cooling in the dryer – typically to about 90°F In-storage cooling requires rapid cooling and cooler initial grain temperature to limit condensation. Slow cooling saves more energy, but storage problems typically occur near the bin wall.
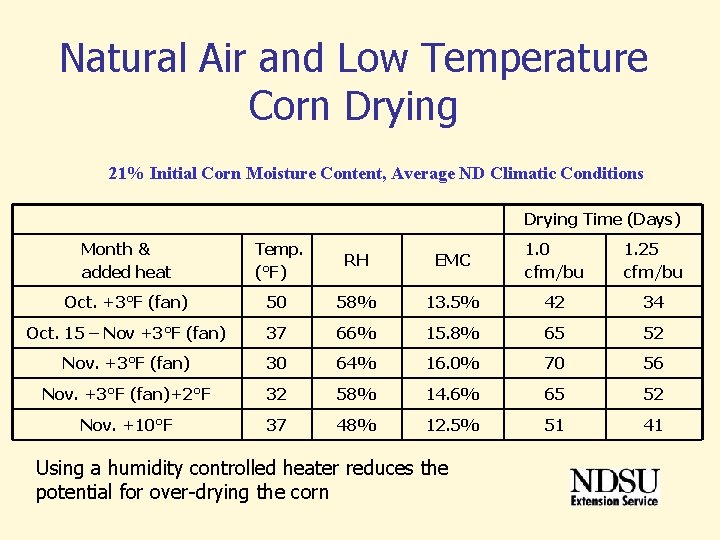
Natural Air and Low Temperature Corn Drying 21% Initial Corn Moisture Content, Average ND Climatic Conditions Drying Time (Days) Month & added heat Temp. (°F) RH EMC 1. 0 cfm/bu 1. 25 cfm/bu Oct. +3°F (fan) 50 58% 13. 5% 42 34 Oct. 15 – Nov +3°F (fan) 37 66% 15. 8% 65 52 Nov. +3°F (fan) 30 64% 16. 0% 70 56 Nov. +3°F (fan)+2°F 32 58% 14. 6% 65 52 Nov. +10°F 37 48% 12. 5% 51 41 Using a humidity controlled heater reduces the potential for over-drying the corn
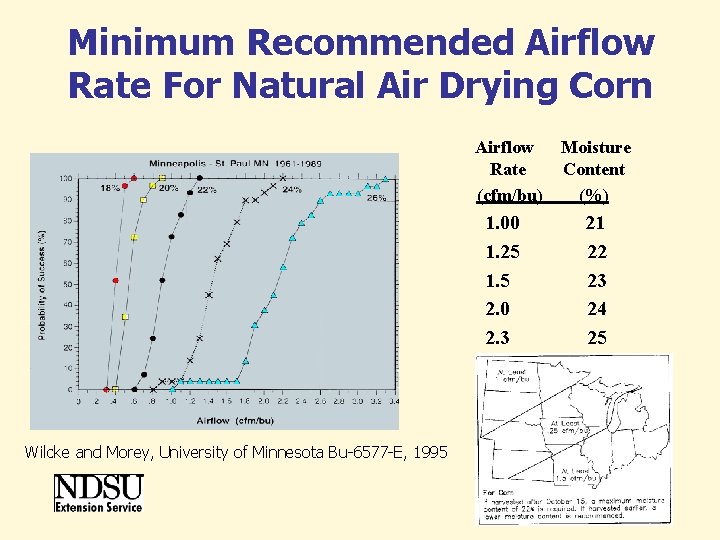
Minimum Recommended Airflow Rate For Natural Air Drying Corn Airflow Rate (cfm/bu) 1. 00 1. 25 1. 5 2. 0 2. 3 Wilcke and Morey, University of Minnesota Bu-6577 -E, 1995 Moisture Content (%) 21 22 23 24 25
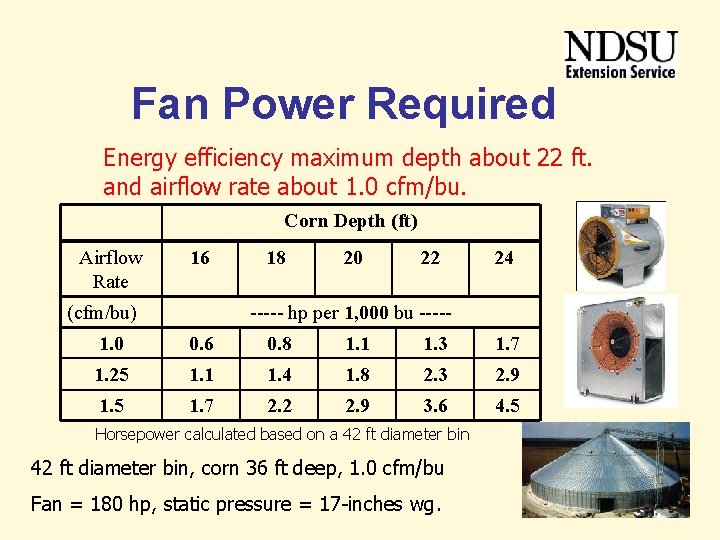
Fan Power Required Energy efficiency maximum depth about 22 ft. and airflow rate about 1. 0 cfm/bu. Corn Depth (ft) Airflow Rate 16 (cfm/bu) 18 20 22 24 ----- hp per 1, 000 bu ----- 1. 0 0. 6 0. 8 1. 1 1. 3 1. 7 1. 25 1. 1 1. 4 1. 8 2. 3 2. 9 1. 5 1. 7 2. 2 2. 9 3. 6 4. 5 Horsepower calculated based on a 42 ft diameter bin, corn 36 ft deep, 1. 0 cfm/bu Fan = 180 hp, static pressure = 17 -inches wg.
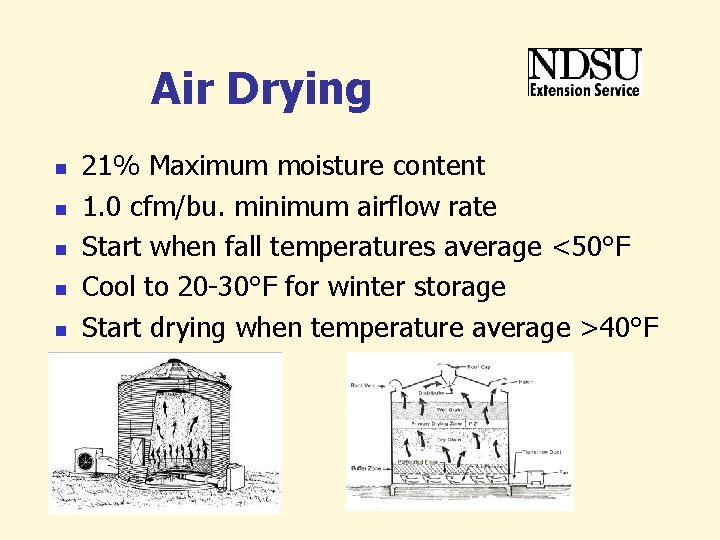
Air Drying n n n 21% Maximum moisture content 1. 0 cfm/bu. minimum airflow rate Start when fall temperatures average <50°F Cool to 20 -30°F for winter storage Start drying when temperature average >40°F
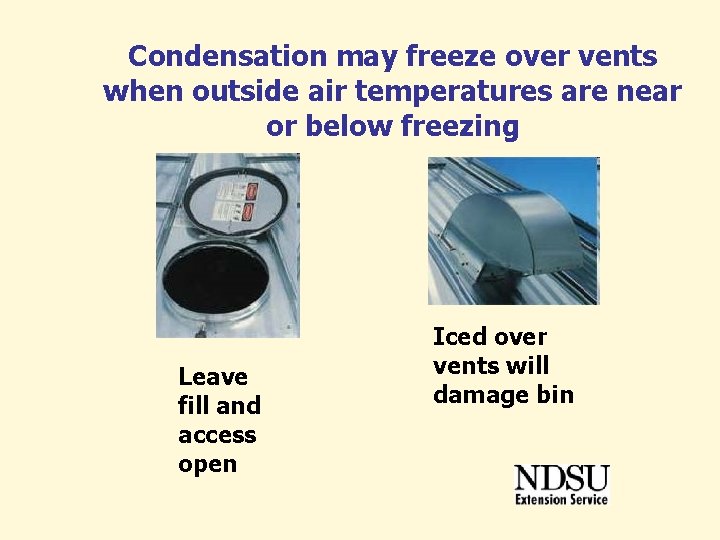
Condensation may freeze over vents when outside air temperatures are near or below freezing Leave fill and access open Iced over vents will damage bin
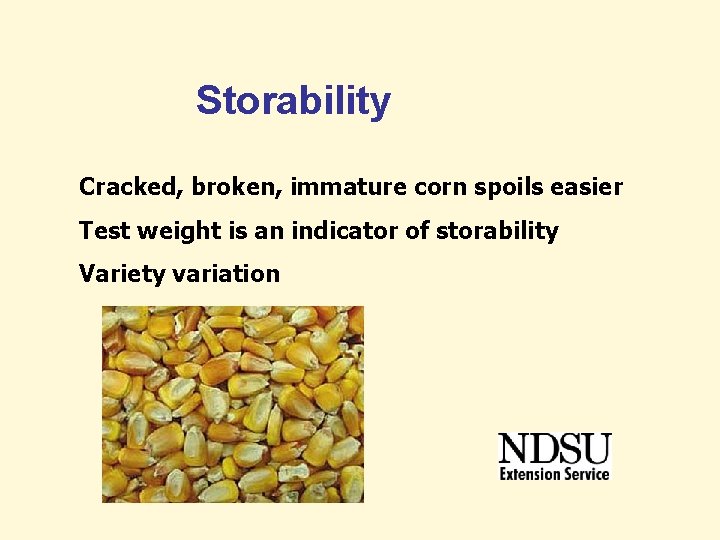
Storability Cracked, broken, immature corn spoils easier Test weight is an indicator of storability Variety variation
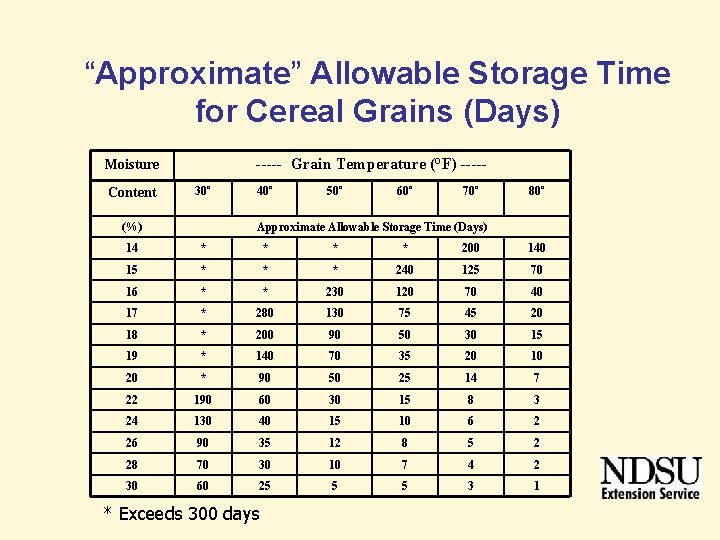
“Approximate” Allowable Storage Time for Cereal Grains (Days) ----- Grain Temperature (°F) ----- Moisture Content 30º (%) 40º 50º 60º 70º 80º Approximate Allowable Storage Time (Days) 14 * * 200 140 15 * * * 240 125 70 16 * * 230 120 70 40 17 * 280 130 75 45 20 18 * 200 90 50 30 15 19 * 140 70 35 20 10 20 * 90 50 25 14 7 22 190 60 30 15 8 3 24 130 40 15 10 6 2 26 90 35 12 8 5 2 28 70 30 10 7 4 2 30 60 25 5 5 3 1 * Exceeds 300 days
Grain Hazards Bridging transfers load to the bin wall CAUGHT IN THE GRAIN! AE-1102 Ice on blade may cause it to disintegrate Moldy Grain Health Hazard
For More Information Internet Search: NDSU Grain Drying & Storage