Geology 66907690 13 Nov 2019 Geodesy Crustal Deformation

 domes in Yellowstone caldera")
. . .")
 stack of 1600 In. SAR interferograms from 1992 -2001…")


 was then")
, four parameters of source location and")


- Slides: 13
Geology 6690/7690 13 Nov 2019 Geodesy & Crustal Deformation Last time: Dislocation Green’s functions • Point source (simpler) or e. g. rectangular • Pressure/volume change (simpler) or full moment tensor (I) Mogi model… • Inflation/Deflation of a fluid inclusion point source in an elastic half-space produces displacements: • Deformation from Soccoro magma body (no surface extrusives!) during 1992 -1997 was large enough to overwhelm tectonic signal out to >100 km radius; Rio Grande rift GPS data 2005 -2012 show divergence from several locations © A. R. Lowry 2019
Last time Cont’d: Mogi modeling • ~100 s m (non-extrusive) domes in Yellowstone caldera are easily recognized as response to magmatic inflation • But… what about small-scale domal uplift on RGR basalt flows? Or for that matter, elongate Laramide “monoclinal” uplifts like the San Rafael swell? • MT imaging shows lower crustal melts are widespread! Read for Monday (18 Nov): Michel, S. , et al. ”Similar scaling laws for earthquakes and Cascadia slow-slip events. ” Nature 574 (2019): 522 -526
Magnetotelluric imaging of electrical conductivity structure by Meqbel et al. (EPSL 2014). . . Resistivity less than ~10 Ohm-m in the lower crust “could be” graphite and/or sulfides, but is much more probably partial melts. . . How might we expect deformation to behave in the presence of a widespread low-viscosity layer?
Greene, Amelung et al. (2014) stack of 1600 In. SAR interferograms from 1992 -2001… Chamoli et al. , JGR 2014
Lowry et al. , J Volcanol Geotherm Res, 2001 Taal volcano: “Yellowstone-like” silicic caldera complex in the Philippines (last small basaltic eruption, 1967, killed ~500)
1999 “unrest” episode accompanied by fumarole activity (formation of a ~500 m high mud volcano in Main Crater Lake!)
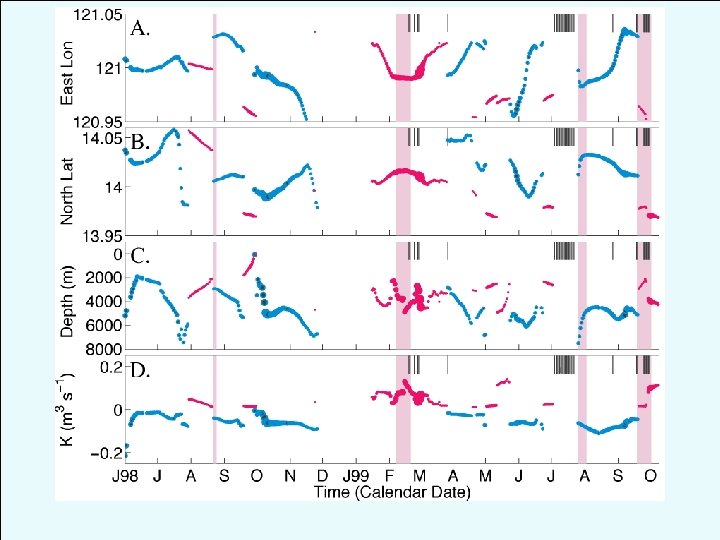
Conversion to velocity (using a 60 -day triangular window to calculate slope) was then modeled as a Mogi point source at each daily coordinate
With only three local sites (six independent observations), four parameters of source location and magnitude are stable only when SNR is very high…
Bartel et al. , J Geophys Res, 2003 More spatial sampling + longer time averaging = more robust…
Bartel et al. , J Geophys Res, 2003
Fault Slip Modeling & the Earthquake Cycle As with volcano deformation modeling, most modeling of fault slip uses dislocation Green’s functions. These models differ from Mogi models in that dislocations: • are tensors rather than scalars • are typically uniform over a rectangular area (Okada!) (although distributions of point sources are sometimes used, and there are other expressions) • hence have additional parameters Mogi source: X, Y, Z, & a scalar “size” ( V &/or P) Fault dislocation: Also has length, width, strike, dip, & two components of slip Both point source & rectangular source formulations for surface displacement were calculated by Okada (1985). Formulations for internal displacement, strain & stress are given by Okada (1992) (both in Bull. Seismol. Soc. Am. )
A single rectangular fault dislocation has nine parameters: • X, Y, Z location • Strike , dip • Width W, length L • Strike- and dip-slip components of slip vector The slip vector relates linearly to observations; all other parameters are nonlinear. M is often reduced by constraining to an independently-known fault surface…