Forensic Entomology Maggots and Time of Death Estimation


 • Forensic Entomology - used to determine time since death (the")


 From To Egg 1 st Instar Temp")


- Slides: 18
Forensic Entomology Maggots and Time of Death Estimation
Entomology is the Study of Insects Images from: www. afpmb. org/military_entomology/usar myento/files/Army. Entomology. ppt
What is Forensic Entomology? • Forensic Entomology is the use of the insects and other arthropods that feed on decaying remains to help determine time of death. Other uses include movement of the corpse detection of toxins, drugs, or even the DNA of the victim through analysis of insect larvae.
Postmortem interval (PMI) • Forensic Entomology - used to determine time since death (the time between death and corpse discovery)
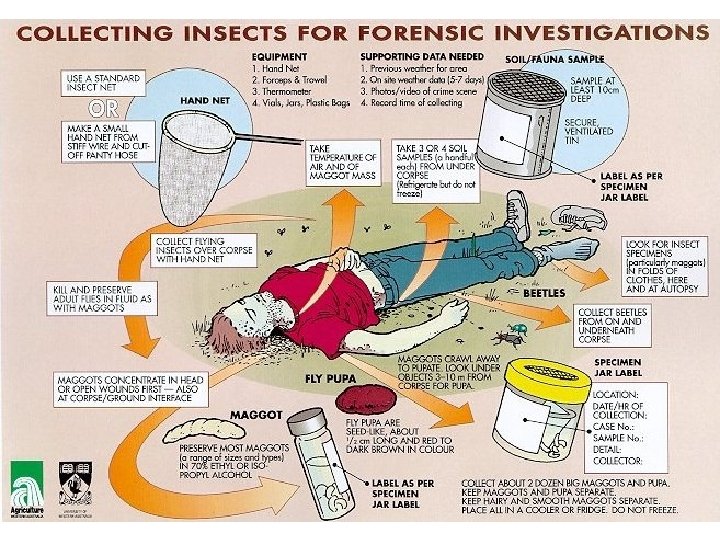
Forensic Entomology is Applied Biology • A forensic entomologist: – identifies the immature insects – determines the size and development of the insects – calculates the growth of the insects and passage through stages of the life cycle in laboratory – compares the growth against weather conditions to estimate time of oviposition
Succession of Insects on the Corpse • Estimates of postmortem intervals based on insects present on the remains are based on: • The time required for a given species to reach a particular stage of development. • Comparisons of all insect species present on the remains at the time of examination. • Ecological succession occurs as an unexploited habitat (like a corpse) is invaded by a series of different organisms. • The first invasion is by insect species which will alter the habitat in some form by their activities. These changes make the habitat attractive to a second wave of organisms which, in turn, alter the habitat for use by yet another organisms.
• Insect species arrive at a corpse in waves like clockwork
Image: http: //www. nlm. nih. gov/visibleproofs
Decay Rates Are Variable • Most important environment factors in corpse decay: • Temperature • Access by insects • Depth of burial • Other Factors • Chemical-- embalming agent, insecticides, lime, etc. • Animals disrupting the corpse
Time of Death can be broadly estimated up to about 36 hours Temperature Stiffness Time of death Warm Not stiff Dead less than three hours Warm Stiff Dead between 3 to 8 hours Cold Stiff Dead between 8 to 36 hours Cold Not stiff Dead in more than 36 hours
Calculating PMI from Accumulated Degree Hours (ADH) From To Egg 1 st Instar Temp Hours ADH Cumulative ADH 70° F 23 23 x 70= 1610 ADH 1610 1 st Instar 2 nd Instar 70 ° F 27 27 x 70= 1890 ADH 1610+ 1890 2 nd Instar 3 rd Instar 70 ° F 22 22 x 70= 1540 ADH 1610+1890+ 1540 3 rd Instar Pupa 70 ° F 130 x 70= 1610+1890+ 9100 ADH 1540+9100 Pupa Adult Fly 70 ° F 143 x 70= 1610+1890+ 10010 ADH 1540+9100 +10010
Calculating ADH from Climate Data
Phormia regina Spiracles are incomplete Third-instar larvae
Phaenicia species Spiracles are complete Third-instar larvae
Two Different Maggot Generations • These are distinguishable by the length and obvious size difference. • This is why we believe there are two peaks in our graph data for the Sunlit Pig. • The photograph was taken at a time consistent with the influx at 132 hours.
The End