Firsthalf 2008 results 28 August 2008 Contents 1






- Slides: 51
First-half 2008 results 28 August 2008
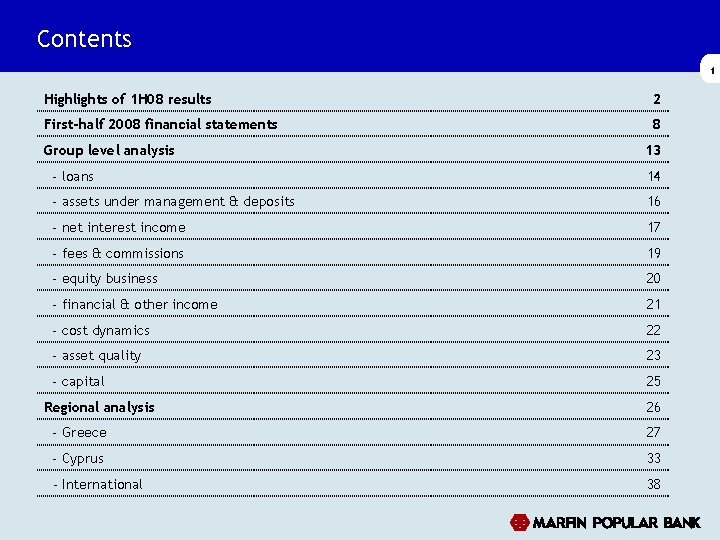
Contents 1 Highlights of 1 H 08 results 2 First-half 2008 financial statements 8 Group level analysis 13 - loans 14 - assets under management & deposits 16 - net interest income 17 - fees & commissions 19 - equity business 20 - financial & other income 21 - cost dynamics 22 - asset quality 23 - capital 25 Regional analysis 26 - Greece 27 - Cyprus 33 - International 38
Highlights of 1 H 08 results
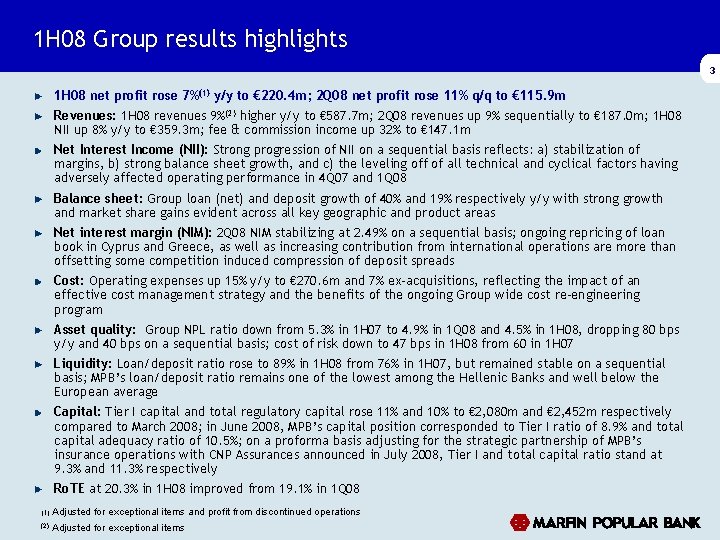
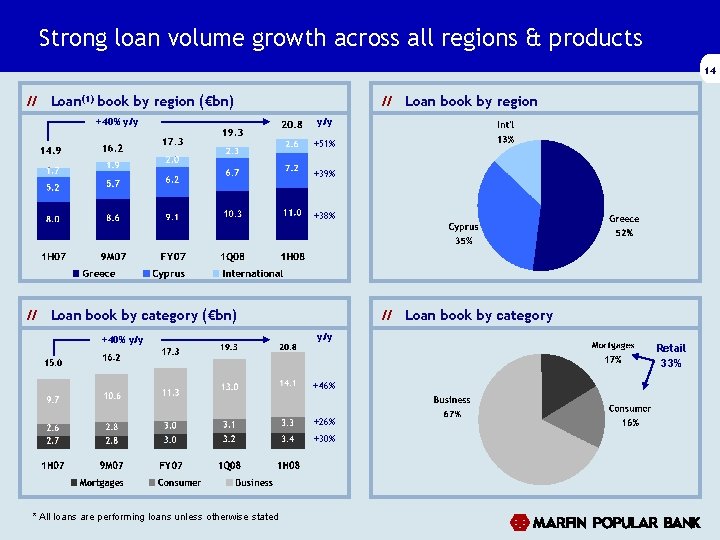
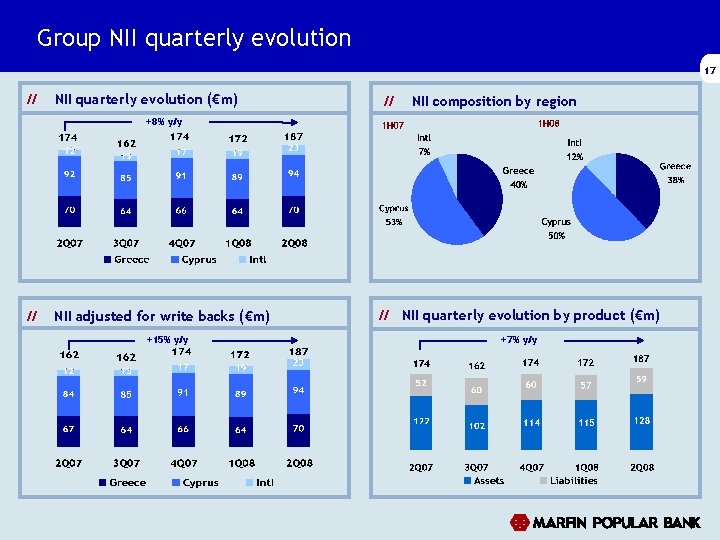
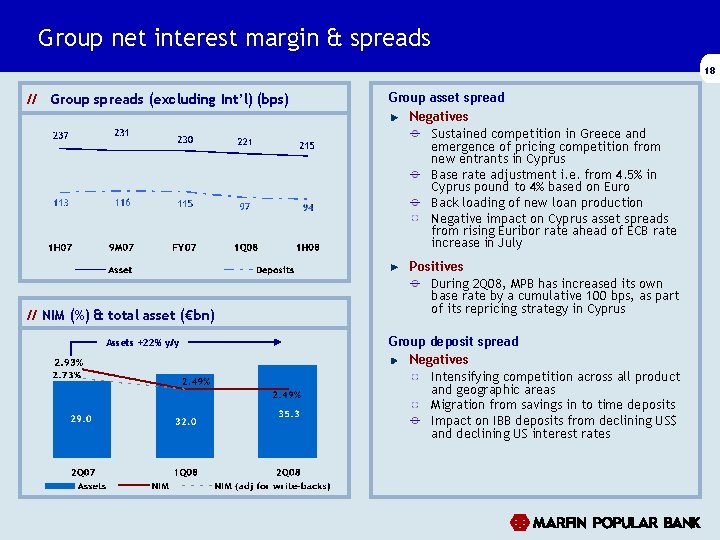
1 H 08 Group results highlights 3 1 H 08 net profit rose 7%(1) y/y to € 220. 4 m; 2 Q 08 net profit rose 11% q/q to € 115. 9 m Revenues: 1 H 08 revenues 9%(2) higher y/y to € 587. 7 m; 2 Q 08 revenues up 9% sequentially to € 187. 0 m; 1 H 08 NII up 8% y/y to € 359. 3 m; fee & commission income up 32% to € 147. 1 m Net Interest Income (NII): Strong progression of NII on a sequential basis reflects: a) stabilization of margins, b) strong balance sheet growth, and c) the leveling off of all technical and cyclical factors having adversely affected operating performance in 4 Q 07 and 1 Q 08 Balance sheet: Group loan (net) and deposit growth of 40% and 19% respectively y/y with strong growth and market share gains evident across all key geographic and product areas Net interest margin (NIM): 2 Q 08 NIM stabilizing at 2. 49% on a sequential basis; ongoing repricing of loan book in Cyprus and Greece, as well as increasing contribution from international operations are more than offsetting some competition induced compression of deposit spreads Cost: Operating expenses up 15% y/y to € 270. 6 m and 7% ex-acquisitions, reflecting the impact of an effective cost management strategy and the benefits of the ongoing Group wide cost re-engineering program Asset quality: Group NPL ratio down from 5. 3% in 1 H 07 to 4. 9% in 1 Q 08 and 4. 5% in 1 H 08, dropping 80 bps y/y and 40 bps on a sequential basis; cost of risk down to 47 bps in 1 H 08 from 60 in 1 H 07 Liquidity: Loan/deposit ratio rose to 89% in 1 H 08 from 76% in 1 H 07, but remained stable on a sequential basis; MPB’s loan/deposit ratio remains one of the lowest among the Hellenic Banks and well below the European average Capital: Tier I capital and total regulatory capital rose 11% and 10% to € 2, 080 m and € 2, 452 m respectively compared to March 2008; in June 2008, MPB’s capital position corresponded to Tier I ratio of 8. 9% and total capital adequacy ratio of 10. 5%; on a proforma basis adjusting for the strategic partnership of MPB’s insurance operations with CNP Assurances announced in July 2008, Tier I and total capital ratio stand at 9. 3% and 11. 3% respectively Ro. TE at 20. 3% in 1 H 08 improved from 19. 1% in 1 Q 08 (1) Adjusted for exceptional items and profit from discontinued operations (2) Adjusted for exceptional items
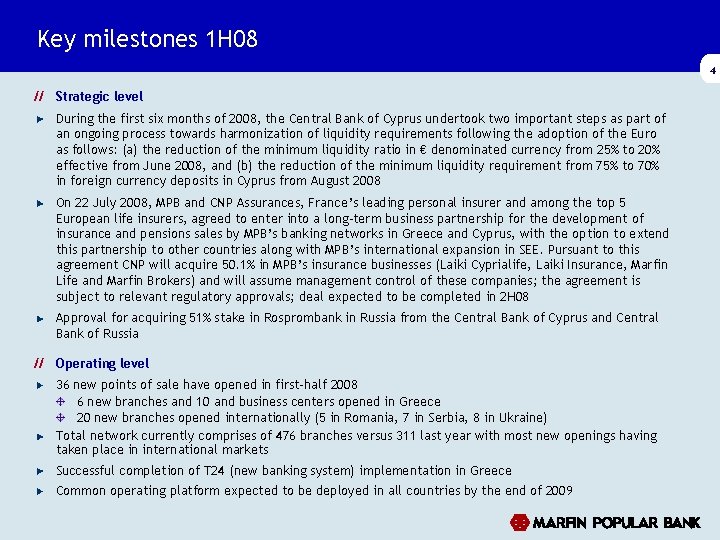
Key milestones 1 H 08 4 // Strategic level During the first six months of 2008, the Central Bank of Cyprus undertook two important steps as part of an ongoing process towards harmonization of liquidity requirements following the adoption of the Euro as follows: (a) the reduction of the minimum liquidity ratio in € denominated currency from 25% to 20% effective from June 2008, and (b) the reduction of the minimum liquidity requirement from 75% to 70% in foreign currency deposits in Cyprus from August 2008 On 22 July 2008, MPB and CNP Assurances, France’s leading personal insurer and among the top 5 European life insurers, agreed to enter into a long-term business partnership for the development of insurance and pensions sales by MPB’s banking networks in Greece and Cyprus, with the option to extend this partnership to other countries along with MPB’s international expansion in SEE. Pursuant to this agreement CNP will acquire 50. 1% in MPB’s insurance businesses (Laiki Cyprialife, Laiki Insurance, Marfin Life and Marfin Brokers) and will assume management control of these companies; the agreement is subject to relevant regulatory approvals; deal expected to be completed in 2 H 08 Approval for acquiring 51% stake in Rosprombank in Russia from the Central Bank of Cyprus and Central Bank of Russia // Operating level 36 new points of sale have opened in first-half 2008 6 new branches and 10 and business centers opened in Greece 20 new branches opened internationally (5 in Romania, 7 in Serbia, 8 in Ukraine) Total network currently comprises of 476 branches versus 311 last year with most new openings having taken place in international markets Successful completion of T 24 (new banking system) implementation in Greece Common operating platform expected to be deployed in all countries by the end of 2009
Significant market share gains in Greece 5 // Total Loans – market share (%) // Total Deposits – market share (%) // Corporate Loans – market share (%) // Household Loans – market share (%)
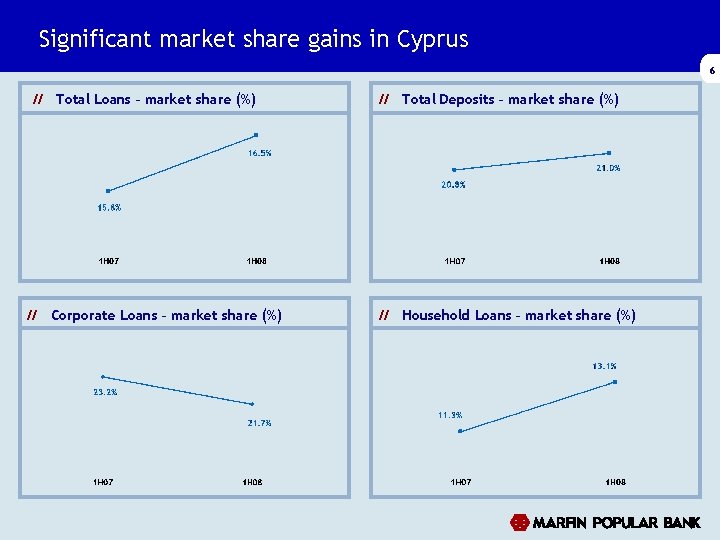
Significant market share gains in Cyprus 6 // Total Loans – market share (%) // Corporate Loans – market share (%) // Total Deposits – market share (%) // Household Loans – market share (%)
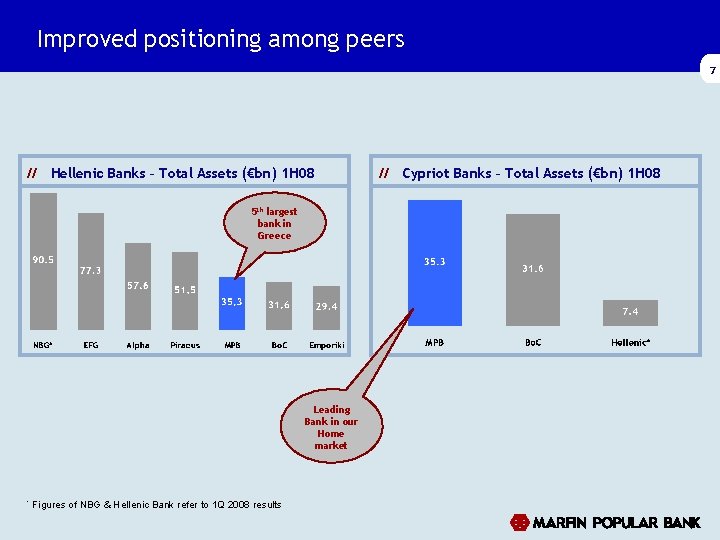
Improved positioning among peers 7 // Hellenic Banks – Total Assets (€bn) 1 H 08 5 th largest bank in Greece Leading Bank in our Home market * Figures of NBG & Hellenic Bank refer to 1 Q 2008 results // Cypriot Banks – Total Assets (€bn) 1 H 08
First-half 2008 financial statements
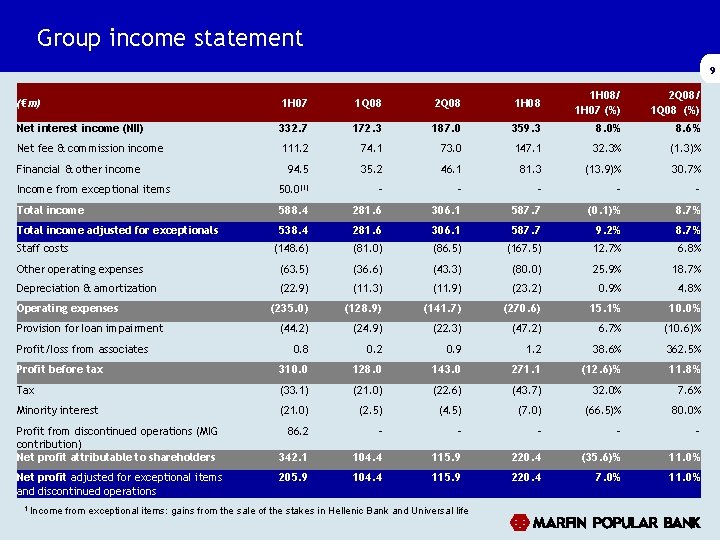
Group income statement 9 (€m) 1 H 07 1 Q 08 2 Q 08 1 H 08/ 1 H 07 (%) 2 Q 08/ 1 Q 08 (%) Net interest income (NII) 332. 7 172. 3 187. 0 359. 3 8. 0% 8. 6% Net fee & commission income 111. 2 74. 1 73. 0 147. 1 32. 3% (1. 3)% 94. 5 35. 2 46. 1 81. 3 (13. 9)% 30. 7% Income from exceptional items 50. 0(1) - - - Total income 588. 4 281. 6 306. 1 587. 7 (0. 1)% 8. 7% Total income adjusted for exceptionals 538. 4 281. 6 306. 1 587. 7 9. 2% 8. 7% (148. 6) (81. 0) (86. 5) (167. 5) 12. 7% 6. 8% Other operating expenses (63. 5) (36. 6) (43. 3) (80. 0) 25. 9% 18. 7% Depreciation & amortization (22. 9) (11. 3) (11. 9) (23. 2) 0. 9% 4. 8% (235. 0) (128. 9) (141. 7) (270. 6) 15. 1% 10. 0% (44. 2) (24. 9) (22. 3) (47. 2) 6. 7% (10. 6)% 0. 8 0. 2 0. 9 1. 2 38. 6% 362. 5% Profit before tax 310. 0 128. 0 143. 0 271. 1 (12. 6)% 11. 8% Tax (33. 1) (21. 0) (22. 6) (43. 7) 32. 0% 7. 6% Minority interest (21. 0) (2. 5) (4. 5) (7. 0) (66. 5)% 80. 0% 86. 2 - - - 342. 1 104. 4 115. 9 220. 4 (35. 6)% 11. 0% 205. 9 104. 4 115. 9 220. 4 7. 0% 11. 0% Financial & other income Staff costs Operating expenses Provision for loan impairment Profit/loss from associates Profit from discontinued operations (MIG contribution) Net profit attributable to shareholders Net profit adjusted for exceptional items and discontinued operations 1 Income from exceptional items: gains from the sale of the stakes in Hellenic Bank and Universal life
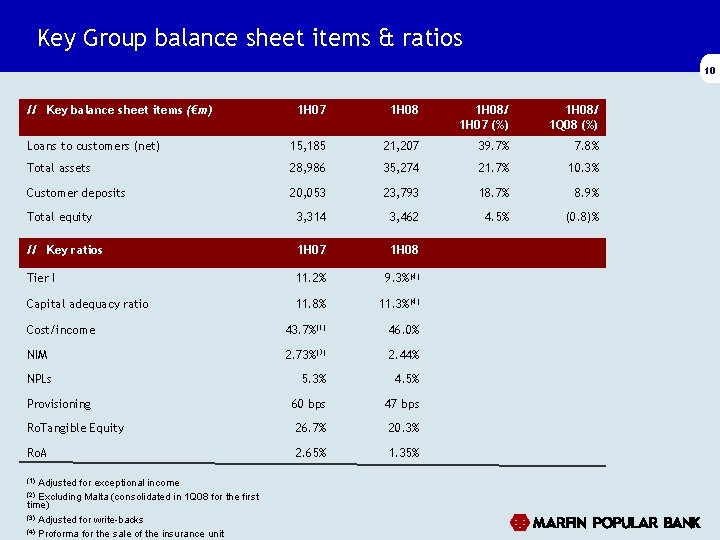
Key Group balance sheet items & ratios 10 // Key balance sheet items (€m) 1 H 07 1 H 08/ 1 H 07 (%) 1 H 08/ 1 Q 08 (%) Loans to customers (net) 15, 185 21, 207 39. 7% 7. 8% Total assets 28, 986 35, 274 21. 7% 10. 3% Customer deposits 20, 053 23, 793 18. 7% 8. 9% Total equity 3, 314 3, 462 4. 5% (0. 8)% // Key ratios 1 H 07 1 H 08 Tier I 11. 2% 9. 3%(4) Capital adequacy ratio 11. 8% 11. 3%(4) Cost/income 43. 7%(1) 46. 0% NIM 2. 73%(3) 2. 44% 5. 3% 4. 5% 60 bps 47 bps Ro. Tangible Equity 26. 7% 20. 3% Ro. A 2. 65% 1. 35% NPLs Provisioning Adjusted for exceptional income Excluding Malta (consolidated in 1 Q 08 for the first time) (3) Adjusted for write-backs (4) Proforma for the sale of the insurance unit (1) (2)
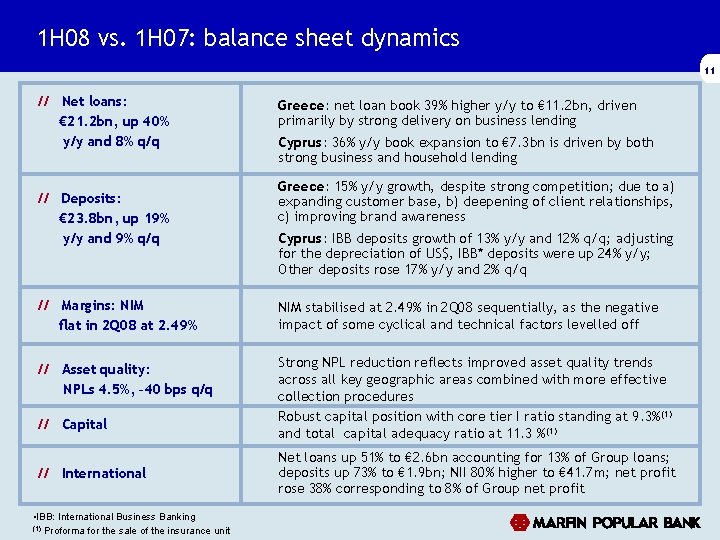
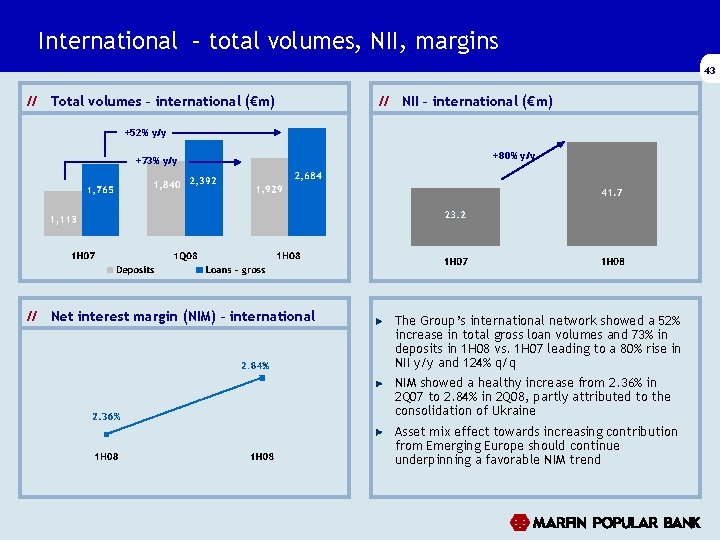
1 H 08 vs. 1 H 07: balance sheet dynamics 11 // Net loans: € 21. 2 bn, up 40% y/y and 8% q/q // Deposits: € 23. 8 bn, up 19% y/y and 9% q/q Greece: net loan book 39% higher y/y to € 11. 2 bn, driven primarily by strong delivery on business lending Cyprus: 36% y/y book expansion to € 7. 3 bn is driven by both strong business and household lending Greece: 15% y/y growth, despite strong competition; due to a) expanding customer base, b) deepening of client relationships, c) improving brand awareness Cyprus: IBB deposits growth of 13% y/y and 12% q/q; adjusting for the depreciation of US$, IBB* deposits were up 24% y/y; Other deposits rose 17% y/y and 2% q/q // Margins: NIM flat in 2 Q 08 at 2. 49% NIM stabilised at 2. 49% in 2 Q 08 sequentially, as the negative impact of some cyclical and technical factors levelled off // Asset quality: NPLs 4. 5%, – 40 bps q/q Strong NPL reduction reflects improved asset quality trends across all key geographic areas combined with more effective collection procedures Robust capital position with core tier I ratio standing at 9. 3%(1) and total capital adequacy ratio at 11. 3 %(1) // Capital // International • IBB: International Business Banking (1) Proforma for the sale of the insurance unit Net loans up 51% to € 2. 6 bn accounting for 13% of Group loans; deposits up 73% to € 1. 9 bn; NII 80% higher to € 41. 7 m; net profit rose 38% corresponding to 8% of Group net profit
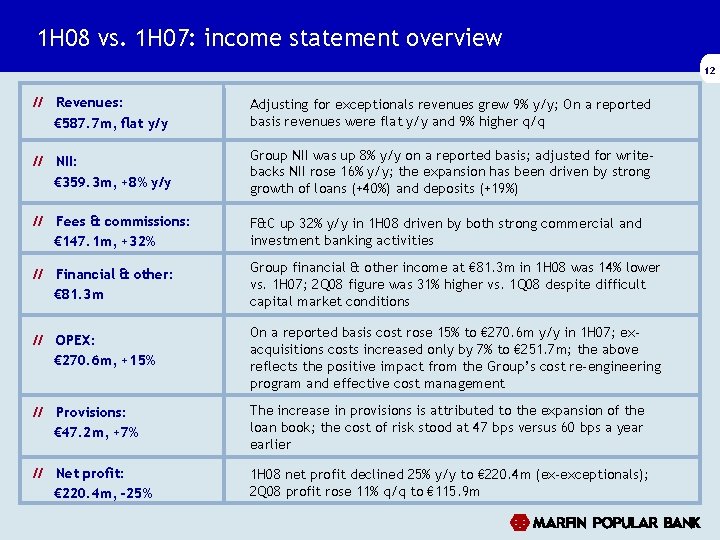
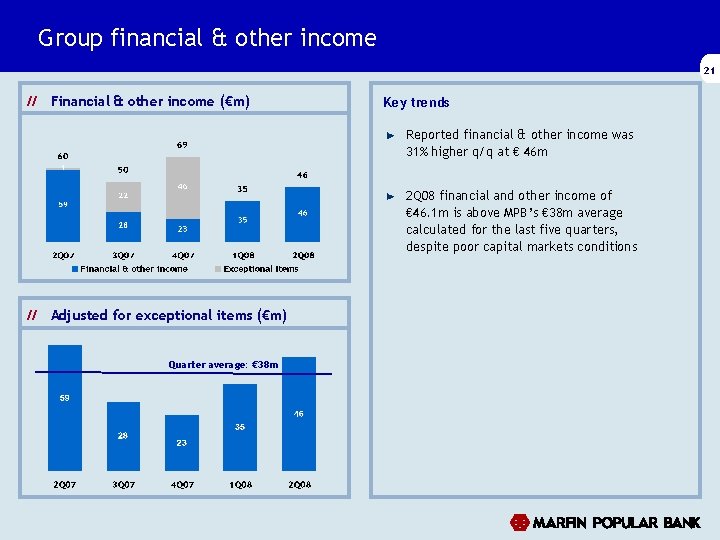
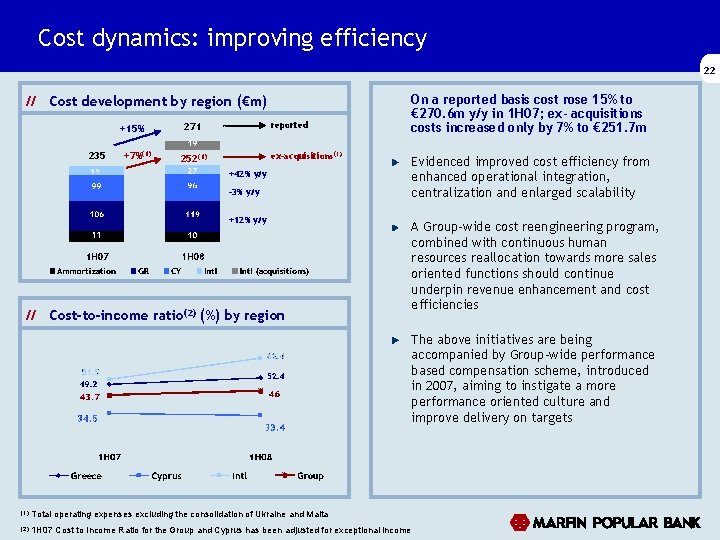
1 H 08 vs. 1 H 07: income statement overview 12 // Revenues: € 587. 7 m, flat y/y Adjusting for exceptionals revenues grew 9% y/y; On a reported basis revenues were flat y/y and 9% higher q/q // NII: € 359. 3 m, +8% y/y Group NII was up 8% y/y on a reported basis; adjusted for writebacks NII rose 16% y/y; the expansion has been driven by strong growth of loans (+40%) and deposits (+19%) // Fees & commissions: € 147. 1 m, +32% F&C up 32% y/y in 1 H 08 driven by both strong commercial and investment banking activities // Financial & other: € 81. 3 m Group financial & other income at € 81. 3 m in 1 H 08 was 14% lower vs. 1 H 07; 2 Q 08 figure was 31% higher vs. 1 Q 08 despite difficult capital market conditions // OPEX: € 270. 6 m, +15% On a reported basis cost rose 15% to € 270. 6 m y/y in 1 H 07; exacquisitions costs increased only by 7% to € 251. 7 m; the above reflects the positive impact from the Group’s cost re-engineering program and effective cost management // Provisions: € 47. 2 m, +7% The increase in provisions is attributed to the expansion of the loan book; the cost of risk stood at 47 bps versus 60 bps a year earlier // Net profit: € 220. 4 m, -25% 1 H 08 net profit declined 25% y/y to € 220. 4 m (ex-exceptionals); 2 Q 08 profit rose 11% q/q to € 115. 9 m
Group level analysis
Strong loan volume growth across all regions & products 14 // Loan(1) book by region (€bn) +40% y/y // Loan book by region y/y +51% +39% +38% // Loan book by category (€bn) +40% y/y // Loan book by category y/y +46% +26% +30% * All loans are performing loans unless otherwise stated Retail 33%
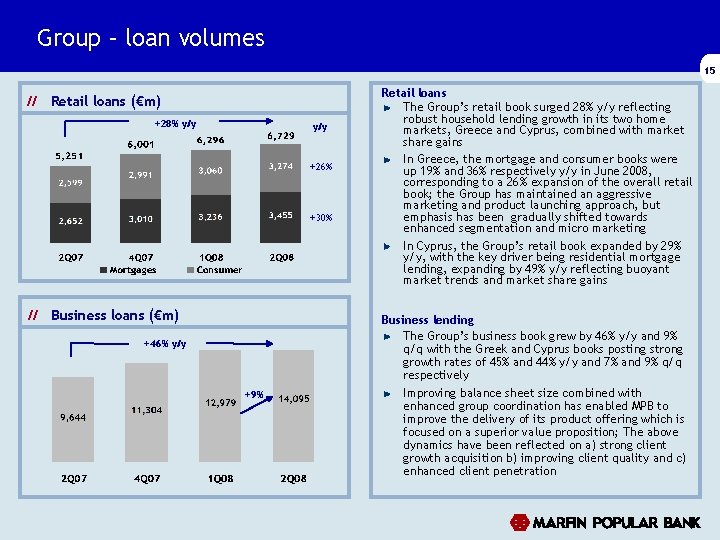
Group – loan volumes 15 // Retail loans (€m) +28% y/y +26% +30% // Business loans (€m) Retail loans The Group’s retail book surged 28% y/y reflecting robust household lending growth in its two home markets, Greece and Cyprus, combined with market share gains In Greece, the mortgage and consumer books were up 19% and 36% respectively y/y in June 2008, corresponding to a 26% expansion of the overall retail book; the Group has maintained an aggressive marketing and product launching approach, but emphasis has been gradually shifted towards enhanced segmentation and micro marketing In Cyprus, the Group’s retail book expanded by 29% y/y, with the key driver being residential mortgage lending, expanding by 49% y/y reflecting buoyant market trends and market share gains Business lending The Group’s business book grew by 46% y/y and 9% q/q with the Greek and Cyprus books posting strong growth rates of 45% and 44% y/y and 7% and 9% q/q respectively +46% y/y +9% Improving balance sheet size combined with enhanced group coordination has enabled MPB to improve the delivery of its product offering which is focused on a superior value proposition; The above dynamics have been reflected on a) strong client growth acquisition b) improving client quality and c) enhanced client penetration
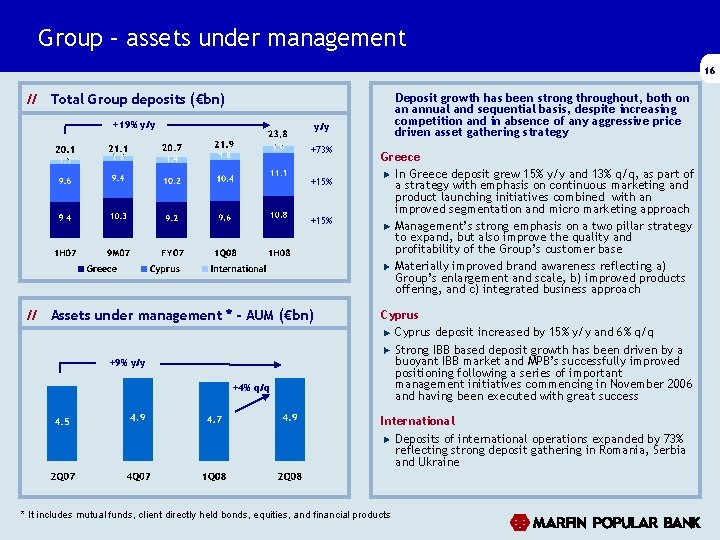
Group – assets under management 16 Deposit growth has been strong throughout, both on an annual and sequential basis, despite increasing competition and in absence of any aggressive price driven asset gathering strategy // Total Group deposits (€bn) +19% y/y +73% +15% // Assets under management * - AUM (€bn) +9% y/y +4% q/q Greece In Greece deposit grew 15% y/y and 13% q/q, as part of a strategy with emphasis on continuous marketing and product launching initiatives combined with an improved segmentation and micro marketing approach Management’s strong emphasis on a two pillar strategy to expand, but also improve the quality and profitability of the Group’s customer base Materially improved brand awareness reflecting a) Group’s enlargement and scale, b) improved products offering, and c) integrated business approach Cyprus deposit increased by 15% y/y and 6% q/q Strong IBB based deposit growth has been driven by a buoyant IBB market and MPB’s successfully improved positioning following a series of important management initiatives commencing in November 2006 and having been executed with great success International Deposits of international operations expanded by 73% reflecting strong deposit gathering in Romania, Serbia and Ukraine * It includes mutual funds, client directly held bonds, equities, and financial products
Group NII quarterly evolution 17 // NII quarterly evolution (€m) // NII composition by region +8% y/y // NII adjusted for write backs (€m) +15% y/y // NII quarterly evolution by product (€m) +7% y/y
Group net interest margin & spreads 18 // Group spreads (excluding Int’l) (bps) // NIM (%) & total asset (€bn) Assets +22% y/y Group asset spread Negatives Sustained competition in Greece and emergence of pricing competition from new entrants in Cyprus Base rate adjustment i. e. from 4. 5% in Cyprus pound to 4% based on Euro Back loading of new loan production Negative impact on Cyprus asset spreads from rising Euribor rate ahead of ECB rate increase in July Positives During 2 Q 08, MPB has increased its own base rate by a cumulative 100 bps, as part of its repricing strategy in Cyprus Group deposit spread Negatives Intensifying competition across all product and geographic areas Migration from savings in to time deposits Impact on IBB deposits from declining US$ and declining US interest rates
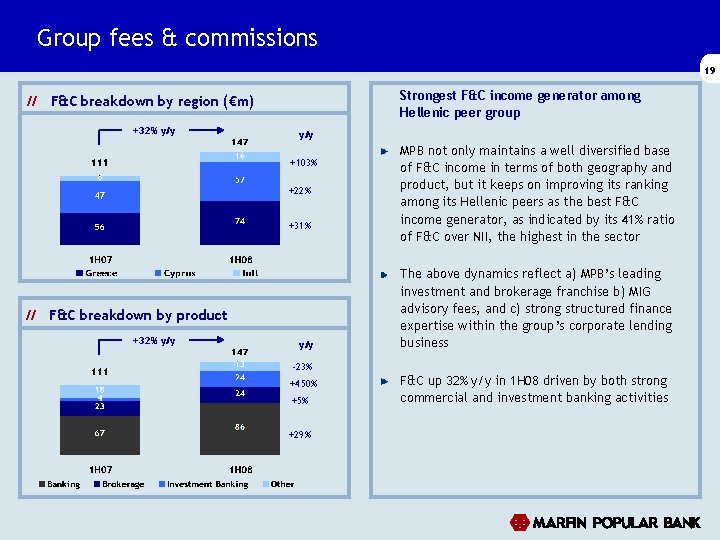
Group fees & commissions 19 Strongest F&C income generator among Hellenic peer group // F&C breakdown by region (€m) +32% y/y +103% +22% +31% // F&C breakdown by product +32% y/y MPB not only maintains a well diversified base of F&C income in terms of both geography and product, but it keeps on improving its ranking among its Hellenic peers as the best F&C income generator, as indicated by its 41% ratio of F&C over NII, the highest in the sector The above dynamics reflect a) MPB’s leading investment and brokerage franchise b) MIG advisory fees, and c) strong structured finance expertise within the group’s corporate lending business -23% +450% +5% +29% F&C up 32% y/y in 1 H 08 driven by both strong commercial and investment banking activities
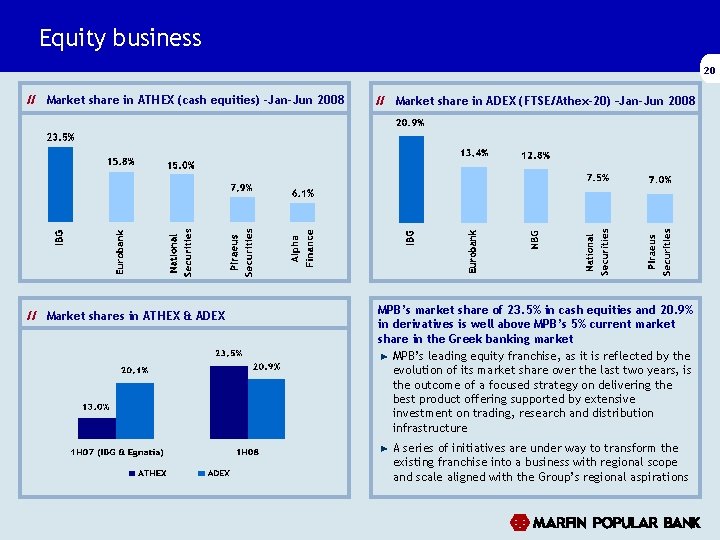
Equity business 20 // Market share in ATHEX (cash equities) -Jan-Jun 2008 // Market shares in ATHEX & ADEX // Market share in ADEX (FTSE/Athex-20) –Jan-Jun 2008 MPB’s market share of 23. 5% in cash equities and 20. 9% in derivatives is well above MPB’s 5% current market share in the Greek banking market MPB’s leading equity franchise, as it is reflected by the evolution of its market share over the last two years, is the outcome of a focused strategy on delivering the best product offering supported by extensive investment on trading, research and distribution infrastructure A series of initiatives are under way to transform the existing franchise into a business with regional scope and scale aligned with the Group’s regional aspirations
Group financial & other income 21 // Financial & other income (€m) Key trends Reported financial & other income was 31% higher q/q at € 46 m 2 Q 08 financial and other income of € 46. 1 m is above MPB’s € 38 m average calculated for the last five quarters, despite poor capital markets conditions // Adjusted for exceptional items (€m) Quarter average: € 38 m
Cost dynamics: improving efficiency 22 // Cost development by region (€m) +15% 235 +7%(1) reported 271 ex-acquisitions(1) 252(1) +42% y/y -3% y/y +12% y/y // Cost-to-income ratio(2) (%) by region On a reported basis cost rose 15% to € 270. 6 m y/y in 1 H 07; ex- acquisitions costs increased only by 7% to € 251. 7 m Evidenced improved cost efficiency from enhanced operational integration, centralization and enlarged scalability A Group-wide cost reengineering program, combined with continuous human resources reallocation towards more sales oriented functions should continue underpin revenue enhancement and cost efficiencies The above initiatives are being accompanied by Group-wide performance based compensation scheme, introduced in 2007, aiming to instigate a more performance oriented culture and improve delivery on targets (1) Total operating expenses excluding the consolidation of Ukraine and Malta (2) 1 H 07 Cost to Income Ratio for the Group and Cyprus has been adjusted for exceptional income
Group asset quality dynamics 23 // Provision charges (€m) & cost of credit risk Market specific factors strong GDP growth outlook in Greece & Cyprus sustained increase of asset values ► sustainable disposable income growth ► positive demographics ► low corporate and household debt/GDP in Greece ► understated income levels reflecting the large size of the unofficial economy // NPLs* & coverage ratio Company specific factors improving systems for collections, increased focus on risk-based pricing and enhanced segmentation continuous effort to clean up the Cypriot portfolio and reduce NPL generation * NPLs are net of interest suspension and in accordance with the Central Bank of Cyprus criteria (three-month rule)
Asset quality dynamics in Greece & Cyprus 24 // Provision charges (€m) & cost of credit risk Greece // NPLs & coverage ratio Greece // Provision charges (€m) & cost of credit risk Cyprus // NPLs & coverage ratio Cyprus
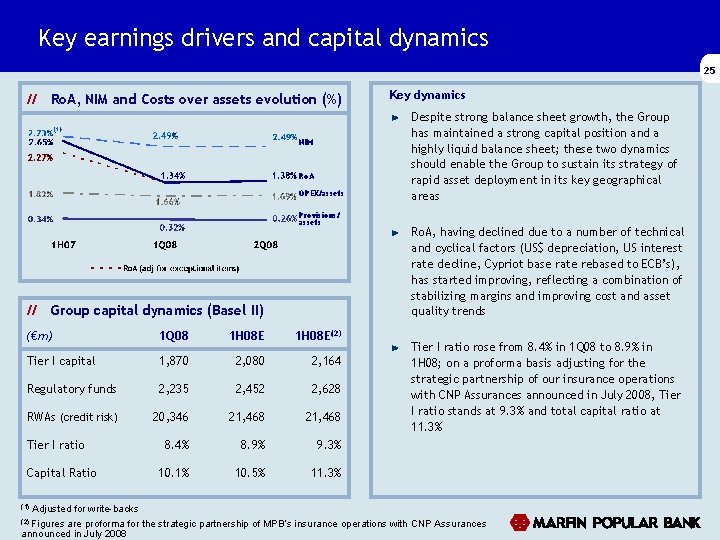
Key earnings drivers and capital dynamics 25 // Ro. A, NIM and Costs over assets evolution (%) NIM Ro. A OPEX/assets Provisions/ assets // Group capital dynamics (Basel II) (€m) 1 Q 08 1 H 08 E(2) Tier I capital 1, 870 2, 080 2, 164 Regulatory funds 2, 235 2, 452 2, 628 RWAs (credit risk) 20, 346 21, 468 8. 4% 8. 9% 9. 3% 10. 1% 10. 5% 11. 3% Tier I ratio Capital Ratio (1) Key dynamics Despite strong balance sheet growth, the Group has maintained a strong capital position and a highly liquid balance sheet; these two dynamics should enable the Group to sustain its strategy of rapid asset deployment in its key geographical areas Ro. A, having declined due to a number of technical and cyclical factors (US$ depreciation, US interest rate decline, Cypriot base rate rebased to ECB’s), has started improving, reflecting a combination of stabilizing margins and improving cost and asset quality trends Tier I ratio rose from 8. 4% in 1 Q 08 to 8. 9% in 1 H 08; on a proforma basis adjusting for the strategic partnership of our insurance operations with CNP Assurances announced in July 2008, Tier I ratio stands at 9. 3% and total capital ratio at 11. 3% Adjusted for write-backs (2) Figures are proforma for the strategic partnership of MPB’s insurance operations with CNP Assurances announced in July 2008
Regional analysis
Greece
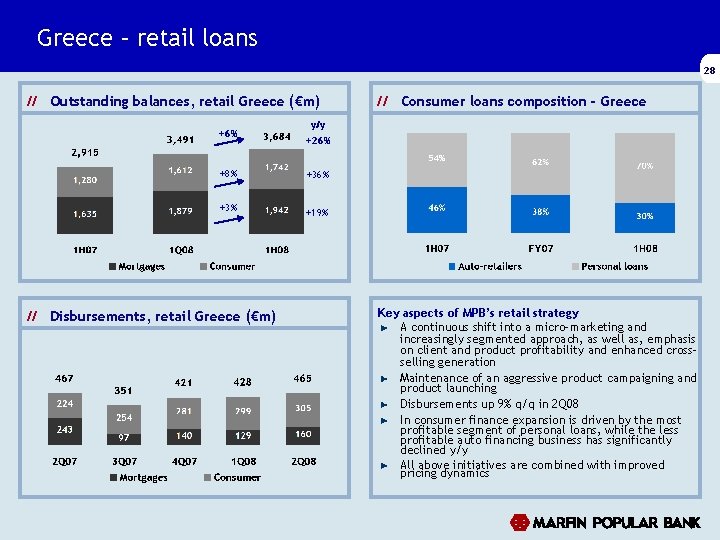
Greece – retail loans 28 // Outstanding balances, retail Greece (€m) +6% +8% +3% // Disbursements, retail Greece (€m) // Consumer loans composition - Greece y/y +26% +36% +19% Key aspects of MPB’s retail strategy A continuous shift into a micro-marketing and increasingly segmented approach, as well as, emphasis on client and product profitability and enhanced crossselling generation Maintenance of an aggressive product campaigning and product launching Disbursements up 9% q/q in 2 Q 08 In consumer finance expansion is driven by the most profitable segment of personal loans, while the less profitable auto financing business has significantly declined y/y All above initiatives are combined with improved pricing dynamics
Greece – business lending 29 Business loans increased by 45% y/y in 1 H 08 // Total business loans – Greece (€bn) MPB’s 7% q/q expansion in 1 H 08 is well above the market’s estimated growth of c 4%, resulting to sustained market share expansion; MPB’s market share in domestic business lending has risen from 5. 2% in Dec 07 to 5. 8% in Mar 08 and 6. 0% in Jun 08 +45% y/y +7% Strong expansion reflects a superior product offering based on a highly attractive value proposition, combined with an integrated approach to customer i. e. strong investment banking and advisory element Spreads on new production show ability to reprice thus offset elevated funding cost and sustain high levels of return on equity (Ro. E) // Greek loan book composition 1 H 07 // Greek loan book composition 1 H 08 Retail 37% Retail 34%
Greece – deposits 30 // Total deposits – Greece (€bn) y/y +15% -39% +51% // Greek deposits composition 1 H 07 1 H 08 Key deposit dynamics 1 H 08 deposits grew by 15% y/y and 13% q/q In Greece; if we adjust 1 H 07 deposit figure for deposits related to MIG’s rights issue the annual growth rate is 33% Maintenance of a defensive deposit gathering strategy in 1 H 08 despite increased competition from banks with elevated loan/deposit ratios MPB’s strategy primarily reflects its strong liquidity position, which enables it to maintain a far greater degree of flexibility in optimizing its funding structure and minimize its funding cost Despite its defensive strategy, MPB’s outgrew most of its peer group reflecting a) expanding and deepening of customer base both private individuals and business customers b) enhanced cross selling effectiveness c) improving brand recognition d) effective micro marketing and segmentation, and e) successful strategy of capturing flow on both sides of the balance sheet Ongoing strategic initiatives Improved coordination within the asset gathering operations of the Group (wealth management and deposit gathering) Introduction of a far more comprehensive and aggressive performance based and targeted oriented compensation scheme
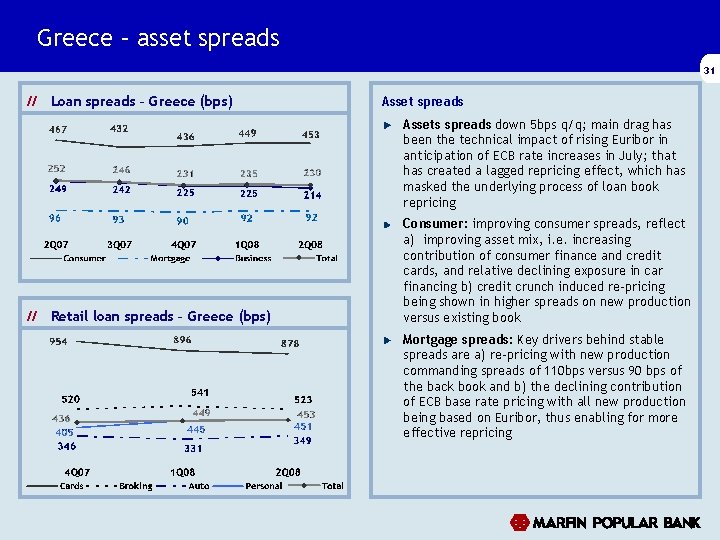
Greece – asset spreads 31 // Loan spreads – Greece (bps) Asset spreads Assets spreads down 5 bps q/q; main drag has been the technical impact of rising Euribor in anticipation of ECB rate increases in July; that has created a lagged repricing effect, which has masked the underlying process of loan book repricing // Retail loan spreads – Greece (bps) Consumer: improving consumer spreads, reflect a) improving asset mix, i. e. increasing contribution of consumer finance and credit cards, and relative declining exposure in car financing b) credit crunch induced re-pricing being shown in higher spreads on new production versus existing book Mortgage spreads: Key drivers behind stable spreads are a) re-pricing with new production commanding spreads of 110 bps versus 90 bps of the back book and b) the declining contribution of ECB base rate pricing with all new production being based on Euribor, thus enabling for more effective repricing
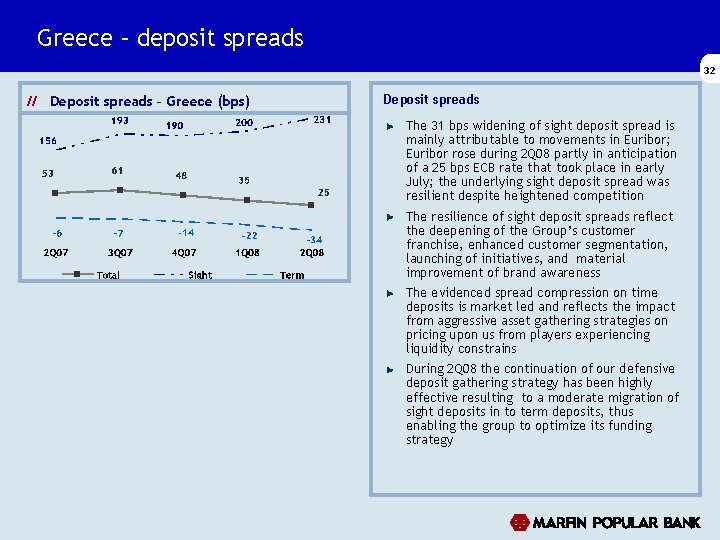
Greece – deposit spreads 32 // Deposit spreads – Greece (bps) Deposit spreads The 31 bps widening of sight deposit spread is mainly attributable to movements in Euribor; Euribor rose during 2 Q 08 partly in anticipation of a 25 bps ECB rate that took place in early July; the underlying sight deposit spread was resilient despite heightened competition The resilience of sight deposit spreads reflect the deepening of the Group’s customer franchise, enhanced customer segmentation, launching of initiatives, and material improvement of brand awareness The evidenced spread compression on time deposits is market led and reflects the impact from aggressive asset gathering strategies on pricing upon us from players experiencing liquidity constrains During 2 Q 08 the continuation of our defensive deposit gathering strategy has been highly effective resulting to a moderate migration of sight deposits in to term deposits, thus enabling the group to optimize its funding strategy
Cyprus
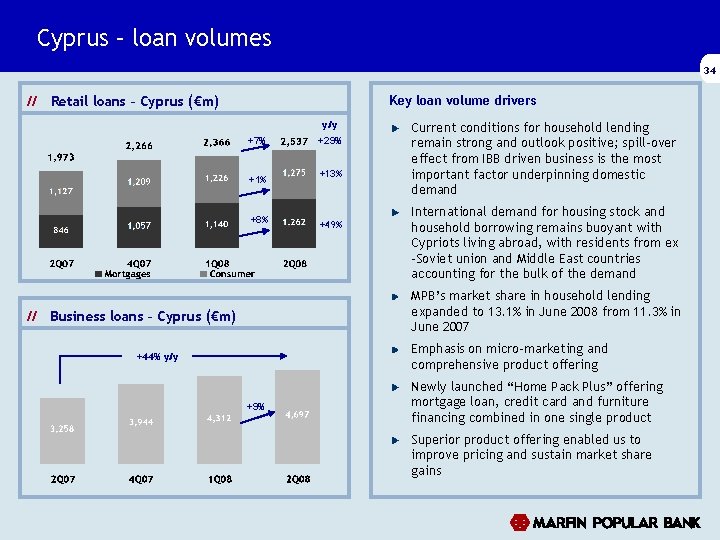
Cyprus – loan volumes 34 // Retail loans – Cyprus (€m) Key loan volume drivers y/y +7% +1% +8% +29% +13% +49% Current conditions for household lending remain strong and outlook positive; spill-over effect from IBB driven business is the most important factor underpinning domestic demand International demand for housing stock and household borrowing remains buoyant with Cypriots living abroad, with residents from ex -Soviet union and Middle East countries accounting for the bulk of the demand MPB’s market share in household lending expanded to 13. 1% in June 2008 from 11. 3% in June 2007 // Business loans – Cyprus (€m) Emphasis on micro-marketing and comprehensive product offering +44% y/y +9% Newly launched “Home Pack Plus” offering mortgage loan, credit card and furniture financing combined in one single product Superior product offering enabled us to improve pricing and sustain market share gains
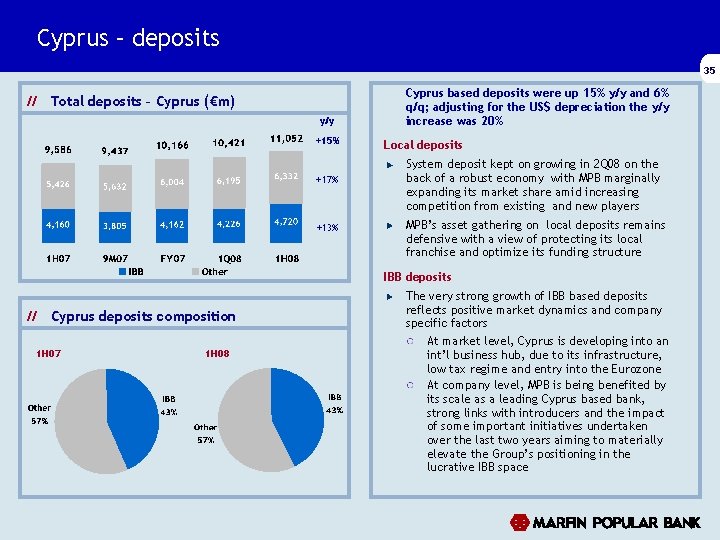
Cyprus – deposits 35 // Total deposits – Cyprus (€m) y/y +15% +17% +13% Cyprus based deposits were up 15% y/y and 6% q/q; adjusting for the US$ depreciation the y/y increase was 20% Local deposits System deposit kept on growing in 2 Q 08 on the back of a robust economy with MPB marginally expanding its market share amid increasing competition from existing and new players MPB’s asset gathering on local deposits remains defensive with a view of protecting its local franchise and optimize its funding structure IBB deposits // Cyprus deposits composition 1 H 07 1 H 08 The very strong growth of IBB based deposits reflects positive market dynamics and company specific factors At market level, Cyprus is developing into an int’l business hub, due to its infrastructure, low tax regime and entry into the Eurozone At company level, MPB is being benefited by its scale as a leading Cyprus based bank, strong links with introducers and the impact of some important initiatives undertaken over the last two years aiming to materially elevate the Group’s positioning in the lucrative IBB space
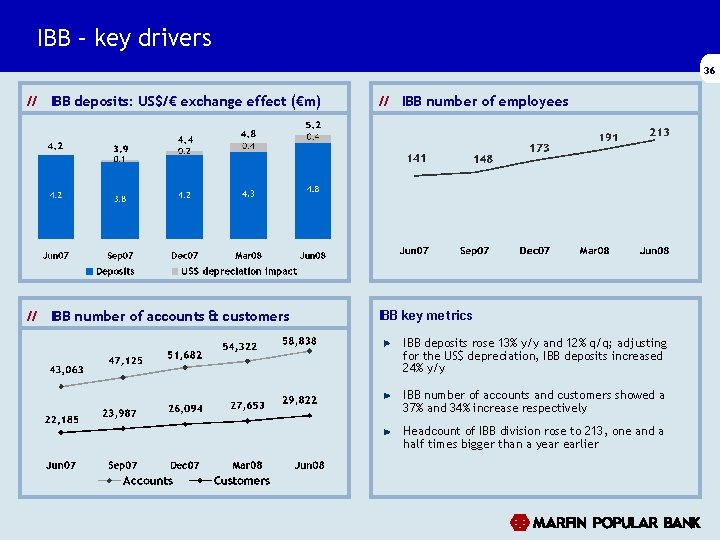
IBB – key drivers 36 // IBB deposits: US$/€ exchange effect (€m) // IBB number of employees // IBB number of accounts & customers IBB key metrics IBB deposits rose 13% y/y and 12% q/q; adjusting for the US$ depreciation, IBB deposits increased 24% y/y IBB number of accounts and customers showed a 37% and 34% increase respectively Headcount of IBB division rose to 213, one and a half times bigger than a year earlier
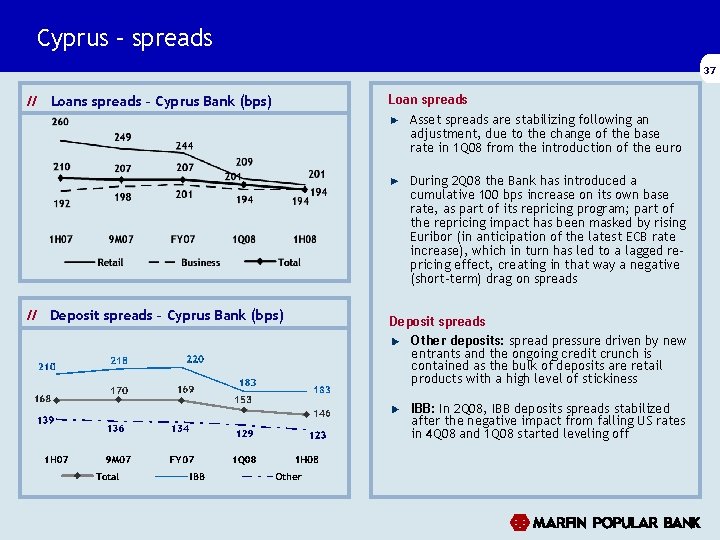
Cyprus – spreads 37 // Loans spreads – Cyprus Bank (bps) Loan spreads Asset spreads are stabilizing following an adjustment, due to the change of the base rate in 1 Q 08 from the introduction of the euro During 2 Q 08 the Bank has introduced a cumulative 100 bps increase on its own base rate, as part of its repricing program; part of the repricing impact has been masked by rising Euribor (in anticipation of the latest ECB rate increase), which in turn has led to a lagged repricing effect, creating in that way a negative (short-term) drag on spreads // Deposit spreads – Cyprus Bank (bps) Deposit spreads Other deposits: spread pressure driven by new entrants and the ongoing credit crunch is contained as the bulk of deposits are retail products with a high level of stickiness IBB: In 2 Q 08, IBB deposits spreads stabilized after the negative impact from falling US rates in 4 Q 08 and 1 Q 08 started leveling off
International
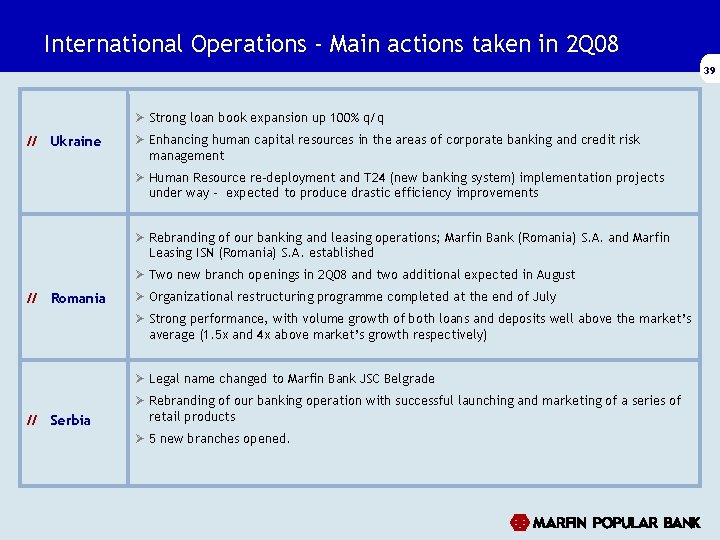
International Operations - Main actions taken in 2 Q 08 39 Ø Strong loan book expansion up 100% q/q // Ukraine Ø Enhancing human capital resources in the areas of corporate banking and credit risk management Ø Human Resource re-deployment and T 24 (new banking system) implementation projects under way – expected to produce drastic efficiency improvements Ø Rebranding of our banking and leasing operations; Marfin Bank (Romania) S. A. and Marfin Leasing ISN (Romania) S. A. established Ø Two new branch openings in 2 Q 08 and two additional expected in August // Romania Ø Organizational restructuring programme completed at the end of July Ø Strong performance, with volume growth of both loans and deposits well above the market’s average (1. 5 x and 4 x above market’s growth respectively) Ø Legal name changed to Marfin Bank JSC Belgrade // Serbia Ø Rebranding of our banking operation with successful launching and marketing of a series of retail products Ø 5 new branches opened.
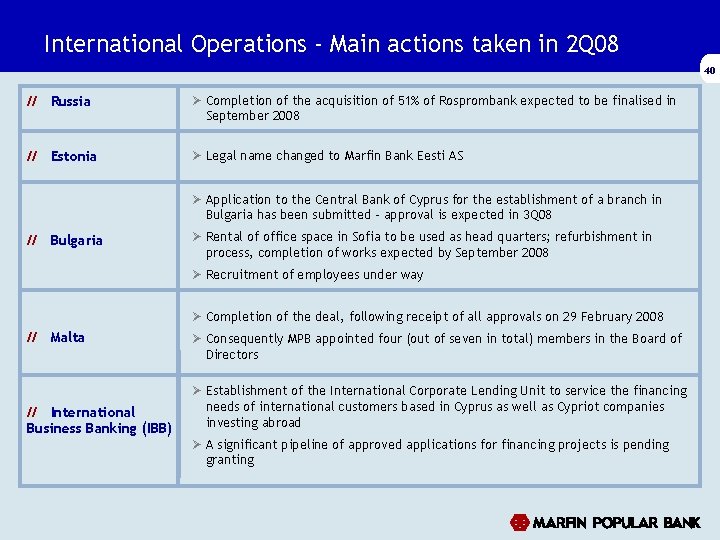
International Operations - Main actions taken in 2 Q 08 40 // Russia Ø Completion of the acquisition of 51% of Rosprombank expected to be finalised in September 2008 // Estonia Ø Legal name changed to Marfin Bank Eesti AS Ø Application to the Central Bank of Cyprus for the establishment of a branch in Bulgaria has been submitted – approval is expected in 3 Q 08 // Bulgaria Ø Rental of office space in Sofia to be used as head quarters; refurbishment in process, completion of works expected by September 2008 Ø Recruitment of employees under way Ø Completion of the deal, following receipt of all approvals on 29 February 2008 // Malta // International Business Banking (IBB) Ø Consequently MPB appointed four (out of seven in total) members in the Board of Directors Ø Establishment of the International Corporate Lending Unit to service the financing needs of international customers based in Cyprus as well as Cypriot companies investing abroad Ø A significant pipeline of approved applications for financing projects is pending granting
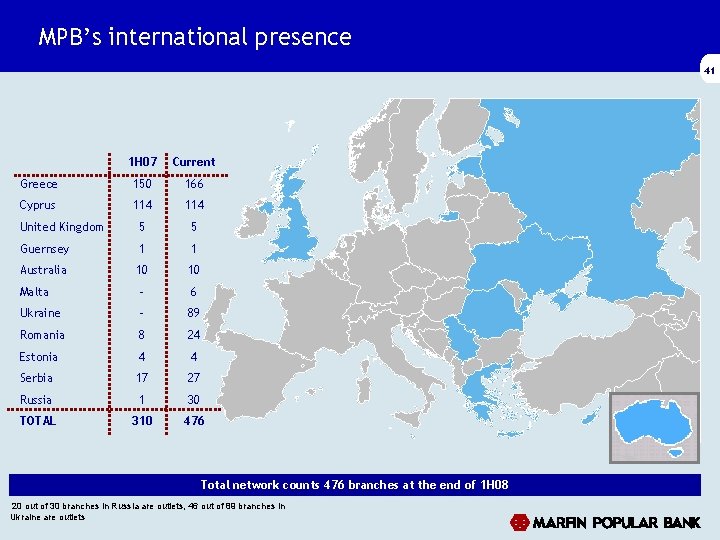
MPB’s international presence 41 1 H 07 Current Greece 150 166 Cyprus 114 United Kingdom 5 5 Guernsey 1 1 Australia 10 10 Malta - 6 Ukraine - 89 Romania 8 24 Estonia 4 4 Serbia 17 27 Russia 1 30 TOTAL 310 476 Total network counts 476 branches at the end of 1 H 08 20 out of 30 branches in Russia are outlets, 46 out of 89 branches in Ukraine are outlets
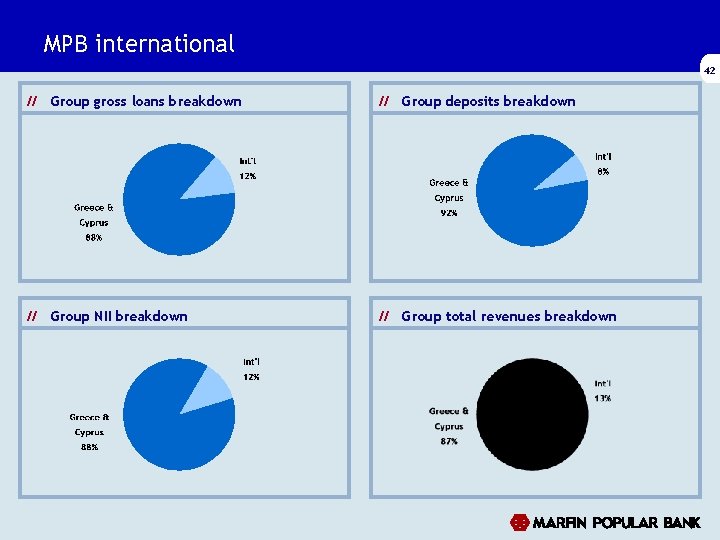
MPB international 42 // Group gross loans breakdown // Group deposits breakdown // Group NII breakdown // Group total revenues breakdown
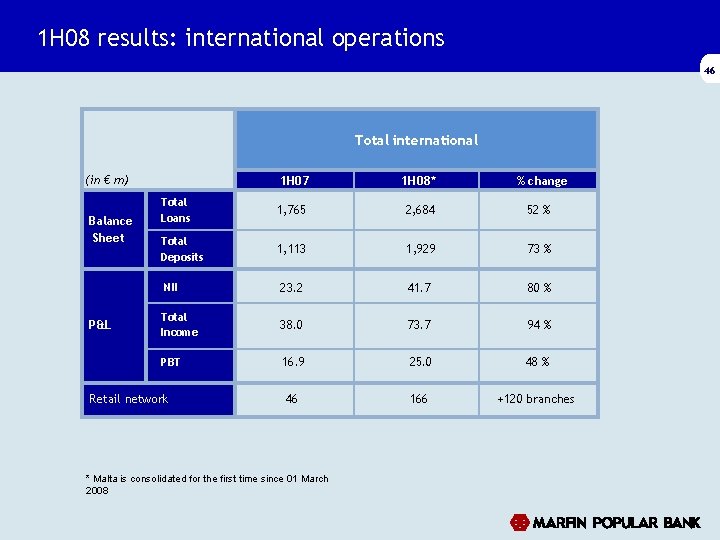
International – total volumes, NII, margins 43 // Total volumes – international (€m) // NII – international (€m) +52% y/y +73% y/y // Net interest margin (NIM) – international +80% y/y The Group’s international network showed a 52% increase in total gross loan volumes and 73% in deposits in 1 H 08 vs. 1 H 07 leading to a 80% rise in NII y/y and 124% q/q NIM showed a healthy increase from 2. 36% in 2 Q 07 to 2. 84% in 2 Q 08, partly attributed to the consolidation of Ukraine Asset mix effect towards increasing contribution from Emerging Europe should continue underpinning a favorable NIM trend
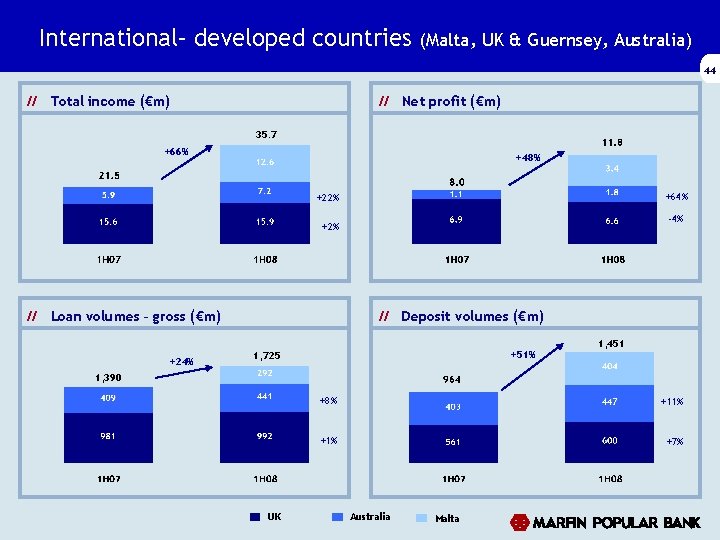
International– developed countries (Malta, UK & Guernsey, Australia) 44 // Total income (€m) // Net profit (€m) 35. 7 +66% +48% +64% +22% -4% +2% // Loan volumes – gross (€m) +24% // Deposit volumes (€m) +51% 1, 725 1, 451 1, 390 UK +8% +11% +7% Australia Malta
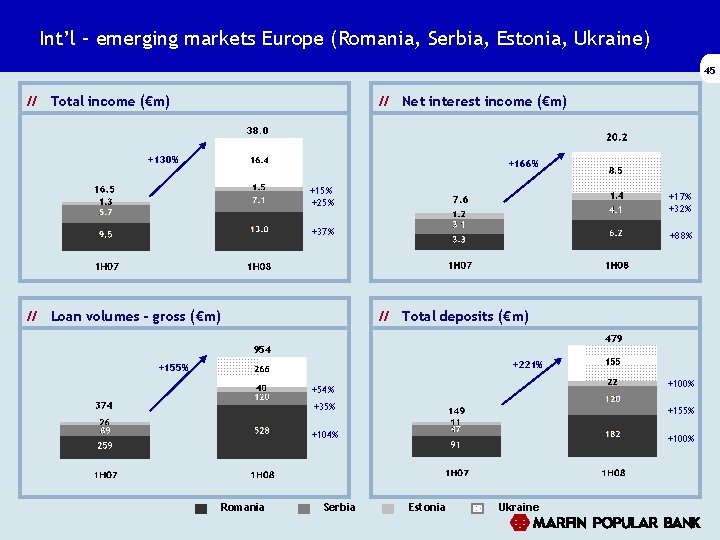
Int’l – emerging markets Europe (Romania, Serbia, Estonia, Ukraine) 45 // Total income (€m) // Net interest income (€m) 38. 0 +130% +166% +15% +25% +17% +32% +37% // Loan volumes - gross (€m) +88% // Total deposits (€m) 479 954 +221% +155% +100% +54% Romania +35% +155% +104% +100% Serbia Estonia Ukraine
1 H 08 results: international operations 46 Total international (in € m) Balance Sheet 1 H 07 1 H 08* % change Total Loans 1, 765 2, 684 52 % Total Deposits 1, 113 1, 929 73 % 23. 2 41. 7 80 % Total Income 38. 0 73. 7 94 % PBT 16. 9 25. 0 48 % 46 166 +120 branches NII P&L Retail network * Malta is consolidated for the first time since 01 March 2008
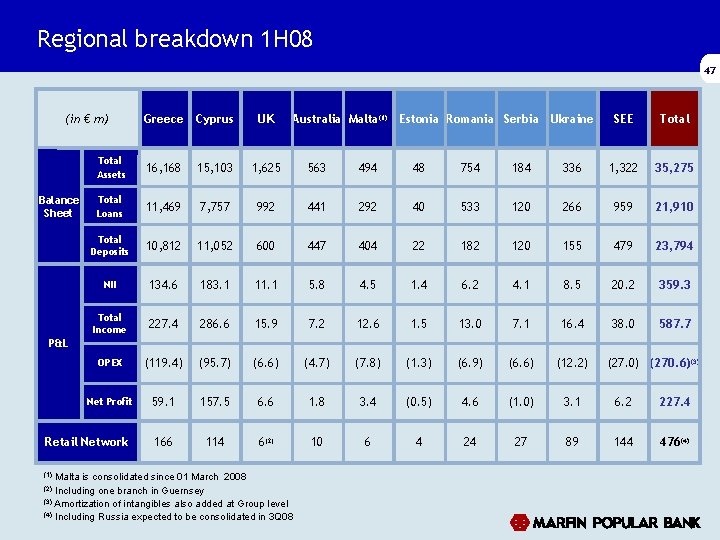
Regional breakdown 1 H 08 47 (in € m) Balance Sheet Greece Cyprus UK Australia Malta(1) Estonia Romania Serbia Ukraine SEE Total Assets 16, 168 15, 103 1, 625 563 494 48 754 184 336 1, 322 35, 275 Total Loans 11, 469 7, 757 992 441 292 40 533 120 266 959 21, 910 Total Deposits 10, 812 11, 052 600 447 404 22 182 120 155 479 23, 794 NII 134. 6 183. 1 11. 1 5. 8 4. 5 1. 4 6. 2 4. 1 8. 5 20. 2 359. 3 Total Income 227. 4 286. 6 15. 9 7. 2 12. 6 1. 5 13. 0 7. 1 16. 4 38. 0 587. 7 OPEX (119. 4) (95. 7) (6. 6) (4. 7) (7. 8) (1. 3) (6. 9) (6. 6) (12. 2) Net Profit 59. 1 157. 5 6. 6 1. 8 3. 4 (0. 5) 4. 6 (1. 0) 3. 1 6. 2 227. 4 166 114 6(2) 10 6 4 24 27 89 144 476(4) P&L Retail Network Malta is consolidated since 01 March 2008 Including one branch in Guernsey (3) Amortization of intangibles also added at Group level (4) Including Russia expected to be consolidated in 3 Q 08 (1) (27. 0) (270. 6)(3)
Disclaimer 48 This presentation contains forward-looking statements, which include comments, statements and opinions with respect to our objectives and strategies, considering environment and risk conditions, and the results of our operations and business. However, by their nature, these forward-looking statements involve numerous assumptions, uncertainties and opportunities, both general and specific. We caution that these statements represent the Group’s judgments and future expectations and that we have based these forward-looking statements on our current expectations and projections about future events. The risk exists that these statements may differ materially from actual future results or events and may not be fulfilled. We caution readers of this presentation not to place undue reliance on these forward-looking statements as a number of factors could cause future Group results to differ materially from these targets. Forward-looking statements may be influenced in particular by factors such as movements in local and international securities markets, fluctuations in interest rates and exchange rates, the effects of competition in the areas in which we operate, general market, macroeconomic, governmental and regulatory trends and changes in economic, regulatory and technological conditions. We caution that the foregoing list is not exhaustive. When relying on forward-looking statements to make decisions, investors should carefully consider the aforementioned factors as well as other uncertainties and events. Any statements regarding past trends or activities should not be taken as a representation that such trends or activities will continue in the future. All forward - looking statements are based on information available to Marfin Popular Bank Public Co Ltd. on the date of this presentation and Marfin Popular Bank Public Co Ltd. assumes no obligation to update such statements, unless otherwise required by applicable law. Nothing on this presentation should be construed as a solicitation or offer, or recommendation, to acquire or dispose of any investment or to engage in any other transaction.
Contacts 49 MARFIN POPULAR BANK ( www. laiki. com ) Dimitris Spanodimos Group Head of Corporate Strategy tel. +30 210 8170 127 email: dspanodimos@marfinbank. gr Evelyn Vougessis Head of Investor Relations tel. +30 210 8170 291 email: evougessis@marfinbank. gr Dimitris Anastassakos Investor Relations tel. +30 210 8170 243 email: danastassakos@marfinbank. gr
First-half 2008 results