Financial Fitness Forever Five Steps to More Money







- Slides: 66
Financial Fitness Forever Five Steps to More Money, Less Risk and More Peace of Mind by Paul Merriman President, The Merriman Financial Education Foundation
The Merriman Financial Education Foundation Mission Statement The Merriman Financial Education Foundation believes "knowledge is power" and is dedicated to providing comprehensive financial education to investors, with information and tools to make informed decisions in their own best interest and successfully implement their retirement savings program.
Current Projects of the Merriman Foundation • Personal Investing 216 Class at Western Washington University • Weekly retirement column at Marketwatch. com • Weekly podcasts at Merriman Podcasts and itunes • Free e. Books and other free resources at paulmerriman. com • Free Bi-monthly newsletter to subscribers
What You Will Learn • • How to select the best equity investments How much in stocks and bonds How to select the best performing mutual funds How to take money out of investments in retirement • How to leave a legacy to your children/grandchildren
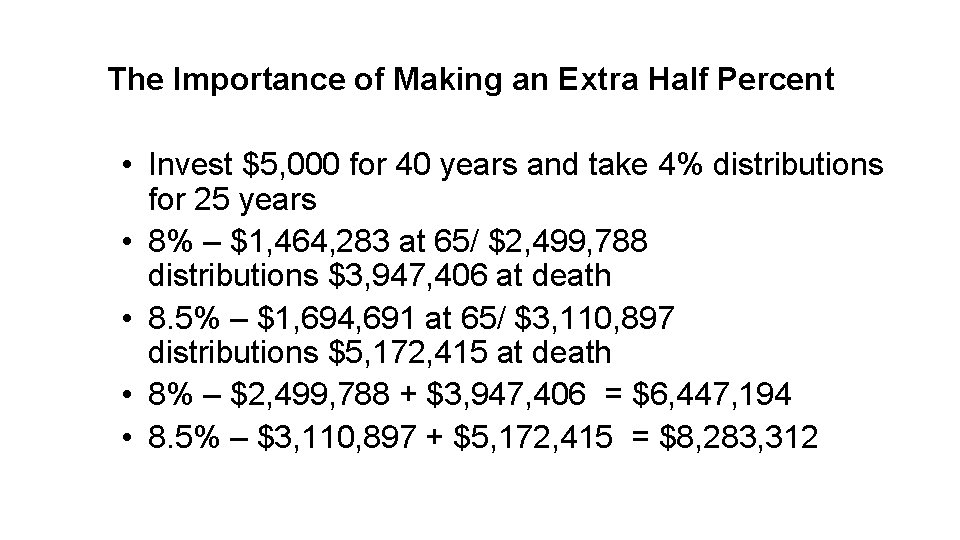
The Importance of Making an Extra Half Percent • Invest $5, 000 for 40 years and take 4% distributions for 25 years • 8% – $1, 464, 283 at 65/ $2, 499, 788 distributions $3, 947, 406 at death • 8. 5% – $1, 694, 691 at 65/ $3, 110, 897 distributions $5, 172, 415 at death • 8% – $2, 499, 788 + $3, 947, 406 = $6, 447, 194 • 8. 5% – $3, 110, 897 + $5, 172, 415 = $8, 283, 312
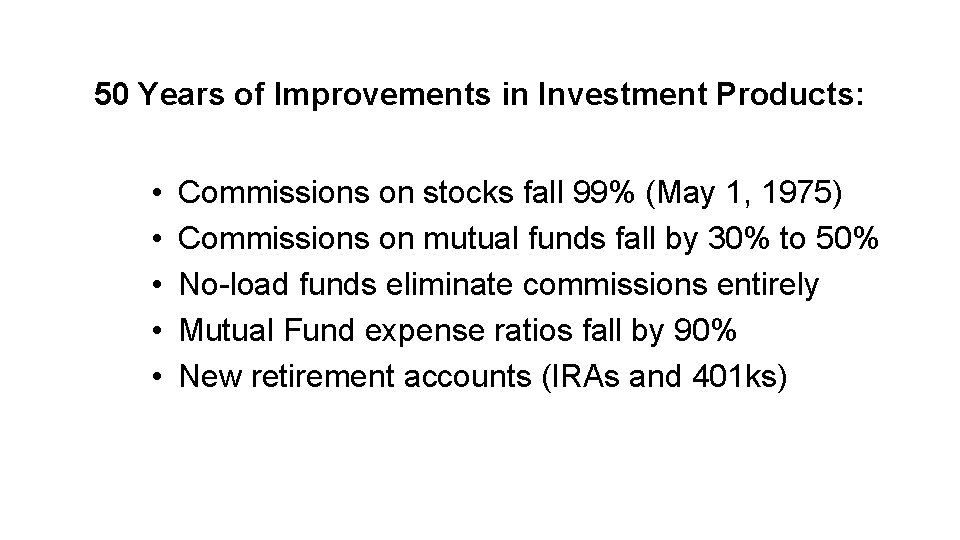
50 Years of Improvements in Investment Products: • Commissions on stocks fall 99% (May 1, 1975) • Commissions on mutual funds fall by 30% to 50% • No-load funds eliminate commissions entirely • Mutual Fund expense ratios fall by 90% • New retirement accounts (IRAs and 401 ks)
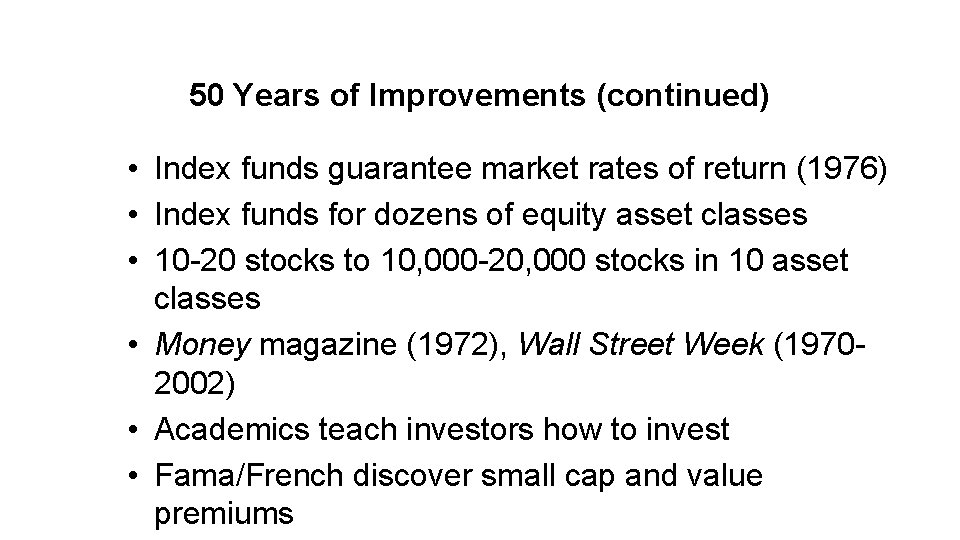
50 Years of Improvements (continued) • Index funds guarantee market rates of return (1976) • Index funds for dozens of equity asset classes • 10 -20 stocks to 10, 000 -20, 000 stocks in 10 asset classes • Money magazine (1972), Wall Street Week (19702002) • Academics teach investors how to invest • Fama/French discover small cap and value premiums
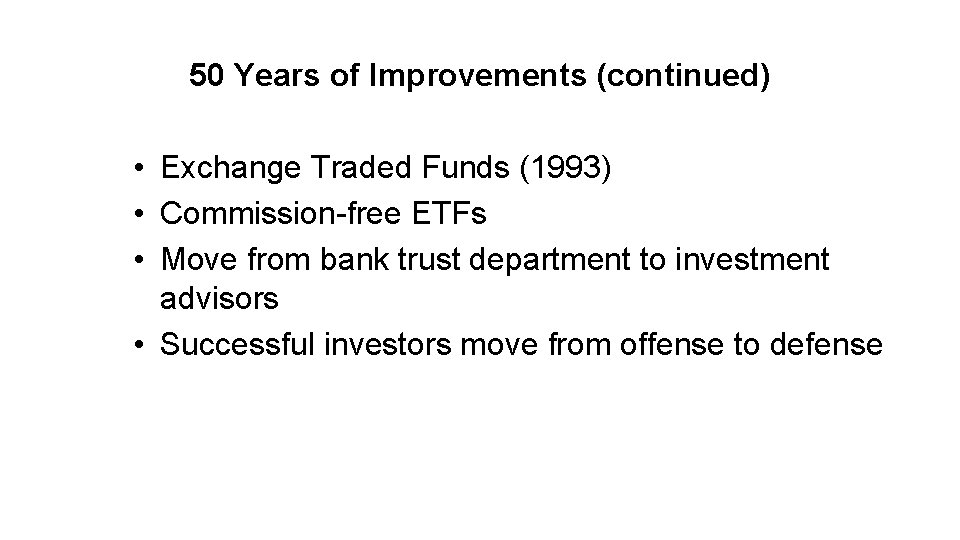
50 Years of Improvements (continued) • Exchange Traded Funds (1993) • Commission-free ETFs • Move from bank trust department to investment advisors • Successful investors move from offense to defense
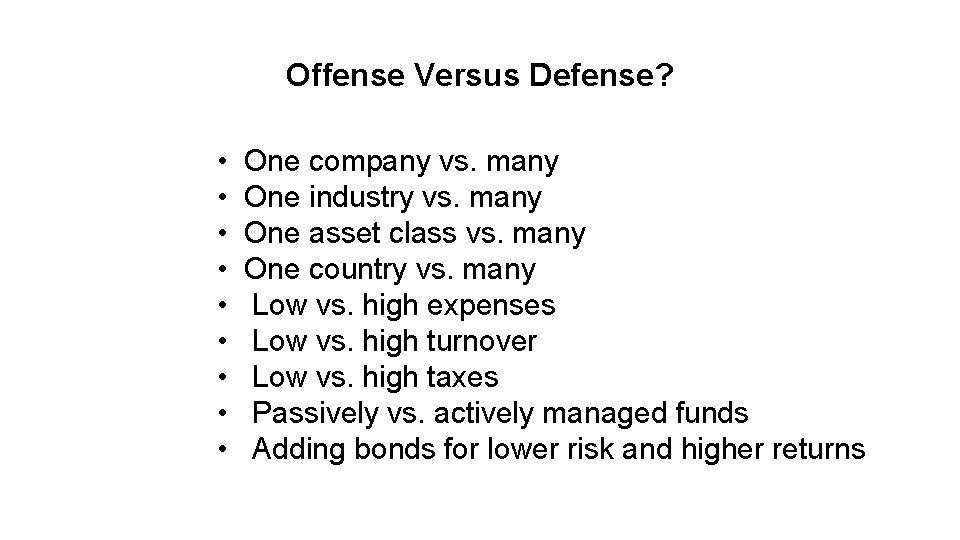
Offense Versus Defense? • • • One company vs. many One industry vs. many One asset class vs. many One country vs. many Low vs. high expenses Low vs. high turnover Low vs. high taxes Passively vs. actively managed funds Adding bonds for lower risk and higher returns
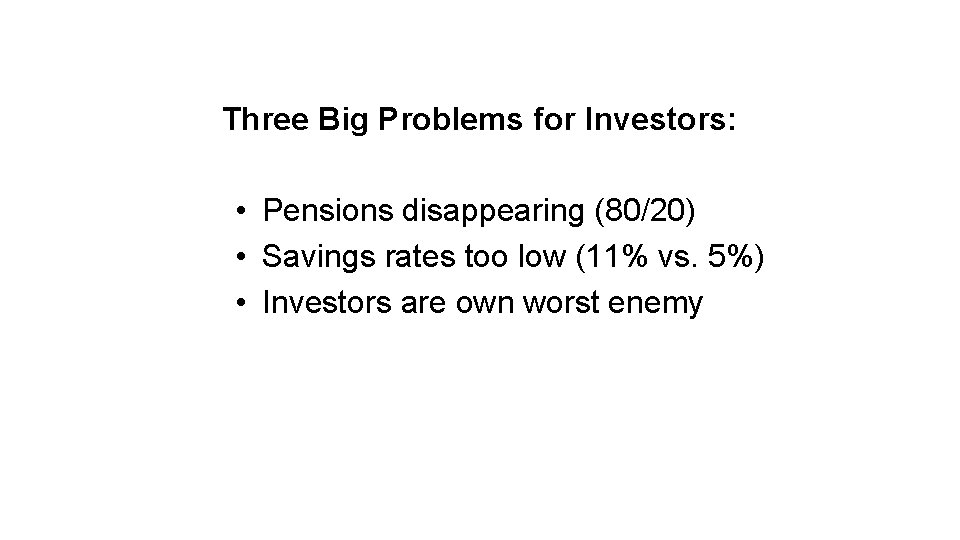
Three Big Problems for Investors: • Pensions disappearing (80/20) • Savings rates too low (11% vs. 5%) • Investors are own worst enemy
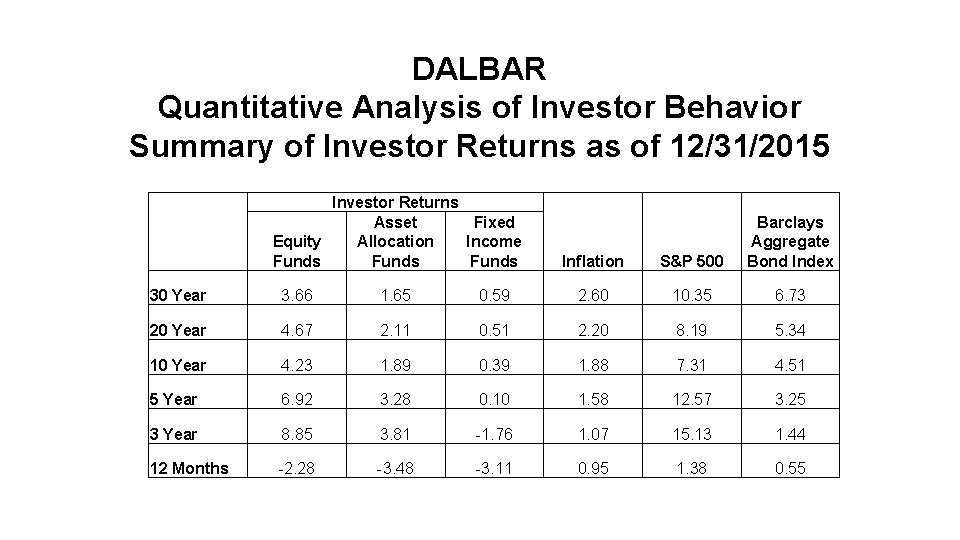
DALBAR Quantitative Analysis of Investor Behavior Summary of Investor Returns as of 12/31/2015 Investor Returns Asset Fixed Allocation Income Equity Funds Inflation S&P 500 Barclays Aggregate Bond Index 30 Year 3. 66 1. 65 0. 59 2. 60 10. 35 6. 73 20 Year 4. 67 2. 11 0. 51 2. 20 8. 19 5. 34 10 Year 4. 23 1. 89 0. 39 1. 88 7. 31 4. 51 5 Year 6. 92 3. 28 0. 10 1. 58 12. 57 3. 25 3 Year 8. 85 3. 81 -1. 76 1. 07 15. 13 1. 44 12 Months -2. 28 -3. 48 -3. 11 0. 95 1. 38 0. 55
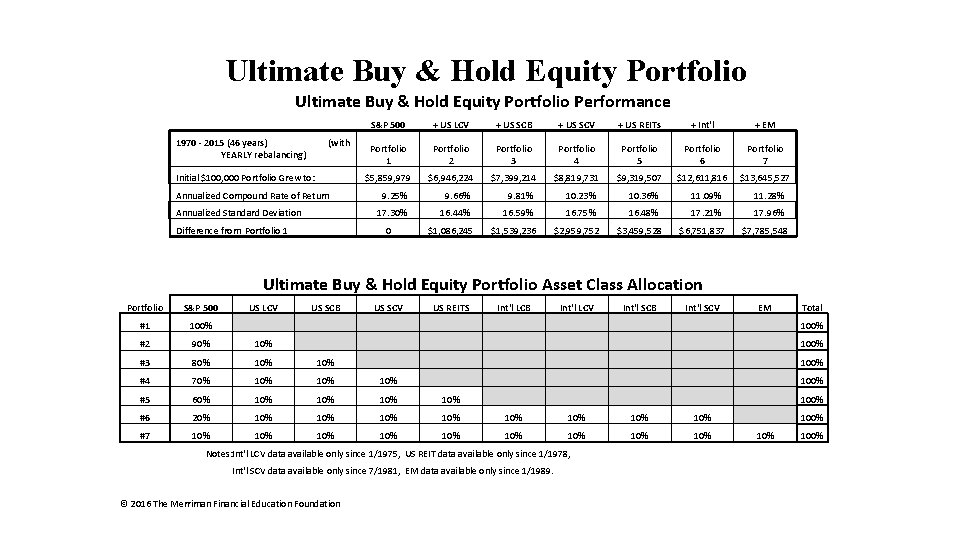
Ultimate Buy & Hold Equity Portfolio Performance 1970 - 2015 (46 years) YEARLY rebalancing) (with Initial $100, 000 Portfolio Grew to: Annualized Compound Rate of Return Annualized Standard Deviation Difference from Portfolio 1 S&P 500 + US LCV + US SCB + US SCV + US REITs + Int'l + EM Portfolio 1 Portfolio 2 Portfolio 3 Portfolio 4 Portfolio 5 Portfolio 6 Portfolio 7 $5, 859, 979 $6, 946, 224 $7, 399, 214 $8, 819, 731 $9, 319, 507 $12, 611, 816 $13, 645, 527 9. 25% 9. 66% 9. 81% 10. 23% 10. 36% 11. 09% 11. 28% 17. 30% 16. 44% 16. 59% 16. 75% 16. 48% 17. 21% 17. 96% 0 $1, 086, 245 $1, 539, 236 $2, 959, 752 $3, 459, 528 $6, 751, 837 $7, 785, 548 Ultimate Buy & Hold Equity Portfolio Asset Class Allocation Portfolio S&P 500 US LCV US SCB US SCV US REITS Int'l LCB Int'l LCV #1 100% 100% #2 90% 10% 100% #3 80% 10% 100% #4 70% 10% 10% 100% #5 60% 10% 10% 100% #6 20% 10% 10% 100% #7 10% 10% 10% Notes: Int'l LCV data available only since 1/1975, US REIT data available only since 1/1978, Int'l SCV data available only since 7/1981, EM data available only since 1/1989. © 2016 The Merriman Financial Education Foundation Int'l SCB Int'l SCV EM 10% Total 100%
Four Fund Solution Table Summary of 1 Yr. Period Results 1928 -2015
Four Fund Solution Table (continued) Summary of 15 Yr. Period Results 1928 -2015
Four Fund Solution Table (continued) Summary of 40 Yr. Period Results 1928 -2015
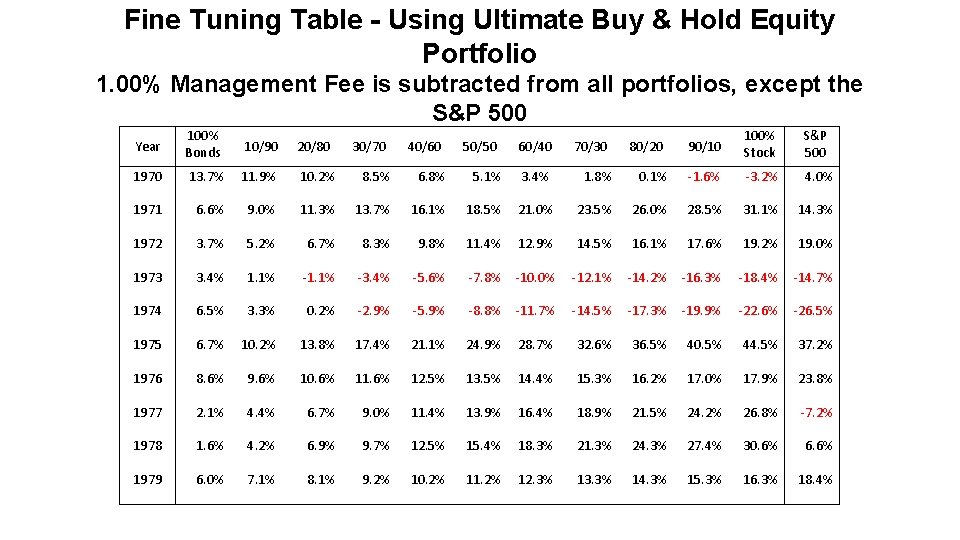
Fine Tuning Table - Using Ultimate Buy & Hold Equity Portfolio 1. 00% Management Fee is subtracted from all portfolios, except the S&P 500 Year 100% Bonds 10/90 20/80 30/70 40/60 50/50 60/40 70/30 80/20 90/10 100% Stock S&P 500 1970 13. 7% 11. 9% 10. 2% 8. 5% 6. 8% 5. 1% 3. 4% 1. 8% 0. 1% ‐ 1. 6% ‐ 3. 2% 4. 0% 1971 6. 6% 9. 0% 11. 3% 13. 7% 16. 1% 18. 5% 21. 0% 23. 5% 26. 0% 28. 5% 31. 1% 14. 3% 1972 3. 7% 5. 2% 6. 7% 8. 3% 9. 8% 11. 4% 12. 9% 14. 5% 16. 1% 17. 6% 19. 2% 19. 0% 1973 3. 4% 1. 1% ‐ 3. 4% ‐ 5. 6% ‐ 7. 8% ‐ 10. 0% ‐ 12. 1% ‐ 14. 2% ‐ 16. 3% ‐ 18. 4% ‐ 14. 7% 1974 6. 5% 3. 3% 0. 2% ‐ 2. 9% ‐ 5. 9% ‐ 8. 8% ‐ 11. 7% ‐ 14. 5% ‐ 17. 3% ‐ 19. 9% ‐ 22. 6% ‐ 26. 5% 1975 6. 7% 10. 2% 13. 8% 17. 4% 21. 1% 24. 9% 28. 7% 32. 6% 36. 5% 40. 5% 44. 5% 37. 2% 1976 8. 6% 9. 6% 10. 6% 11. 6% 12. 5% 13. 5% 14. 4% 15. 3% 16. 2% 17. 0% 17. 9% 23. 8% 1977 2. 1% 4. 4% 6. 7% 9. 0% 11. 4% 13. 9% 16. 4% 18. 9% 21. 5% 24. 2% 26. 8% ‐ 7. 2% 1978 1. 6% 4. 2% 6. 9% 9. 7% 12. 5% 15. 4% 18. 3% 21. 3% 24. 3% 27. 4% 30. 6% 6. 6% 1979 6. 0% 7. 1% 8. 1% 9. 2% 10. 2% 11. 2% 12. 3% 13. 3% 14. 3% 15. 3% 16. 3% 18. 4%
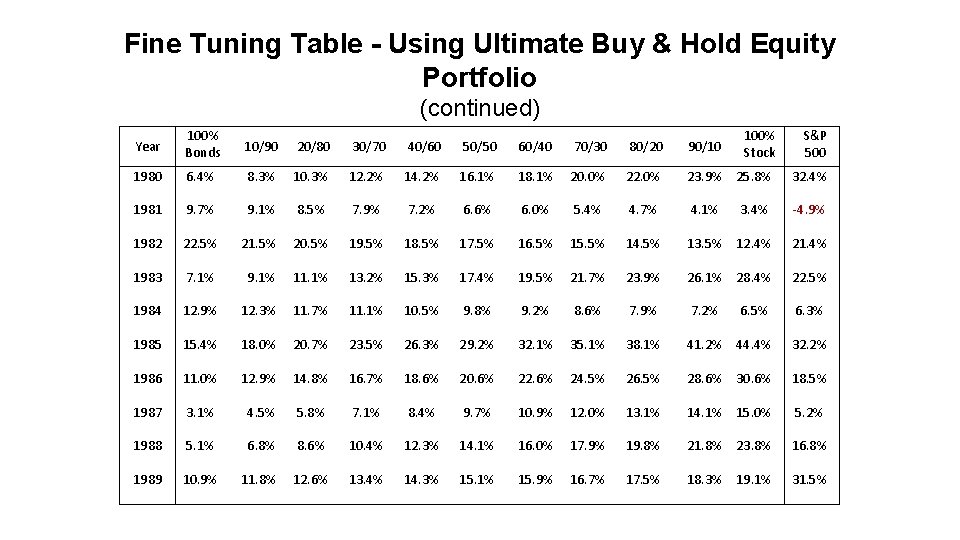
Fine Tuning Table - Using Ultimate Buy & Hold Equity Portfolio (continued) Year 100% Bonds 10/90 20/80 30/70 40/60 50/50 60/40 70/30 80/20 90/10 100% Stock S&P 500 1980 6. 4% 8. 3% 10. 3% 12. 2% 14. 2% 16. 1% 18. 1% 20. 0% 22. 0% 23. 9% 25. 8% 32. 4% 1981 9. 7% 9. 1% 8. 5% 7. 9% 7. 2% 6. 6% 6. 0% 5. 4% 4. 7% 4. 1% 3. 4% ‐ 4. 9% 1982 22. 5% 21. 5% 20. 5% 19. 5% 18. 5% 17. 5% 16. 5% 15. 5% 14. 5% 13. 5% 12. 4% 21. 4% 1983 7. 1% 9. 1% 11. 1% 13. 2% 15. 3% 17. 4% 19. 5% 21. 7% 23. 9% 26. 1% 28. 4% 22. 5% 1984 12. 9% 12. 3% 11. 7% 11. 1% 10. 5% 9. 8% 9. 2% 8. 6% 7. 9% 7. 2% 6. 5% 6. 3% 1985 15. 4% 18. 0% 20. 7% 23. 5% 26. 3% 29. 2% 32. 1% 35. 1% 38. 1% 41. 2% 44. 4% 32. 2% 1986 11. 0% 12. 9% 14. 8% 16. 7% 18. 6% 20. 6% 22. 6% 24. 5% 26. 5% 28. 6% 30. 6% 18. 5% 1987 3. 1% 4. 5% 5. 8% 7. 1% 8. 4% 9. 7% 10. 9% 12. 0% 13. 1% 14. 1% 15. 0% 5. 2% 1988 5. 1% 6. 8% 8. 6% 10. 4% 12. 3% 14. 1% 16. 0% 17. 9% 19. 8% 21. 8% 23. 8% 16. 8% 1989 10. 9% 11. 8% 12. 6% 13. 4% 14. 3% 15. 1% 15. 9% 16. 7% 17. 5% 18. 3% 19. 1% 31. 5%
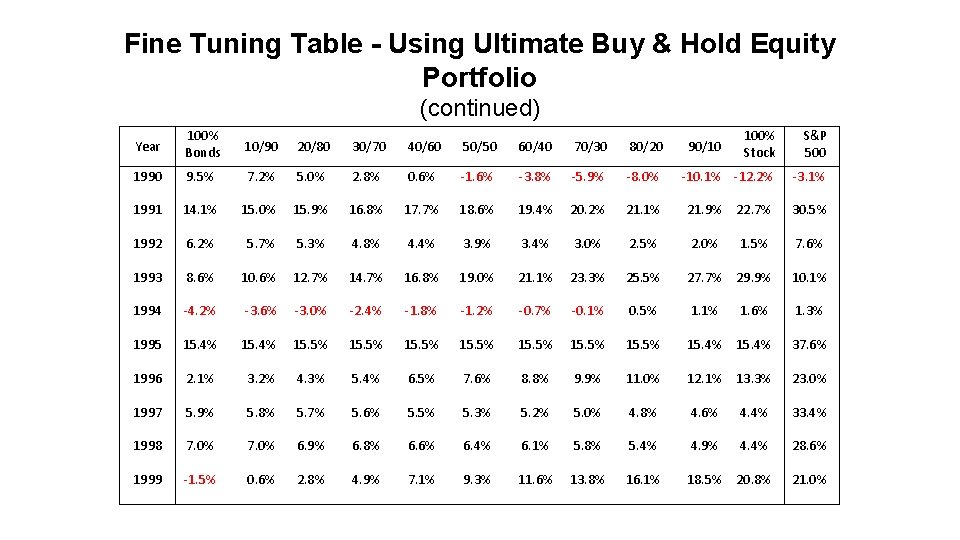
Fine Tuning Table - Using Ultimate Buy & Hold Equity Portfolio (continued) Year 100% Bonds 10/90 20/80 30/70 40/60 50/50 60/40 70/30 80/20 100% Stock S&P 500 1990 9. 5% 7. 2% 5. 0% 2. 8% 0. 6% ‐ 1. 6% ‐ 3. 8% ‐ 5. 9% ‐ 8. 0% ‐ 10. 1% ‐ 12. 2% ‐ 3. 1% 1991 14. 1% 15. 0% 15. 9% 16. 8% 17. 7% 18. 6% 19. 4% 20. 2% 21. 1% 21. 9% 22. 7% 30. 5% 1992 6. 2% 5. 7% 5. 3% 4. 8% 4. 4% 3. 9% 3. 4% 3. 0% 2. 5% 2. 0% 1. 5% 7. 6% 1993 8. 6% 10. 6% 12. 7% 14. 7% 16. 8% 19. 0% 21. 1% 23. 3% 25. 5% 27. 7% 29. 9% 10. 1% 1994 ‐ 4. 2% ‐ 3. 6% ‐ 3. 0% ‐ 2. 4% ‐ 1. 8% ‐ 1. 2% ‐ 0. 7% ‐ 0. 1% 0. 5% 1. 1% 1. 6% 1. 3% 1995 15. 4% 15. 5% 15. 4% 37. 6% 1996 2. 1% 3. 2% 4. 3% 5. 4% 6. 5% 7. 6% 8. 8% 9. 9% 11. 0% 12. 1% 13. 3% 23. 0% 1997 5. 9% 5. 8% 5. 7% 5. 6% 5. 5% 5. 3% 5. 2% 5. 0% 4. 8% 4. 6% 4. 4% 33. 4% 1998 7. 0% 6. 9% 6. 8% 6. 6% 6. 4% 6. 1% 5. 8% 5. 4% 4. 9% 4. 4% 28. 6% 1999 ‐ 1. 5% 0. 6% 2. 8% 4. 9% 7. 1% 9. 3% 11. 6% 13. 8% 16. 1% 18. 5% 20. 8% 21. 0% 90/10
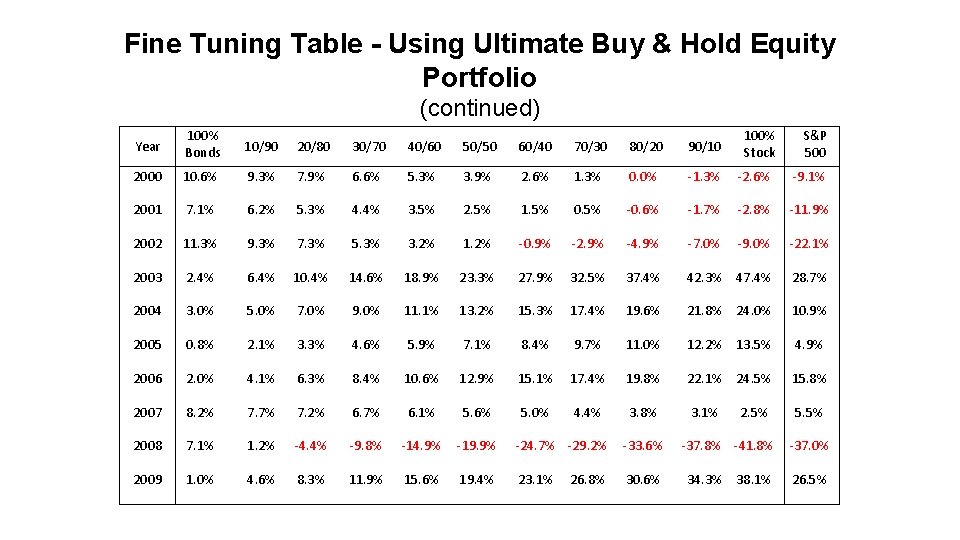
Fine Tuning Table - Using Ultimate Buy & Hold Equity Portfolio (continued) Year 100% Bonds 10/90 20/80 30/70 40/60 50/50 60/40 70/30 80/20 90/10 2000 10. 6% 9. 3% 7. 9% 6. 6% 5. 3% 3. 9% 2. 6% 1. 3% 0. 0% ‐ 1. 3% ‐ 2. 6% ‐ 9. 1% 2001 7. 1% 6. 2% 5. 3% 4. 4% 3. 5% 2. 5% 1. 5% 0. 5% ‐ 0. 6% ‐ 1. 7% ‐ 2. 8% ‐ 11. 9% 2002 11. 3% 9. 3% 7. 3% 5. 3% 3. 2% 1. 2% ‐ 0. 9% ‐ 2. 9% ‐ 4. 9% ‐ 7. 0% ‐ 9. 0% ‐ 22. 1% 2003 2. 4% 6. 4% 10. 4% 14. 6% 18. 9% 23. 3% 27. 9% 32. 5% 37. 4% 42. 3% 47. 4% 28. 7% 2004 3. 0% 5. 0% 7. 0% 9. 0% 11. 1% 13. 2% 15. 3% 17. 4% 19. 6% 21. 8% 24. 0% 10. 9% 2005 0. 8% 2. 1% 3. 3% 4. 6% 5. 9% 7. 1% 8. 4% 9. 7% 11. 0% 12. 2% 13. 5% 4. 9% 2006 2. 0% 4. 1% 6. 3% 8. 4% 10. 6% 12. 9% 15. 1% 17. 4% 19. 8% 22. 1% 24. 5% 15. 8% 2007 8. 2% 7. 7% 7. 2% 6. 7% 6. 1% 5. 6% 5. 0% 4. 4% 3. 8% 3. 1% 2. 5% 5. 5% 2008 7. 1% 1. 2% ‐ 4. 4% ‐ 9. 8% ‐ 14. 9% ‐ 19. 9% ‐ 24. 7% ‐ 29. 2% ‐ 33. 6% 2009 1. 0% 4. 6% 8. 3% 11. 9% 15. 6% 19. 4% 23. 1% 30. 6% 26. 8% 100% Stock ‐ 37. 8% ‐ 41. 8% 34. 3% 38. 1% S&P 500 ‐ 37. 0% 26. 5%
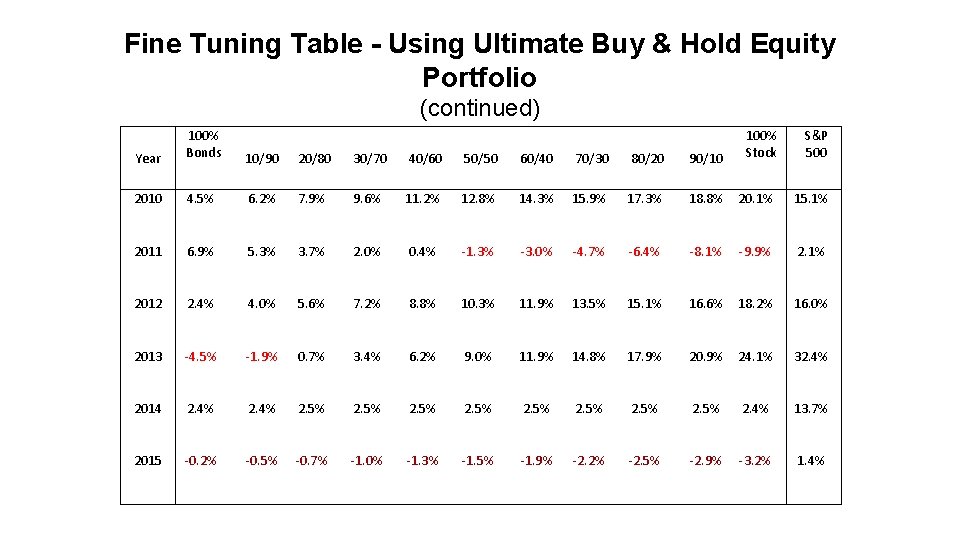
Fine Tuning Table - Using Ultimate Buy & Hold Equity Portfolio (continued) Year 100% Bonds 100% Stock S&P 500 10/90 20/80 30/70 40/60 50/50 60/40 70/30 80/20 90/10 2010 4. 5% 6. 2% 7. 9% 9. 6% 11. 2% 12. 8% 14. 3% 15. 9% 17. 3% 18. 8% 20. 1% 15. 1% 2011 6. 9% 5. 3% 3. 7% 2. 0% 0. 4% ‐ 1. 3% ‐ 3. 0% ‐ 4. 7% ‐ 6. 4% ‐ 8. 1% ‐ 9. 9% 2. 1% 2012 2. 4% 4. 0% 5. 6% 7. 2% 8. 8% 10. 3% 11. 9% 13. 5% 15. 1% 16. 6% 18. 2% 16. 0% 2013 ‐ 4. 5% ‐ 1. 9% 0. 7% 3. 4% 6. 2% 9. 0% 11. 9% 14. 8% 17. 9% 20. 9% 24. 1% 32. 4% 2014 2. 4% 2. 5% 2. 4% 13. 7% 2015 ‐ 0. 2% ‐ 0. 5% ‐ 0. 7% ‐ 1. 0% ‐ 1. 3% ‐ 1. 5% ‐ 1. 9% ‐ 2. 2% ‐ 2. 5% ‐ 2. 9% ‐ 3. 2% 1. 4%
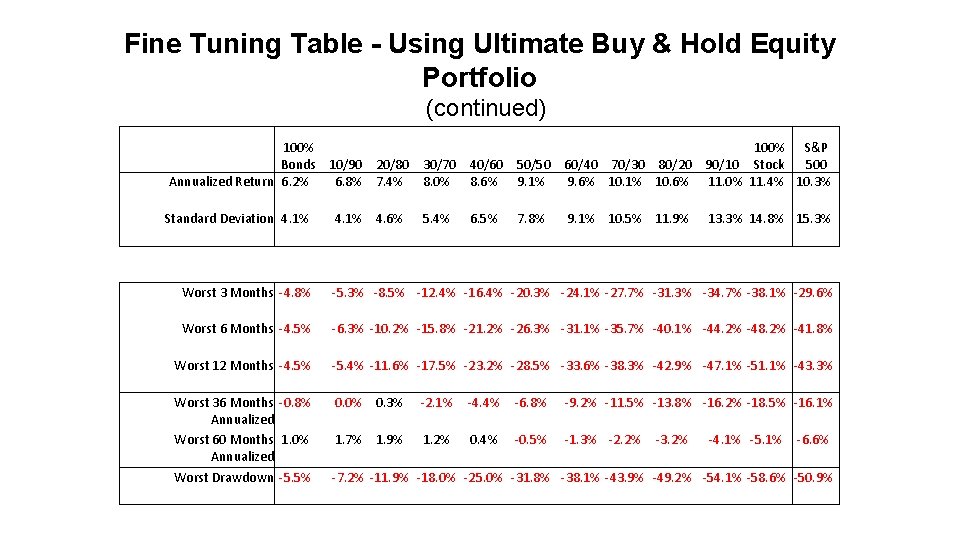
Fine Tuning Table - Using Ultimate Buy & Hold Equity Portfolio (continued) 100% S&P Bonds 10/90 20/80 30/70 40/60 50/50 60/40 70/30 80/20 90/10 Stock 500 Annualized Return 6. 2% 6. 8% 7. 4% 8. 0% 8. 6% 9. 1% 9. 6% 10. 1% 10. 6% 11. 0% 11. 4% 10. 3% Standard Deviation 4. 1% 4. 6% 5. 4% 6. 5% 7. 8% 9. 1% 10. 5% 11. 9% 13. 3% 14. 8% 15. 3% Worst 3 Months ‐ 4. 8% ‐ 5. 3% ‐ 8. 5% ‐ 12. 4% ‐ 16. 4% ‐ 20. 3% ‐ 24. 1% ‐ 27. 7% ‐ 31. 3% ‐ 34. 7% ‐ 38. 1% ‐ 29. 6% Worst 6 Months ‐ 4. 5% ‐ 6. 3% ‐ 10. 2% ‐ 15. 8% ‐ 21. 2% ‐ 26. 3% ‐ 31. 1% ‐ 35. 7% ‐ 40. 1% ‐ 44. 2% ‐ 48. 2% ‐ 41. 8% Worst 12 Months ‐ 4. 5% ‐ 5. 4% ‐ 11. 6% ‐ 17. 5% ‐ 23. 2% ‐ 28. 5% ‐ 33. 6% ‐ 38. 3% ‐ 42. 9% ‐ 47. 1% ‐ 51. 1% ‐ 43. 3% Worst 36 Months ‐ 0. 8% Annualized Worst 60 Months 1. 0% Annualized Worst Drawdown ‐ 5. 5% 0. 0% 0. 3% ‐ 2. 1% ‐ 4. 4% ‐ 6. 8% ‐ 9. 2% ‐ 11. 5% ‐ 13. 8% ‐ 16. 2% ‐ 18. 5% ‐ 16. 1% 1. 7% 1. 9% 1. 2% 0. 4% ‐ 0. 5% ‐ 1. 3% ‐ 2. 2% ‐ 3. 2% ‐ 4. 1% ‐ 5. 1% ‐ 6. 6% ‐ 7. 2% ‐ 11. 9% ‐ 18. 0% ‐ 25. 0% ‐ 31. 8% ‐ 38. 1% ‐ 43. 9% ‐ 49. 2% ‐ 54. 1% ‐ 58. 6% ‐ 50. 9%
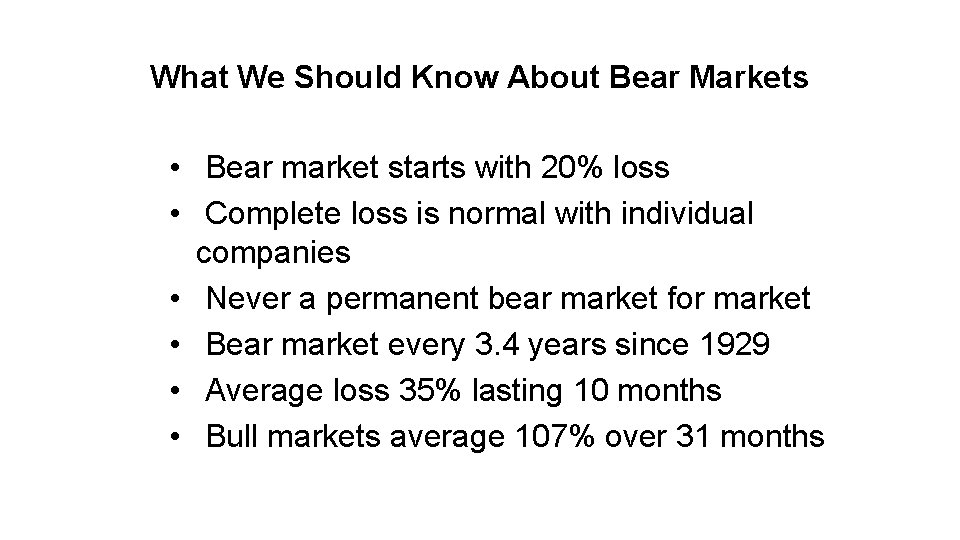
What We Should Know About Bear Markets • Bear market starts with 20% loss • Complete loss is normal with individual companies • Never a permanent bear market for market • Bear market every 3. 4 years since 1929 • Average loss 35% lasting 10 months • Bull markets average 107% over 31 months
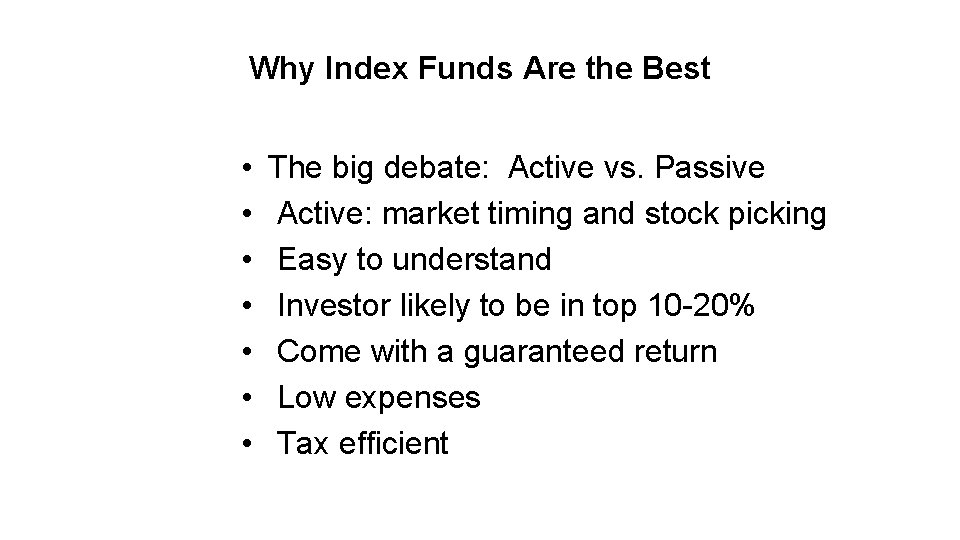
Why Index Funds Are the Best • • The big debate: Active vs. Passive Active: market timing and stock picking Easy to understand Investor likely to be in top 10 -20% Come with a guaranteed return Low expenses Tax efficient
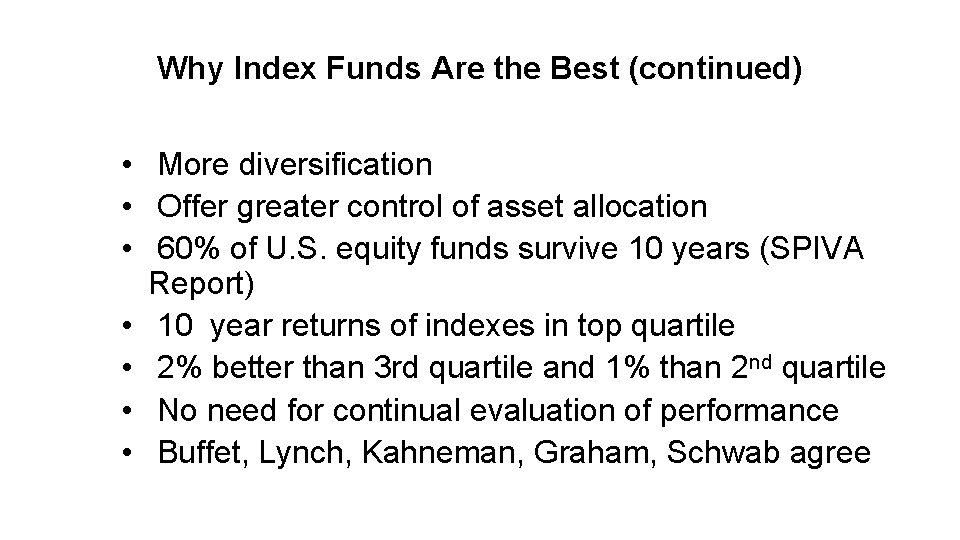
Why Index Funds Are the Best (continued) • More diversification • Offer greater control of asset allocation • 60% of U. S. equity funds survive 10 years (SPIVA Report) • 10 year returns of indexes in top quartile • 2% better than 3 rd quartile and 1% than 2 nd quartile • No need for continual evaluation of performance • Buffet, Lynch, Kahneman, Graham, Schwab agree
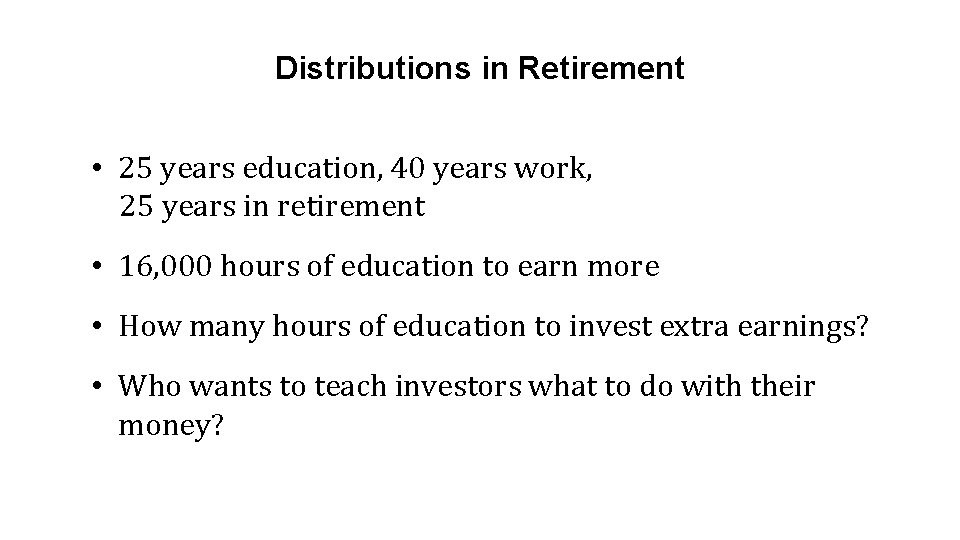
Distributions in Retirement • 25 years education, 40 years work, 25 years in retirement • 16, 000 hours of education to earn more • How many hours of education to invest extra earnings? • Who wants to teach investors what to do with their money?
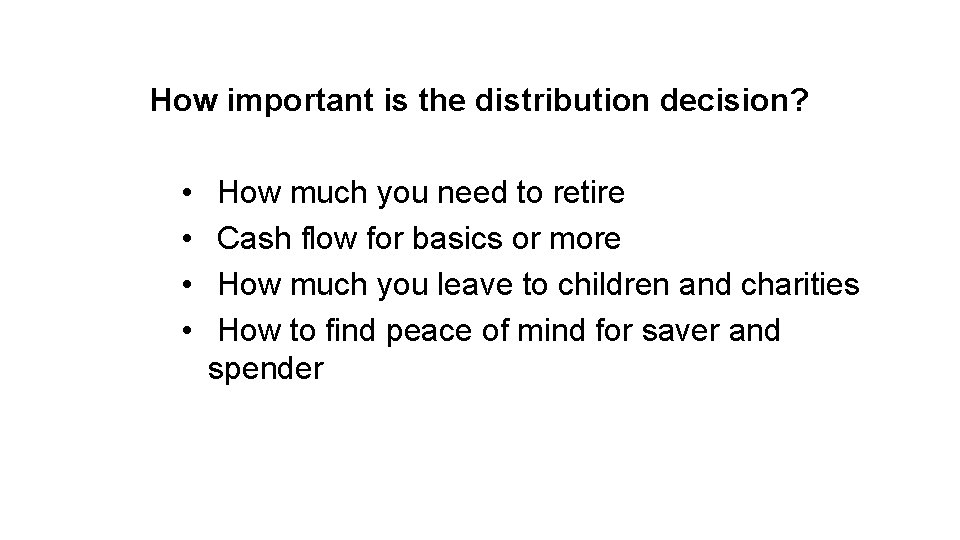
How important is the distribution decision? • • How much you need to retire Cash flow for basics or more How much you leave to children and charities How to find peace of mind for saver and spender
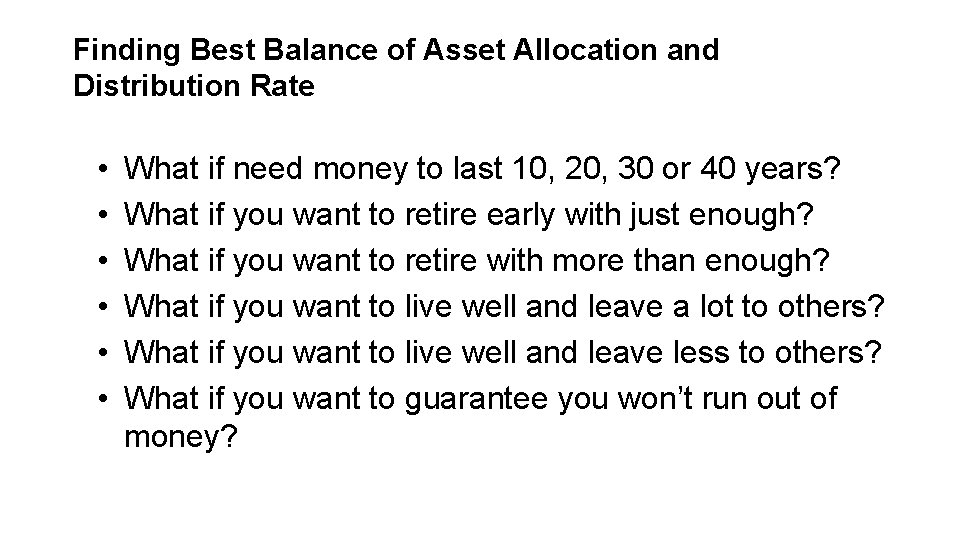
Finding Best Balance of Asset Allocation and Distribution Rate • • • What if need money to last 10, 20, 30 or 40 years? What if you want to retire early with just enough? What if you want to retire with more than enough? What if you want to live well and leave a lot to others? What if you want to live well and leave less to others? What if you want to guarantee you won’t run out of money?
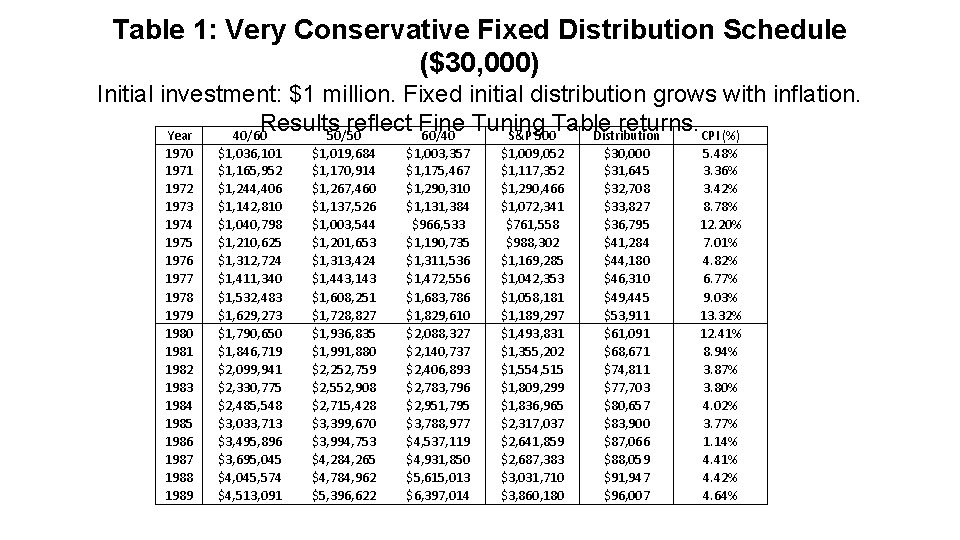
Table 1: Very Conservative Fixed Distribution Schedule ($30, 000) Initial investment: $1 million. Fixed initial distribution grows with inflation. Results reflect Fine Tuning Table returns. Year 40/60 50/50 60/40 S&P 500 Distribution CPI (%) 1970 1971 1972 1973 1974 1975 1976 1977 1978 1979 1980 1981 1982 1983 1984 1985 1986 1987 1988 1989 $1, 036, 101 $1, 165, 952 $1, 244, 406 $1, 142, 810 $1, 040, 798 $1, 210, 625 $1, 312, 724 $1, 411, 340 $1, 532, 483 $1, 629, 273 $1, 790, 650 $1, 846, 719 $2, 099, 941 $2, 330, 775 $2, 485, 548 $3, 033, 713 $3, 495, 896 $3, 695, 045 $4, 045, 574 $4, 513, 091 $1, 019, 684 $1, 170, 914 $1, 267, 460 $1, 137, 526 $1, 003, 544 $1, 201, 653 $1, 313, 424 $1, 443, 143 $1, 608, 251 $1, 728, 827 $1, 936, 835 $1, 991, 880 $2, 252, 759 $2, 552, 908 $2, 715, 428 $3, 399, 670 $3, 994, 753 $4, 284, 265 $4, 784, 962 $5, 396, 622 $1, 003, 357 $1, 175, 467 $1, 290, 310 $1, 131, 384 $966, 533 $1, 190, 735 $1, 311, 536 $1, 472, 556 $1, 683, 786 $1, 829, 610 $2, 088, 327 $2, 140, 737 $2, 406, 893 $2, 783, 796 $2, 951, 795 $3, 788, 977 $4, 537, 119 $4, 931, 850 $5, 615, 013 $6, 397, 014 $1, 009, 052 $1, 117, 352 $1, 290, 466 $1, 072, 341 $761, 558 $988, 302 $1, 169, 285 $1, 042, 353 $1, 058, 181 $1, 189, 297 $1, 493, 831 $1, 355, 202 $1, 554, 515 $1, 809, 299 $1, 836, 965 $2, 317, 037 $2, 641, 859 $2, 687, 383 $3, 031, 710 $3, 860, 180 $30, 000 $31, 645 $32, 708 $33, 827 $36, 795 $41, 284 $44, 180 $46, 310 $49, 445 $53, 911 $61, 091 $68, 671 $74, 811 $77, 703 $80, 657 $83, 900 $87, 066 $88, 059 $91, 947 $96, 007 5. 48% 3. 36% 3. 42% 8. 78% 12. 20% 7. 01% 4. 82% 6. 77% 9. 03% 13. 32% 12. 41% 8. 94% 3. 87% 3. 80% 4. 02% 3. 77% 1. 14% 4. 41% 4. 42% 4. 64%
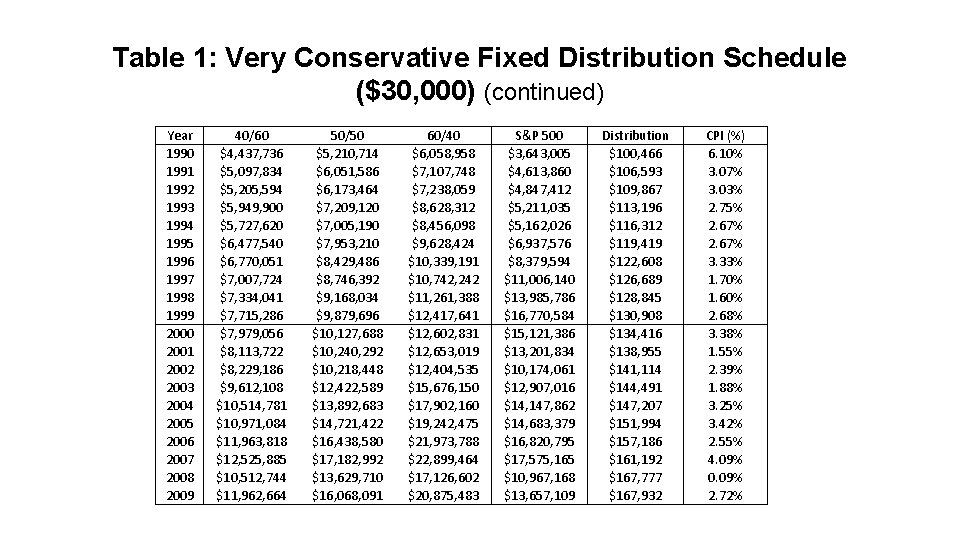
Table 1: Very Conservative Fixed Distribution Schedule ($30, 000) (continued) Year 1990 1991 1992 1993 1994 1995 1996 1997 1998 1999 2000 2001 2002 2003 2004 2005 2006 2007 2008 2009 40/60 $4, 437, 736 $5, 097, 834 $5, 205, 594 $5, 949, 900 $5, 727, 620 $6, 477, 540 $6, 770, 051 $7, 007, 724 $7, 334, 041 $7, 715, 286 $7, 979, 056 $8, 113, 722 $8, 229, 186 $9, 612, 108 $10, 514, 781 $10, 971, 084 $11, 963, 818 $12, 525, 885 $10, 512, 744 $11, 962, 664 50/50 $5, 210, 714 $6, 051, 586 $6, 173, 464 $7, 209, 120 $7, 005, 190 $7, 953, 210 $8, 429, 486 $8, 746, 392 $9, 168, 034 $9, 879, 696 $10, 127, 688 $10, 240, 292 $10, 218, 448 $12, 422, 589 $13, 892, 683 $14, 721, 422 $16, 438, 580 $17, 182, 992 $13, 629, 710 $16, 068, 091 60/40 $6, 058, 958 $7, 107, 748 $7, 238, 059 $8, 628, 312 $8, 456, 098 $9, 628, 424 $10, 339, 191 $10, 742, 242 $11, 261, 388 $12, 417, 641 $12, 602, 831 $12, 653, 019 $12, 404, 535 $15, 676, 150 $17, 902, 160 $19, 242, 475 $21, 973, 788 $22, 899, 464 $17, 126, 602 $20, 875, 483 S&P 500 $3, 643, 005 $4, 613, 860 $4, 847, 412 $5, 211, 035 $5, 162, 026 $6, 937, 576 $8, 379, 594 $11, 006, 140 $13, 985, 786 $16, 770, 584 $15, 121, 386 $13, 201, 834 $10, 174, 061 $12, 907, 016 $14, 147, 862 $14, 683, 379 $16, 820, 795 $17, 575, 165 $10, 967, 168 $13, 657, 109 Distribution $100, 466 $106, 593 $109, 867 $113, 196 $116, 312 $119, 419 $122, 608 $126, 689 $128, 845 $130, 908 $134, 416 $138, 955 $141, 114 $144, 491 $147, 207 $151, 994 $157, 186 $161, 192 $167, 777 $167, 932 CPI (%) 6. 10% 3. 07% 3. 03% 2. 75% 2. 67% 3. 33% 1. 70% 1. 60% 2. 68% 3. 38% 1. 55% 2. 39% 1. 88% 3. 25% 3. 42% 2. 55% 4. 09% 0. 09% 2. 72%
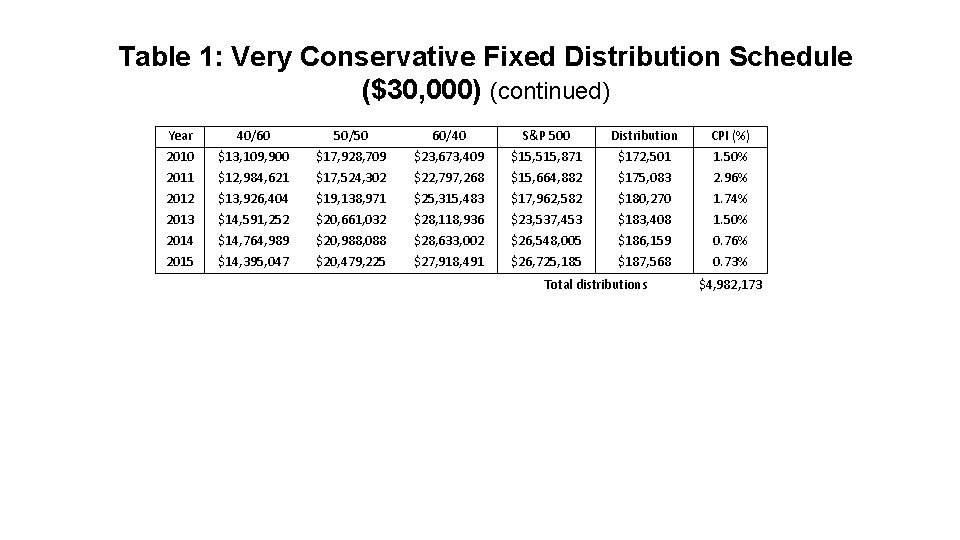
Table 1: Very Conservative Fixed Distribution Schedule ($30, 000) (continued) Year 2010 2011 2012 2013 2014 40/60 $13, 109, 900 $12, 984, 621 $13, 926, 404 $14, 591, 252 $14, 764, 989 50/50 $17, 928, 709 $17, 524, 302 $19, 138, 971 $20, 661, 032 $20, 988, 088 60/40 $23, 673, 409 $22, 797, 268 $25, 315, 483 $28, 118, 936 $28, 633, 002 S&P 500 $15, 515, 871 $15, 664, 882 $17, 962, 582 $23, 537, 453 $26, 548, 005 Distribution $172, 501 $175, 083 $180, 270 $183, 408 $186, 159 CPI (%) 1. 50% 2. 96% 1. 74% 1. 50% 0. 76% 2015 $14, 395, 047 $20, 479, 225 $27, 918, 491 $26, 725, 185 $187, 568 0. 73% Total distributions $4, 982, 173
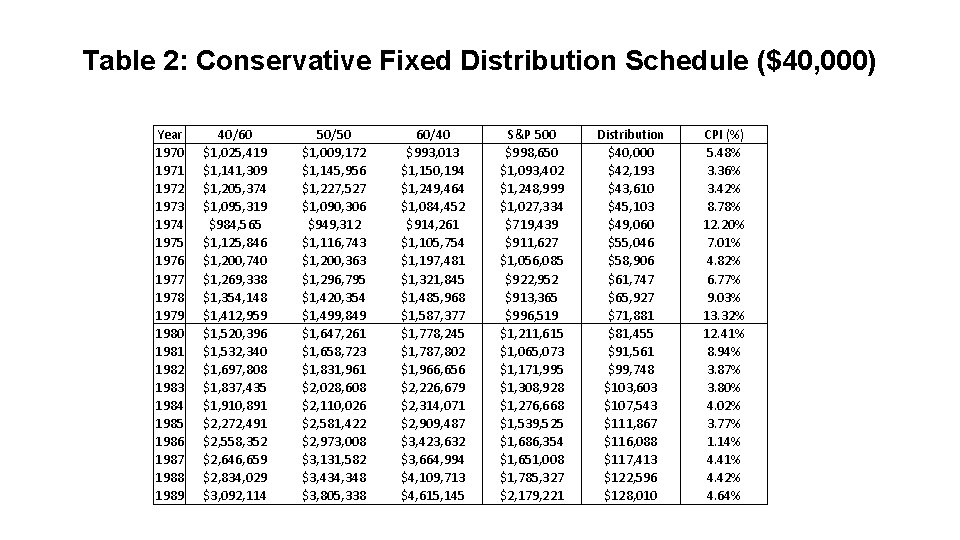
Table 2: Conservative Fixed Distribution Schedule ($40, 000) Year 1970 1971 1972 1973 1974 1975 1976 1977 1978 1979 1980 1981 1982 1983 1984 1985 1986 1987 1988 1989 40/60 $1, 025, 419 $1, 141, 309 $1, 205, 374 $1, 095, 319 $984, 565 $1, 125, 846 $1, 200, 740 $1, 269, 338 $1, 354, 148 $1, 412, 959 $1, 520, 396 $1, 532, 340 $1, 697, 808 $1, 837, 435 $1, 910, 891 $2, 272, 491 $2, 558, 352 $2, 646, 659 $2, 834, 029 $3, 092, 114 50/50 $1, 009, 172 $1, 145, 956 $1, 227, 527 $1, 090, 306 $949, 312 $1, 116, 743 $1, 200, 363 $1, 296, 795 $1, 420, 354 $1, 499, 849 $1, 647, 261 $1, 658, 723 $1, 831, 961 $2, 028, 608 $2, 110, 026 $2, 581, 422 $2, 973, 008 $3, 131, 582 $3, 434, 348 $3, 805, 338 60/40 $993, 013 $1, 150, 194 $1, 249, 464 $1, 084, 452 $914, 261 $1, 105, 754 $1, 197, 481 $1, 321, 845 $1, 485, 968 $1, 587, 377 $1, 778, 245 $1, 787, 802 $1, 966, 656 $2, 226, 679 $2, 314, 071 $2, 909, 487 $3, 423, 632 $3, 664, 994 $4, 109, 713 $4, 615, 145 S&P 500 $998, 650 $1, 093, 402 $1, 248, 999 $1, 027, 334 $719, 439 $911, 627 $1, 056, 085 $922, 952 $913, 365 $996, 519 $1, 211, 615 $1, 065, 073 $1, 171, 995 $1, 308, 928 $1, 276, 668 $1, 539, 525 $1, 686, 354 $1, 651, 008 $1, 785, 327 $2, 179, 221 Distribution $40, 000 $42, 193 $43, 610 $45, 103 $49, 060 $55, 046 $58, 906 $61, 747 $65, 927 $71, 881 $81, 455 $91, 561 $99, 748 $103, 603 $107, 543 $111, 867 $116, 088 $117, 413 $122, 596 $128, 010 CPI (%) 5. 48% 3. 36% 3. 42% 8. 78% 12. 20% 7. 01% 4. 82% 6. 77% 9. 03% 13. 32% 12. 41% 8. 94% 3. 87% 3. 80% 4. 02% 3. 77% 1. 14% 4. 41% 4. 42% 4. 64%
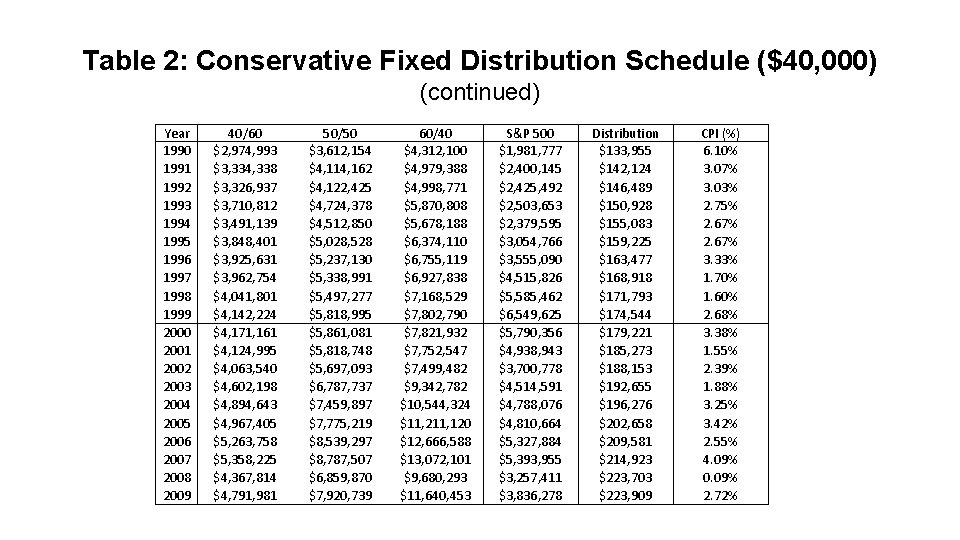
Table 2: Conservative Fixed Distribution Schedule ($40, 000) (continued) Year 1990 1991 1992 1993 1994 1995 1996 1997 1998 1999 2000 2001 2002 2003 2004 2005 2006 2007 2008 2009 40/60 $2, 974, 993 $3, 334, 338 $3, 326, 937 $3, 710, 812 $3, 491, 139 $3, 848, 401 $3, 925, 631 $3, 962, 754 $4, 041, 801 $4, 142, 224 $4, 171, 161 $4, 124, 995 $4, 063, 540 $4, 602, 198 $4, 894, 643 $4, 967, 405 $5, 263, 758 $5, 358, 225 $4, 367, 814 $4, 791, 981 50/50 $3, 612, 154 $4, 114, 162 $4, 122, 425 $4, 724, 378 $4, 512, 850 $5, 028, 528 $5, 237, 130 $5, 338, 991 $5, 497, 277 $5, 818, 995 $5, 861, 081 $5, 818, 748 $5, 697, 093 $6, 787, 737 $7, 459, 897 $7, 775, 219 $8, 539, 297 $8, 787, 507 $6, 859, 870 $7, 920, 739 60/40 $4, 312, 100 $4, 979, 388 $4, 998, 771 $5, 870, 808 $5, 678, 188 $6, 374, 110 $6, 755, 119 $6, 927, 838 $7, 168, 529 $7, 802, 790 $7, 821, 932 $7, 752, 547 $7, 499, 482 $9, 342, 782 $10, 544, 324 $11, 211, 120 $12, 666, 588 $13, 072, 101 $9, 680, 293 $11, 640, 453 S&P 500 $1, 981, 777 $2, 400, 145 $2, 425, 492 $2, 503, 653 $2, 379, 595 $3, 054, 766 $3, 555, 090 $4, 515, 826 $5, 585, 462 $6, 549, 625 $5, 790, 356 $4, 938, 943 $3, 700, 778 $4, 514, 591 $4, 788, 076 $4, 810, 664 $5, 327, 884 $5, 393, 955 $3, 257, 411 $3, 836, 278 Distribution $133, 955 $142, 124 $146, 489 $150, 928 $155, 083 $159, 225 $163, 477 $168, 918 $171, 793 $174, 544 $179, 221 $185, 273 $188, 153 $192, 655 $196, 276 $202, 658 $209, 581 $214, 923 $223, 703 $223, 909 CPI (%) 6. 10% 3. 07% 3. 03% 2. 75% 2. 67% 3. 33% 1. 70% 1. 60% 2. 68% 3. 38% 1. 55% 2. 39% 1. 88% 3. 25% 3. 42% 2. 55% 4. 09% 0. 09% 2. 72%
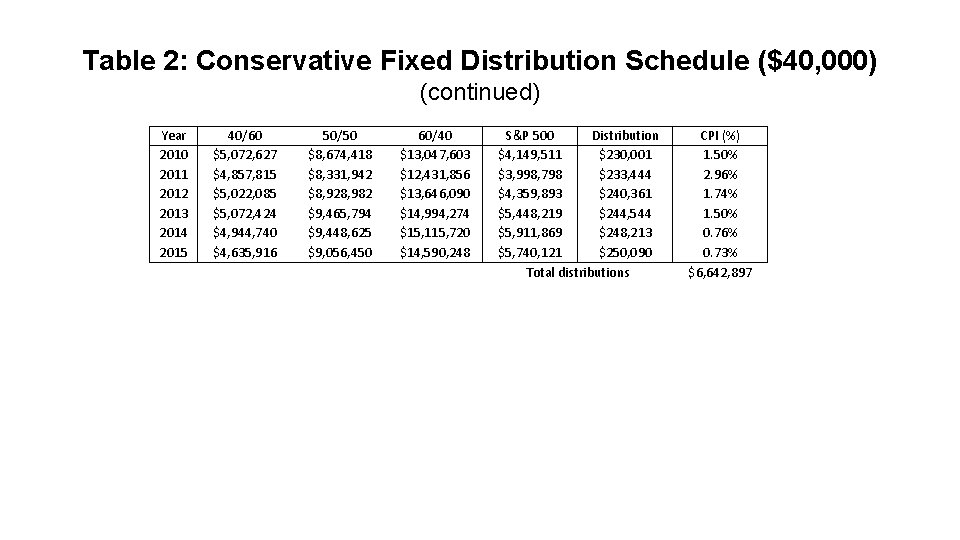
Table 2: Conservative Fixed Distribution Schedule ($40, 000) (continued) Year 2010 2011 2012 2013 2014 2015 40/60 $5, 072, 627 $4, 857, 815 $5, 022, 085 $5, 072, 424 $4, 944, 740 $4, 635, 916 50/50 $8, 674, 418 $8, 331, 942 $8, 928, 982 $9, 465, 794 $9, 448, 625 $9, 056, 450 60/40 $13, 047, 603 $12, 431, 856 $13, 646, 090 $14, 994, 274 $15, 115, 720 $14, 590, 248 S&P 500 Distribution $4, 149, 511 $230, 001 $3, 998, 798 $233, 444 $4, 359, 893 $240, 361 $5, 448, 219 $244, 544 $5, 911, 869 $248, 213 $5, 740, 121 $250, 090 Total distributions CPI (%) 1. 50% 2. 96% 1. 74% 1. 50% 0. 76% 0. 73% $6, 642, 897
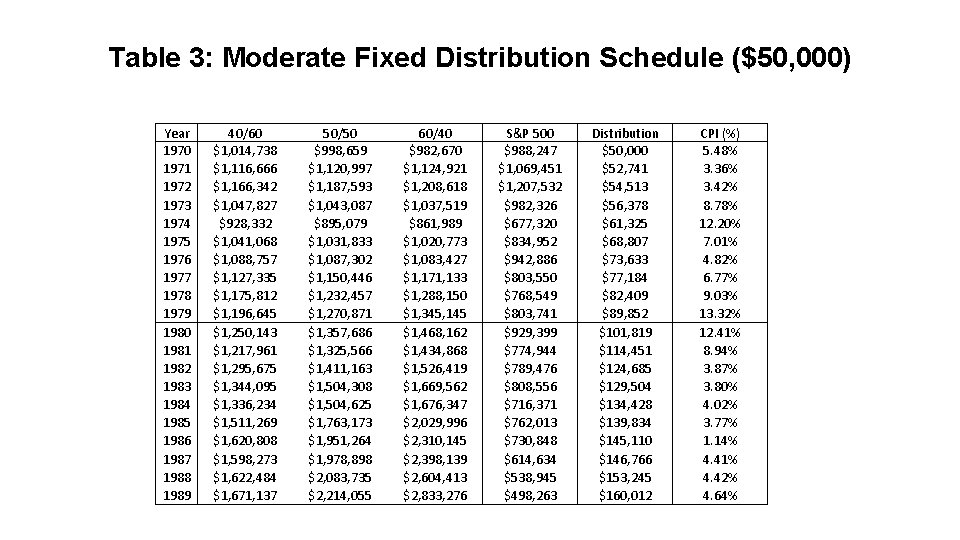
Table 3: Moderate Fixed Distribution Schedule ($50, 000) Year 1970 1971 1972 1973 1974 1975 1976 1977 1978 1979 1980 1981 1982 1983 1984 1985 1986 1987 1988 1989 40/60 $1, 014, 738 $1, 116, 666 $1, 166, 342 $1, 047, 827 $928, 332 $1, 041, 068 $1, 088, 757 $1, 127, 335 $1, 175, 812 $1, 196, 645 $1, 250, 143 $1, 217, 961 $1, 295, 675 $1, 344, 095 $1, 336, 234 $1, 511, 269 $1, 620, 808 $1, 598, 273 $1, 622, 484 $1, 671, 137 50/50 $998, 659 $1, 120, 997 $1, 187, 593 $1, 043, 087 $895, 079 $1, 031, 833 $1, 087, 302 $1, 150, 446 $1, 232, 457 $1, 270, 871 $1, 357, 686 $1, 325, 566 $1, 411, 163 $1, 504, 308 $1, 504, 625 $1, 763, 173 $1, 951, 264 $1, 978, 898 $2, 083, 735 $2, 214, 055 60/40 $982, 670 $1, 124, 921 $1, 208, 618 $1, 037, 519 $861, 989 $1, 020, 773 $1, 083, 427 $1, 171, 133 $1, 288, 150 $1, 345, 145 $1, 468, 162 $1, 434, 868 $1, 526, 419 $1, 669, 562 $1, 676, 347 $2, 029, 996 $2, 310, 145 $2, 398, 139 $2, 604, 413 $2, 833, 276 S&P 500 $988, 247 $1, 069, 451 $1, 207, 532 $982, 326 $677, 320 $834, 952 $942, 886 $803, 550 $768, 549 $803, 741 $929, 399 $774, 944 $789, 476 $808, 556 $716, 371 $762, 013 $730, 848 $614, 634 $538, 945 $498, 263 Distribution $50, 000 $52, 741 $54, 513 $56, 378 $61, 325 $68, 807 $73, 633 $77, 184 $82, 409 $89, 852 $101, 819 $114, 451 $124, 685 $129, 504 $134, 428 $139, 834 $145, 110 $146, 766 $153, 245 $160, 012 CPI (%) 5. 48% 3. 36% 3. 42% 8. 78% 12. 20% 7. 01% 4. 82% 6. 77% 9. 03% 13. 32% 12. 41% 8. 94% 3. 87% 3. 80% 4. 02% 3. 77% 1. 14% 4. 41% 4. 42% 4. 64%
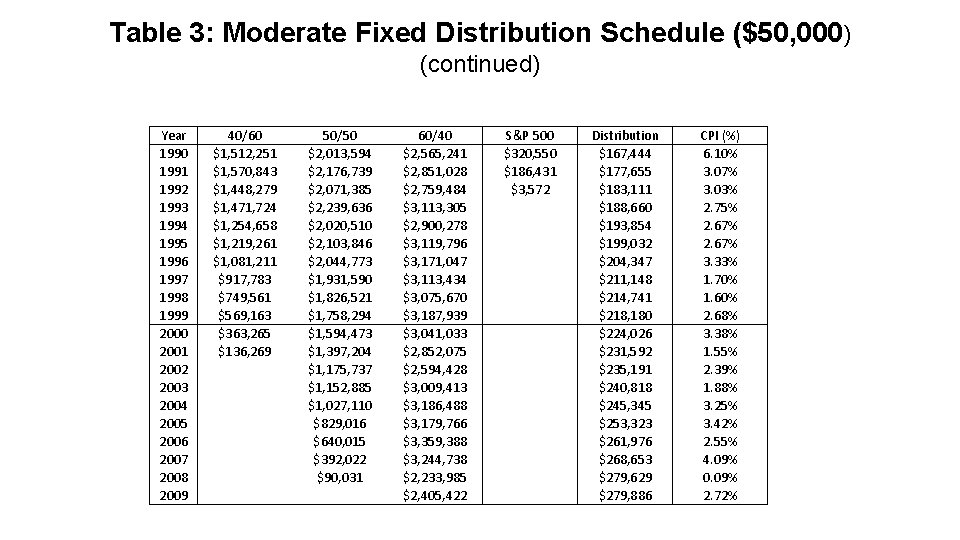
Table 3: Moderate Fixed Distribution Schedule ($50, 000) (continued) Year 1990 1991 1992 1993 1994 1995 1996 1997 1998 1999 2000 2001 2002 2003 2004 2005 2006 2007 2008 2009 40/60 $1, 512, 251 $1, 570, 843 $1, 448, 279 $1, 471, 724 $1, 254, 658 $1, 219, 261 $1, 081, 211 $917, 783 $749, 561 $569, 163 $363, 265 $136, 269 50/50 $2, 013, 594 $2, 176, 739 $2, 071, 385 $2, 239, 636 $2, 020, 510 $2, 103, 846 $2, 044, 773 $1, 931, 590 $1, 826, 521 $1, 758, 294 $1, 594, 473 $1, 397, 204 $1, 175, 737 $1, 152, 885 $1, 027, 110 $829, 016 $640, 015 $392, 022 $90, 031 60/40 $2, 565, 241 $2, 851, 028 $2, 759, 484 $3, 113, 305 $2, 900, 278 $3, 119, 796 $3, 171, 047 $3, 113, 434 $3, 075, 670 $3, 187, 939 $3, 041, 033 $2, 852, 075 $2, 594, 428 $3, 009, 413 $3, 186, 488 $3, 179, 766 $3, 359, 388 $3, 244, 738 $2, 233, 985 $2, 405, 422 S&P 500 $320, 550 $186, 431 $3, 572 Distribution $167, 444 $177, 655 $183, 111 $188, 660 $193, 854 $199, 032 $204, 347 $211, 148 $214, 741 $218, 180 $224, 026 $231, 592 $235, 191 $240, 818 $245, 345 $253, 323 $261, 976 $268, 653 $279, 629 $279, 886 CPI (%) 6. 10% 3. 07% 3. 03% 2. 75% 2. 67% 3. 33% 1. 70% 1. 60% 2. 68% 3. 38% 1. 55% 2. 39% 1. 88% 3. 25% 3. 42% 2. 55% 4. 09% 0. 09% 2. 72%
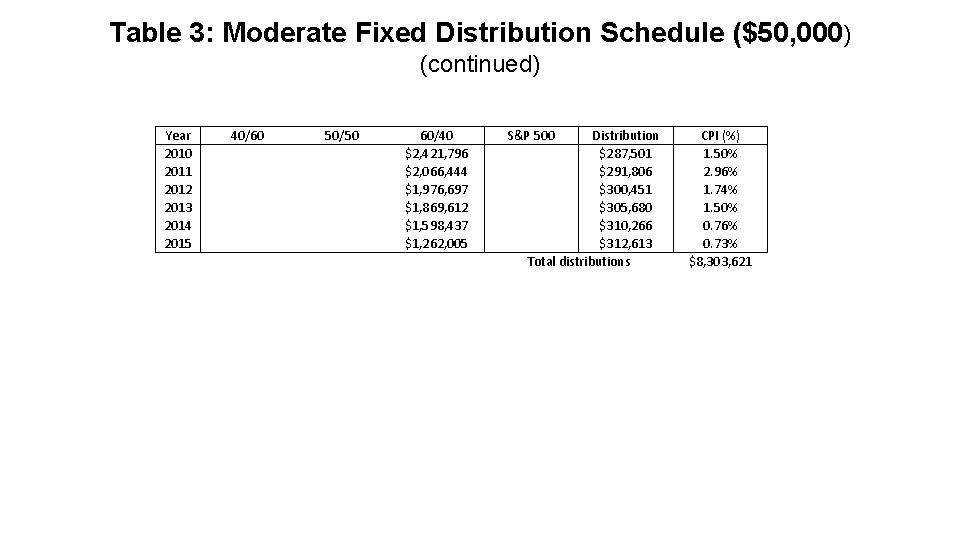
Table 3: Moderate Fixed Distribution Schedule ($50, 000) (continued) Year 2010 2011 2012 2013 2014 2015 40/60 50/50 60/40 $2, 421, 796 $2, 066, 444 $1, 976, 697 $1, 869, 612 $1, 598, 437 $1, 262, 005 S&P 500 Distribution $287, 501 $291, 806 $300, 451 $305, 680 $310, 266 $312, 613 Total distributions CPI (%) 1. 50% 2. 96% 1. 74% 1. 50% 0. 76% 0. 73% $8, 303, 621
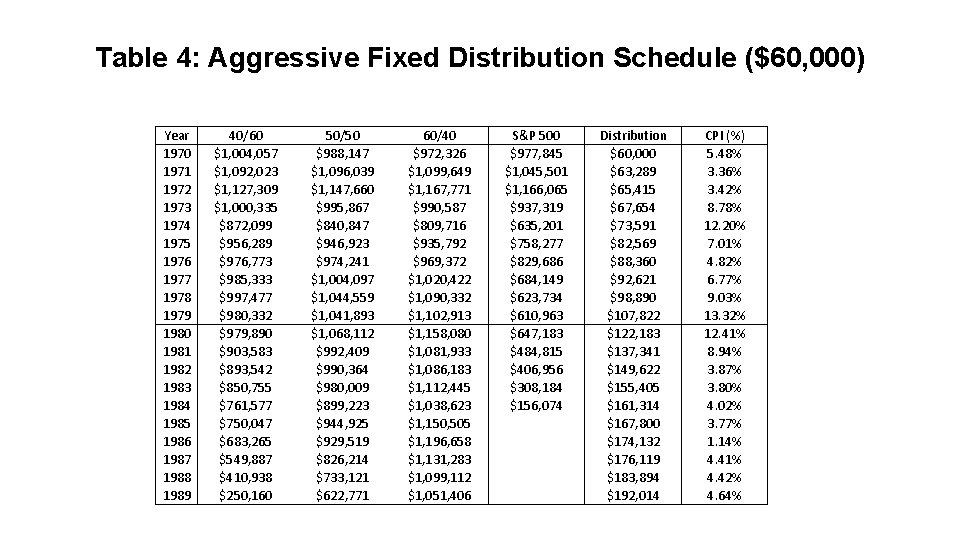
Table 4: Aggressive Fixed Distribution Schedule ($60, 000) Year 1970 1971 1972 1973 1974 1975 1976 1977 1978 1979 1980 1981 1982 1983 1984 1985 1986 1987 1988 1989 40/60 $1, 004, 057 $1, 092, 023 $1, 127, 309 $1, 000, 335 $872, 099 $956, 289 $976, 773 $985, 333 $997, 477 $980, 332 $979, 890 $903, 583 $893, 542 $850, 755 $761, 577 $750, 047 $683, 265 $549, 887 $410, 938 $250, 160 50/50 $988, 147 $1, 096, 039 $1, 147, 660 $995, 867 $840, 847 $946, 923 $974, 241 $1, 004, 097 $1, 044, 559 $1, 041, 893 $1, 068, 112 $992, 409 $990, 364 $980, 009 $899, 223 $944, 925 $929, 519 $826, 214 $733, 121 $622, 771 60/40 $972, 326 $1, 099, 649 $1, 167, 771 $990, 587 $809, 716 $935, 792 $969, 372 $1, 020, 422 $1, 090, 332 $1, 102, 913 $1, 158, 080 $1, 081, 933 $1, 086, 183 $1, 112, 445 $1, 038, 623 $1, 150, 505 $1, 196, 658 $1, 131, 283 $1, 099, 112 $1, 051, 406 S&P 500 $977, 845 $1, 045, 501 $1, 166, 065 $937, 319 $635, 201 $758, 277 $829, 686 $684, 149 $623, 734 $610, 963 $647, 183 $484, 815 $406, 956 $308, 184 $156, 074 Distribution $60, 000 $63, 289 $65, 415 $67, 654 $73, 591 $82, 569 $88, 360 $92, 621 $98, 890 $107, 822 $122, 183 $137, 341 $149, 622 $155, 405 $161, 314 $167, 800 $174, 132 $176, 119 $183, 894 $192, 014 CPI (%) 5. 48% 3. 36% 3. 42% 8. 78% 12. 20% 7. 01% 4. 82% 6. 77% 9. 03% 13. 32% 12. 41% 8. 94% 3. 87% 3. 80% 4. 02% 3. 77% 1. 14% 4. 41% 4. 42% 4. 64%
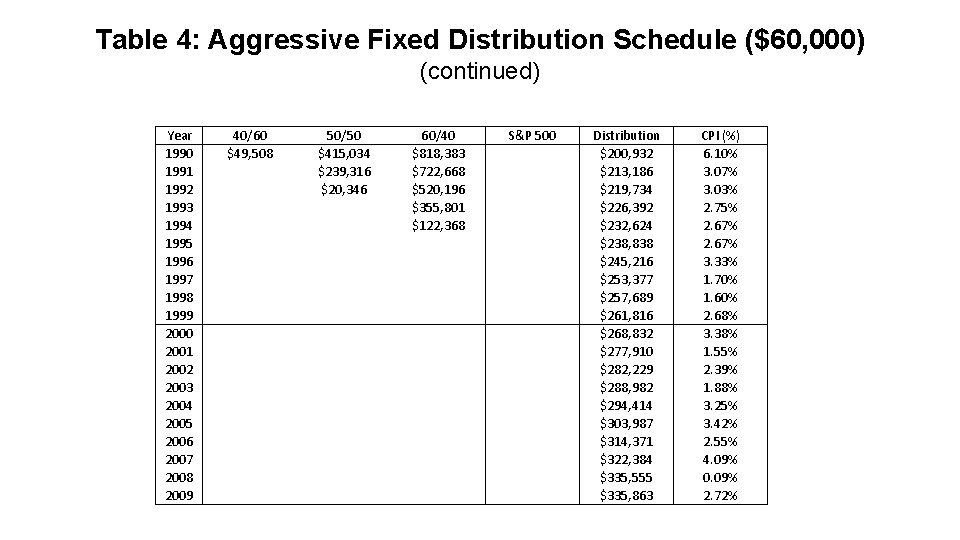
Table 4: Aggressive Fixed Distribution Schedule ($60, 000) (continued) Year 1990 1991 1992 1993 1994 1995 1996 1997 1998 1999 2000 2001 2002 2003 2004 2005 2006 2007 2008 2009 40/60 $49, 508 50/50 $415, 034 $239, 316 $20, 346 60/40 $818, 383 $722, 668 $520, 196 $355, 801 $122, 368 S&P 500 Distribution $200, 932 $213, 186 $219, 734 $226, 392 $232, 624 $238, 838 $245, 216 $253, 377 $257, 689 $261, 816 $268, 832 $277, 910 $282, 229 $288, 982 $294, 414 $303, 987 $314, 371 $322, 384 $335, 555 $335, 863 CPI (%) 6. 10% 3. 07% 3. 03% 2. 75% 2. 67% 3. 33% 1. 70% 1. 60% 2. 68% 3. 38% 1. 55% 2. 39% 1. 88% 3. 25% 3. 42% 2. 55% 4. 09% 0. 09% 2. 72%
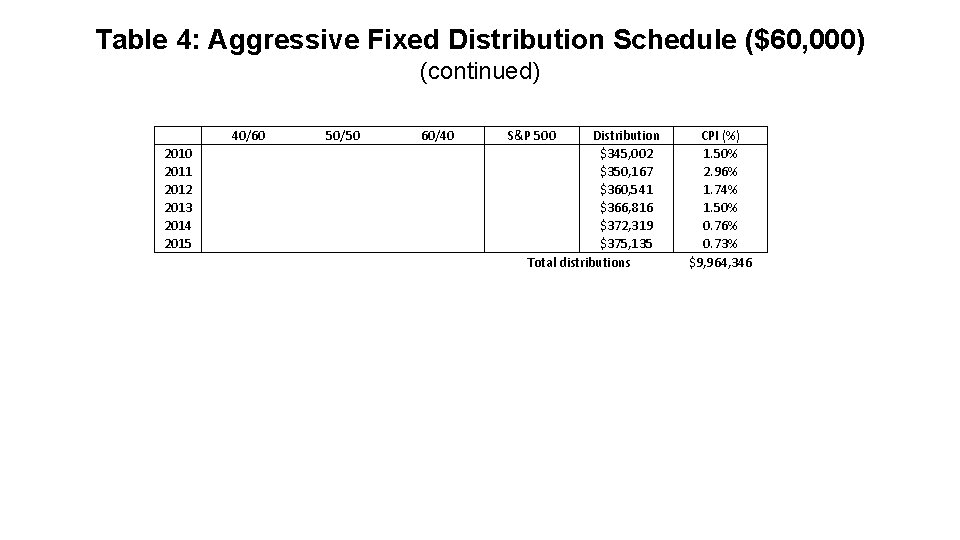
Table 4: Aggressive Fixed Distribution Schedule ($60, 000) (continued) 2010 2011 2012 2013 2014 2015 40/60 50/50 60/40 S&P 500 Distribution $345, 002 $350, 167 $360, 541 $366, 816 $372, 319 $375, 135 Total distributions CPI (%) 1. 50% 2. 96% 1. 74% 1. 50% 0. 76% 0. 73% $9, 964, 346
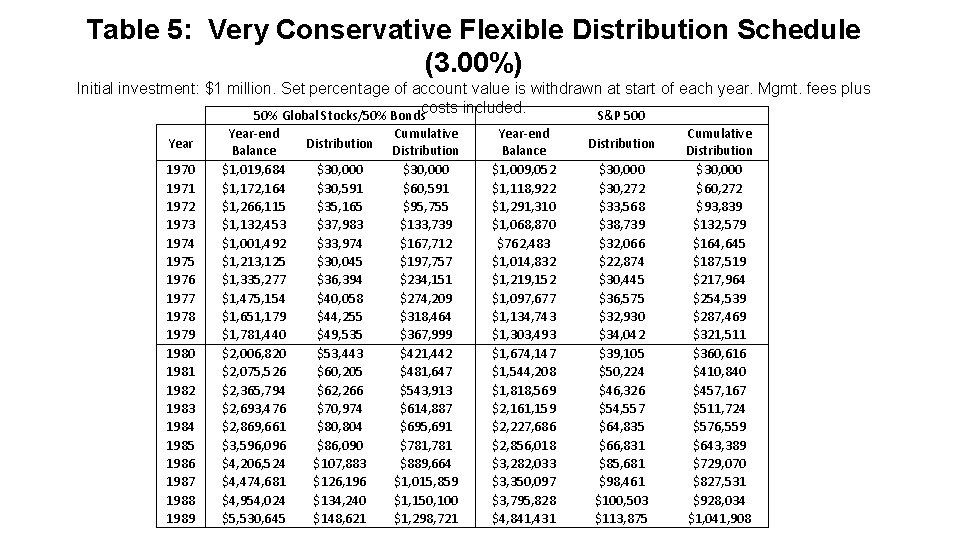
Table 5: Very Conservative Flexible Distribution Schedule (3. 00%) Initial investment: $1 million. Set percentage of account value is withdrawn at start of each year. Mgmt. fees plus 50% Global Stocks/50% Bondscosts included. S&P 500 Year 1970 1971 1972 1973 1974 1975 1976 1977 1978 1979 1980 1981 1982 1983 1984 1985 1986 1987 1988 1989 Year‐end Balance $1, 019, 684 $1, 172, 164 $1, 266, 115 $1, 132, 453 $1, 001, 492 $1, 213, 125 $1, 335, 277 $1, 475, 154 $1, 651, 179 $1, 781, 440 $2, 006, 820 $2, 075, 526 $2, 365, 794 $2, 693, 476 $2, 869, 661 $3, 596, 096 $4, 206, 524 $4, 474, 681 $4, 954, 024 $5, 530, 645 Distribution $30, 000 $30, 591 $35, 165 $37, 983 $33, 974 $30, 045 $36, 394 $40, 058 $44, 255 $49, 535 $53, 443 $60, 205 $62, 266 $70, 974 $80, 804 $86, 090 $107, 883 $126, 196 $134, 240 $148, 621 Cumulative Distribution $30, 000 $60, 591 $95, 755 $133, 739 $167, 712 $197, 757 $234, 151 $274, 209 $318, 464 $367, 999 $421, 442 $481, 647 $543, 913 $614, 887 $695, 691 $781, 781 $889, 664 $1, 015, 859 $1, 150, 100 $1, 298, 721 Year‐end Balance $1, 009, 052 $1, 118, 922 $1, 291, 310 $1, 068, 870 $762, 483 $1, 014, 832 $1, 219, 152 $1, 097, 677 $1, 134, 743 $1, 303, 493 $1, 674, 147 $1, 544, 208 $1, 818, 569 $2, 161, 159 $2, 227, 686 $2, 856, 018 $3, 282, 033 $3, 350, 097 $3, 795, 828 $4, 841, 431 Distribution $30, 000 $30, 272 $33, 568 $38, 739 $32, 066 $22, 874 $30, 445 $36, 575 $32, 930 $34, 042 $39, 105 $50, 224 $46, 326 $54, 557 $64, 835 $66, 831 $85, 681 $98, 461 $100, 503 $113, 875 Cumulative Distribution $30, 000 $60, 272 $93, 839 $132, 579 $164, 645 $187, 519 $217, 964 $254, 539 $287, 469 $321, 511 $360, 616 $410, 840 $457, 167 $511, 724 $576, 559 $643, 389 $729, 070 $827, 531 $928, 034 $1, 041, 908
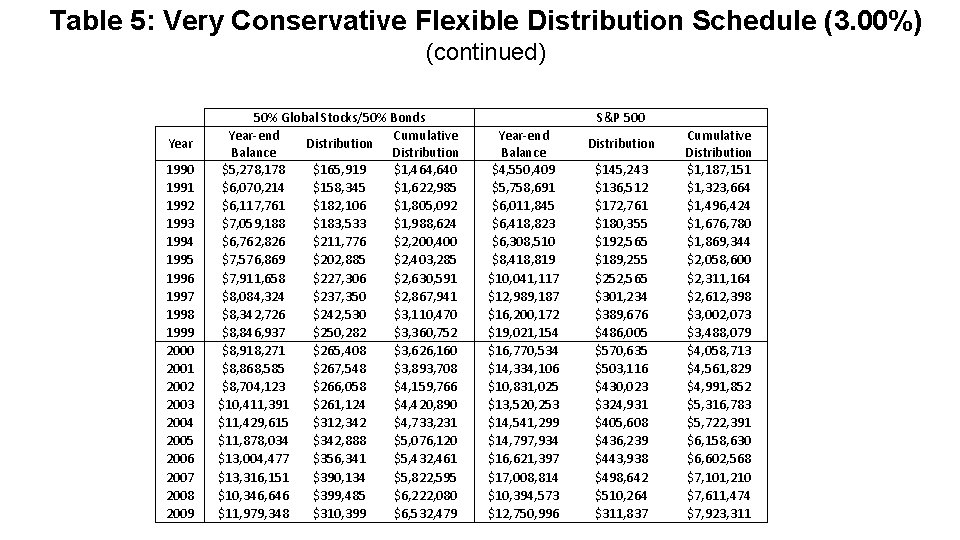
Table 5: Very Conservative Flexible Distribution Schedule (3. 00%) (continued) Year 1990 1991 1992 1993 1994 1995 1996 1997 1998 1999 2000 2001 2002 2003 2004 2005 2006 2007 2008 2009 50% Global Stocks/50% Bonds Year‐end Cumulative Distribution Balance Distribution $5, 278, 178 $165, 919 $1, 464, 640 $6, 070, 214 $158, 345 $1, 622, 985 $6, 117, 761 $182, 106 $1, 805, 092 $7, 059, 188 $183, 533 $1, 988, 624 $6, 762, 826 $211, 776 $2, 200, 400 $7, 576, 869 $202, 885 $2, 403, 285 $7, 911, 658 $227, 306 $2, 630, 591 $8, 084, 324 $237, 350 $2, 867, 941 $8, 342, 726 $242, 530 $3, 110, 470 $8, 846, 937 $250, 282 $3, 360, 752 $8, 918, 271 $265, 408 $3, 626, 160 $8, 868, 585 $267, 548 $3, 893, 708 $8, 704, 123 $266, 058 $4, 159, 766 $10, 411, 391 $261, 124 $4, 420, 890 $11, 429, 615 $312, 342 $4, 733, 231 $11, 878, 034 $342, 888 $5, 076, 120 $13, 004, 477 $356, 341 $5, 432, 461 $13, 316, 151 $390, 134 $5, 822, 595 $10, 346, 646 $399, 485 $6, 222, 080 $11, 979, 348 $310, 399 $6, 532, 479 S&P 500 Year‐end Balance $4, 550, 409 $5, 758, 691 $6, 011, 845 $6, 418, 823 $6, 308, 510 $8, 418, 819 $10, 041, 117 $12, 989, 187 $16, 200, 172 $19, 021, 154 $16, 770, 534 $14, 334, 106 $10, 831, 025 $13, 520, 253 $14, 541, 299 $14, 797, 934 $16, 621, 397 $17, 008, 814 $10, 394, 573 $12, 750, 996 Distribution $145, 243 $136, 512 $172, 761 $180, 355 $192, 565 $189, 255 $252, 565 $301, 234 $389, 676 $486, 005 $570, 635 $503, 116 $430, 023 $324, 931 $405, 608 $436, 239 $443, 938 $498, 642 $510, 264 $311, 837 Cumulative Distribution $1, 187, 151 $1, 323, 664 $1, 496, 424 $1, 676, 780 $1, 869, 344 $2, 058, 600 $2, 311, 164 $2, 612, 398 $3, 002, 073 $3, 488, 079 $4, 058, 713 $4, 561, 829 $4, 991, 852 $5, 316, 783 $5, 722, 391 $6, 158, 630 $6, 602, 568 $7, 101, 210 $7, 611, 474 $7, 923, 311
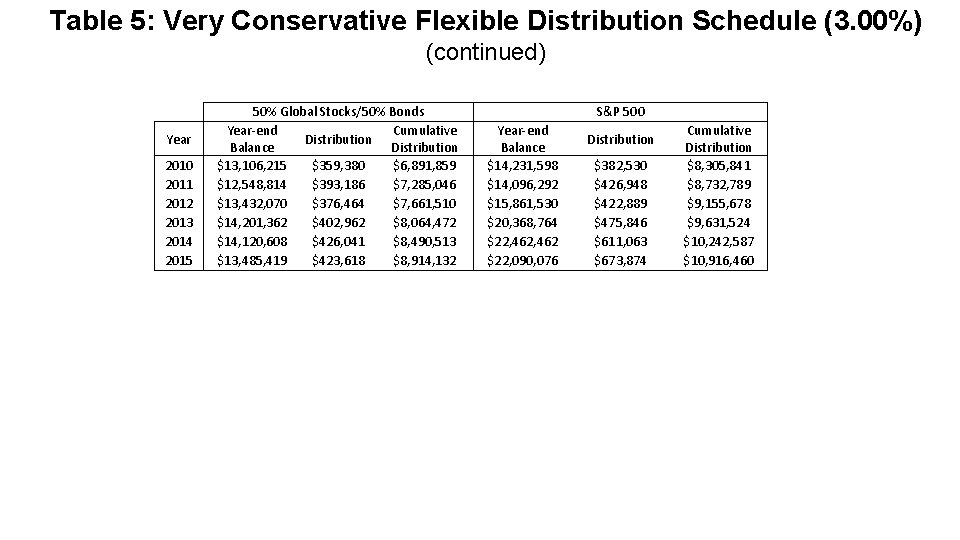
Table 5: Very Conservative Flexible Distribution Schedule (3. 00%) (continued) Year 2010 2011 2012 2013 2014 2015 50% Global Stocks/50% Bonds Year‐end Cumulative Distribution Balance Distribution $13, 106, 215 $359, 380 $6, 891, 859 $12, 548, 814 $393, 186 $7, 285, 046 $13, 432, 070 $376, 464 $7, 661, 510 $14, 201, 362 $402, 962 $8, 064, 472 $14, 120, 608 $426, 041 $8, 490, 513 $13, 485, 419 $423, 618 $8, 914, 132 S&P 500 Year‐end Balance $14, 231, 598 $14, 096, 292 $15, 861, 530 $20, 368, 764 $22, 462 $22, 090, 076 Distribution $382, 530 $426, 948 $422, 889 $475, 846 $611, 063 $673, 874 Cumulative Distribution $8, 305, 841 $8, 732, 789 $9, 155, 678 $9, 631, 524 $10, 242, 587 $10, 916, 460
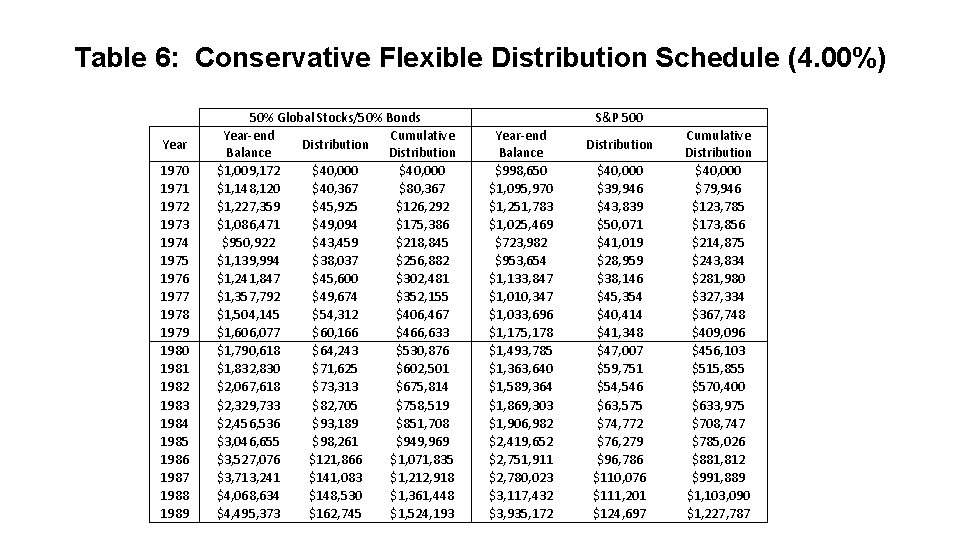
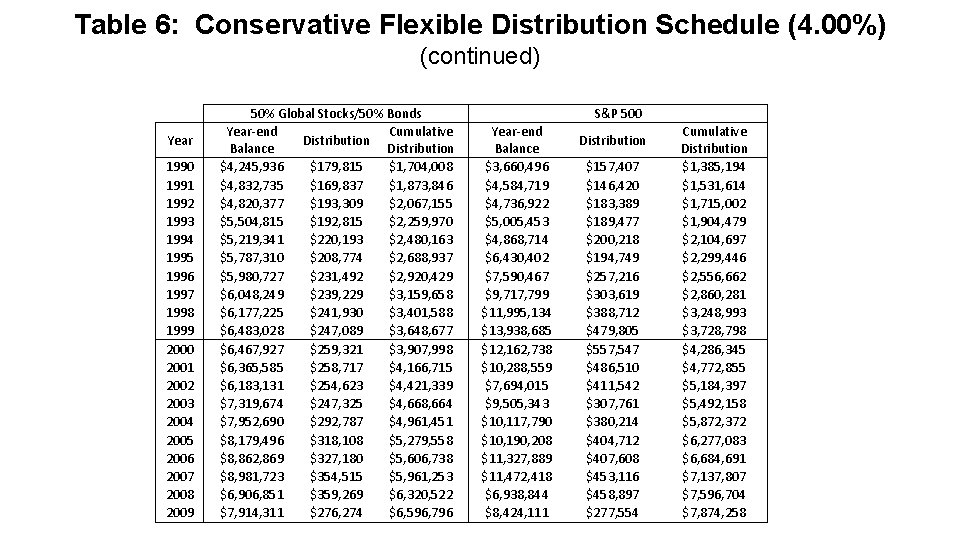
Table 6: Conservative Flexible Distribution Schedule (4. 00%) Year 1970 1971 1972 1973 1974 1975 1976 1977 1978 1979 1980 1981 1982 1983 1984 1985 1986 1987 1988 1989 50% Global Stocks/50% Bonds Year‐end Cumulative Distribution Balance Distribution $1, 009, 172 $40, 000 $1, 148, 120 $40, 367 $80, 367 $1, 227, 359 $45, 925 $126, 292 $1, 086, 471 $49, 094 $175, 386 $950, 922 $43, 459 $218, 845 $1, 139, 994 $38, 037 $256, 882 $1, 241, 847 $45, 600 $302, 481 $1, 357, 792 $49, 674 $352, 155 $1, 504, 145 $54, 312 $406, 467 $1, 606, 077 $60, 166 $466, 633 $1, 790, 618 $64, 243 $530, 876 $1, 832, 830 $71, 625 $602, 501 $2, 067, 618 $73, 313 $675, 814 $2, 329, 733 $82, 705 $758, 519 $2, 456, 536 $93, 189 $851, 708 $3, 046, 655 $98, 261 $949, 969 $3, 527, 076 $121, 866 $1, 071, 835 $3, 713, 241 $141, 083 $1, 212, 918 $4, 068, 634 $148, 530 $1, 361, 448 $4, 495, 373 $162, 745 $1, 524, 193 S&P 500 Year‐end Balance $998, 650 $1, 095, 970 $1, 251, 783 $1, 025, 469 $723, 982 $953, 654 $1, 133, 847 $1, 010, 347 $1, 033, 696 $1, 175, 178 $1, 493, 785 $1, 363, 640 $1, 589, 364 $1, 869, 303 $1, 906, 982 $2, 419, 652 $2, 751, 911 $2, 780, 023 $3, 117, 432 $3, 935, 172 Distribution $40, 000 $39, 946 $43, 839 $50, 071 $41, 019 $28, 959 $38, 146 $45, 354 $40, 414 $41, 348 $47, 007 $59, 751 $54, 546 $63, 575 $74, 772 $76, 279 $96, 786 $110, 076 $111, 201 $124, 697 Cumulative Distribution $40, 000 $79, 946 $123, 785 $173, 856 $214, 875 $243, 834 $281, 980 $327, 334 $367, 748 $409, 096 $456, 103 $515, 855 $570, 400 $633, 975 $708, 747 $785, 026 $881, 812 $991, 889 $1, 103, 090 $1, 227, 787
Table 6: Conservative Flexible Distribution Schedule (4. 00%) (continued) Year 1990 1991 1992 1993 1994 1995 1996 1997 1998 1999 2000 2001 2002 2003 2004 2005 2006 2007 2008 2009 50% Global Stocks/50% Bonds Year‐end Cumulative Distribution Balance Distribution $4, 245, 936 $179, 815 $1, 704, 008 $4, 832, 735 $169, 837 $1, 873, 846 $4, 820, 377 $193, 309 $2, 067, 155 $5, 504, 815 $192, 815 $2, 259, 970 $5, 219, 341 $220, 193 $2, 480, 163 $5, 787, 310 $208, 774 $2, 688, 937 $5, 980, 727 $231, 492 $2, 920, 429 $6, 048, 249 $239, 229 $3, 159, 658 $6, 177, 225 $241, 930 $3, 401, 588 $6, 483, 028 $247, 089 $3, 648, 677 $6, 467, 927 $259, 321 $3, 907, 998 $6, 365, 585 $258, 717 $4, 166, 715 $6, 183, 131 $254, 623 $4, 421, 339 $7, 319, 674 $247, 325 $4, 668, 664 $7, 952, 690 $292, 787 $4, 961, 451 $8, 179, 496 $318, 108 $5, 279, 558 $8, 862, 869 $327, 180 $5, 606, 738 $8, 981, 723 $354, 515 $5, 961, 253 $6, 906, 851 $359, 269 $6, 320, 522 $7, 914, 311 $276, 274 $6, 596, 796 S&P 500 Year‐end Balance $3, 660, 496 $4, 584, 719 $4, 736, 922 $5, 005, 453 $4, 868, 714 $6, 430, 402 $7, 590, 467 $9, 717, 799 $11, 995, 134 $13, 938, 685 $12, 162, 738 $10, 288, 559 $7, 694, 015 $9, 505, 343 $10, 117, 790 $10, 190, 208 $11, 327, 889 $11, 472, 418 $6, 938, 844 $8, 424, 111 Distribution $157, 407 $146, 420 $183, 389 $189, 477 $200, 218 $194, 749 $257, 216 $303, 619 $388, 712 $479, 805 $557, 547 $486, 510 $411, 542 $307, 761 $380, 214 $404, 712 $407, 608 $453, 116 $458, 897 $277, 554 Cumulative Distribution $1, 385, 194 $1, 531, 614 $1, 715, 002 $1, 904, 479 $2, 104, 697 $2, 299, 446 $2, 556, 662 $2, 860, 281 $3, 248, 993 $3, 728, 798 $4, 286, 345 $4, 772, 855 $5, 184, 397 $5, 492, 158 $5, 872, 372 $6, 277, 083 $6, 684, 691 $7, 137, 807 $7, 596, 704 $7, 874, 258
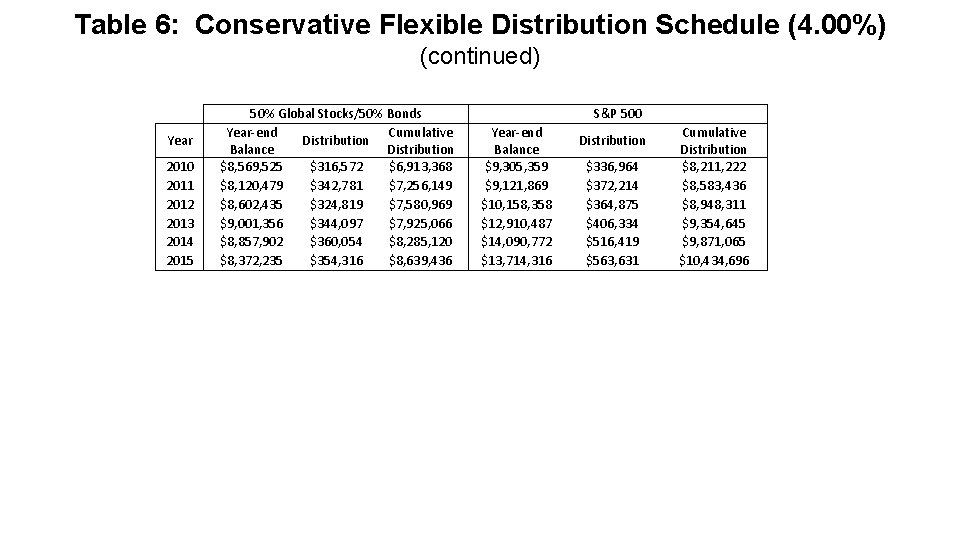
Table 6: Conservative Flexible Distribution Schedule (4. 00%) (continued) Year 2010 2011 2012 2013 2014 2015 50% Global Stocks/50% Bonds Year‐end Cumulative Distribution Balance Distribution $8, 569, 525 $316, 572 $6, 913, 368 $8, 120, 479 $342, 781 $7, 256, 149 $8, 602, 435 $324, 819 $7, 580, 969 $9, 001, 356 $344, 097 $7, 925, 066 $8, 857, 902 $360, 054 $8, 285, 120 $8, 372, 235 $354, 316 $8, 639, 436 S&P 500 Year‐end Balance $9, 305, 359 $9, 121, 869 $10, 158, 358 $12, 910, 487 $14, 090, 772 $13, 714, 316 Distribution $336, 964 $372, 214 $364, 875 $406, 334 $516, 419 $563, 631 Cumulative Distribution $8, 211, 222 $8, 583, 436 $8, 948, 311 $9, 354, 645 $9, 871, 065 $10, 434, 696
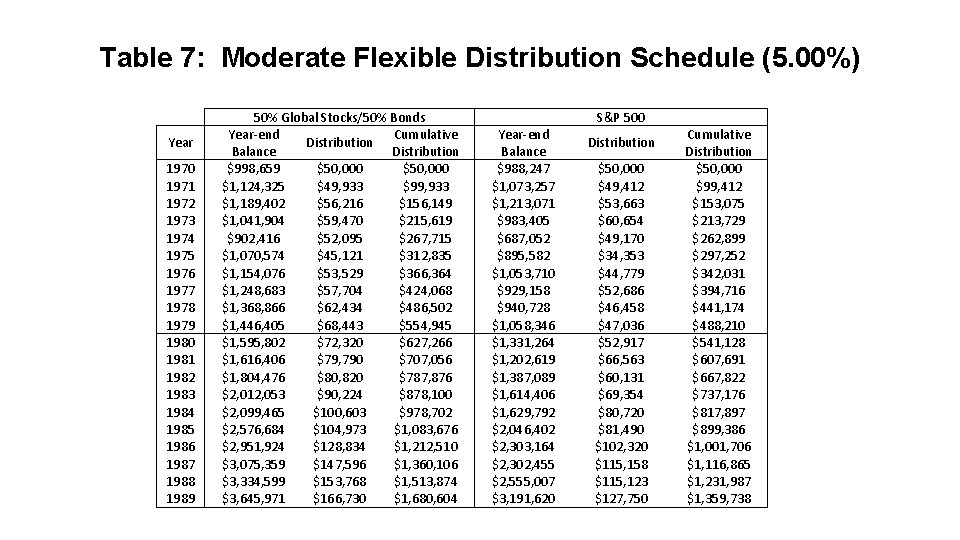
Table 7: Moderate Flexible Distribution Schedule (5. 00%) Year 1970 1971 1972 1973 1974 1975 1976 1977 1978 1979 1980 1981 1982 1983 1984 1985 1986 1987 1988 1989 50% Global Stocks/50% Bonds Year‐end Cumulative Distribution Balance Distribution $998, 659 $50, 000 $1, 124, 325 $49, 933 $99, 933 $1, 189, 402 $56, 216 $156, 149 $1, 041, 904 $59, 470 $215, 619 $902, 416 $52, 095 $267, 715 $1, 070, 574 $45, 121 $312, 835 $1, 154, 076 $53, 529 $366, 364 $1, 248, 683 $57, 704 $424, 068 $1, 368, 866 $62, 434 $486, 502 $1, 446, 405 $68, 443 $554, 945 $1, 595, 802 $72, 320 $627, 266 $1, 616, 406 $79, 790 $707, 056 $1, 804, 476 $80, 820 $787, 876 $2, 012, 053 $90, 224 $878, 100 $2, 099, 465 $100, 603 $978, 702 $2, 576, 684 $104, 973 $1, 083, 676 $2, 951, 924 $128, 834 $1, 212, 510 $3, 075, 359 $147, 596 $1, 360, 106 $3, 334, 599 $153, 768 $1, 513, 874 $3, 645, 971 $166, 730 $1, 680, 604 S&P 500 Year‐end Balance $988, 247 $1, 073, 257 $1, 213, 071 $983, 405 $687, 052 $895, 582 $1, 053, 710 $929, 158 $940, 728 $1, 058, 346 $1, 331, 264 $1, 202, 619 $1, 387, 089 $1, 614, 406 $1, 629, 792 $2, 046, 402 $2, 303, 164 $2, 302, 455 $2, 555, 007 $3, 191, 620 Distribution $50, 000 $49, 412 $53, 663 $60, 654 $49, 170 $34, 353 $44, 779 $52, 686 $46, 458 $47, 036 $52, 917 $66, 563 $60, 131 $69, 354 $80, 720 $81, 490 $102, 320 $115, 158 $115, 123 $127, 750 Cumulative Distribution $50, 000 $99, 412 $153, 075 $213, 729 $262, 899 $297, 252 $342, 031 $394, 716 $441, 174 $488, 210 $541, 128 $607, 691 $667, 822 $737, 176 $817, 897 $899, 386 $1, 001, 706 $1, 116, 865 $1, 231, 987 $1, 359, 738
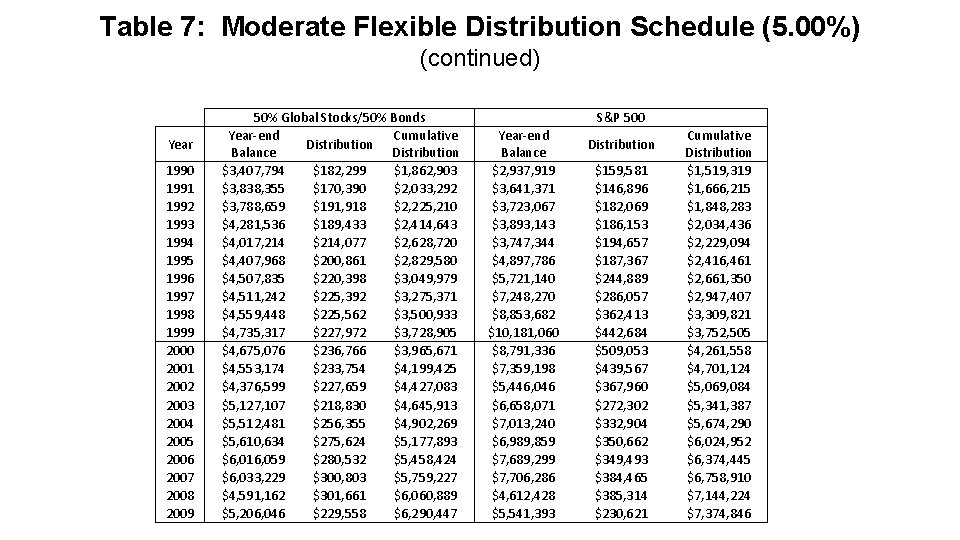
Table 7: Moderate Flexible Distribution Schedule (5. 00%) (continued) Year 1990 1991 1992 1993 1994 1995 1996 1997 1998 1999 2000 2001 2002 2003 2004 2005 2006 2007 2008 2009 50% Global Stocks/50% Bonds Year‐end Cumulative Distribution Balance Distribution $3, 407, 794 $182, 299 $1, 862, 903 $3, 838, 355 $170, 390 $2, 033, 292 $3, 788, 659 $191, 918 $2, 225, 210 $4, 281, 536 $189, 433 $2, 414, 643 $4, 017, 214 $214, 077 $2, 628, 720 $4, 407, 968 $200, 861 $2, 829, 580 $4, 507, 835 $220, 398 $3, 049, 979 $4, 511, 242 $225, 392 $3, 275, 371 $4, 559, 448 $225, 562 $3, 500, 933 $4, 735, 317 $227, 972 $3, 728, 905 $4, 675, 076 $236, 766 $3, 965, 671 $4, 553, 174 $233, 754 $4, 199, 425 $4, 376, 599 $227, 659 $4, 427, 083 $5, 127, 107 $218, 830 $4, 645, 913 $5, 512, 481 $256, 355 $4, 902, 269 $5, 610, 634 $275, 624 $5, 177, 893 $6, 016, 059 $280, 532 $5, 458, 424 $6, 033, 229 $300, 803 $5, 759, 227 $4, 591, 162 $301, 661 $6, 060, 889 $5, 206, 046 $229, 558 $6, 290, 447 S&P 500 Year‐end Balance $2, 937, 919 $3, 641, 371 $3, 723, 067 $3, 893, 143 $3, 747, 344 $4, 897, 786 $5, 721, 140 $7, 248, 270 $8, 853, 682 $10, 181, 060 $8, 791, 336 $7, 359, 198 $5, 446, 046 $6, 658, 071 $7, 013, 240 $6, 989, 859 $7, 689, 299 $7, 706, 286 $4, 612, 428 $5, 541, 393 Distribution $159, 581 $146, 896 $182, 069 $186, 153 $194, 657 $187, 367 $244, 889 $286, 057 $362, 413 $442, 684 $509, 053 $439, 567 $367, 960 $272, 302 $332, 904 $350, 662 $349, 493 $384, 465 $385, 314 $230, 621 Cumulative Distribution $1, 519, 319 $1, 666, 215 $1, 848, 283 $2, 034, 436 $2, 229, 094 $2, 416, 461 $2, 661, 350 $2, 947, 407 $3, 309, 821 $3, 752, 505 $4, 261, 558 $4, 701, 124 $5, 069, 084 $5, 341, 387 $5, 674, 290 $6, 024, 952 $6, 374, 445 $6, 758, 910 $7, 144, 224 $7, 374, 846
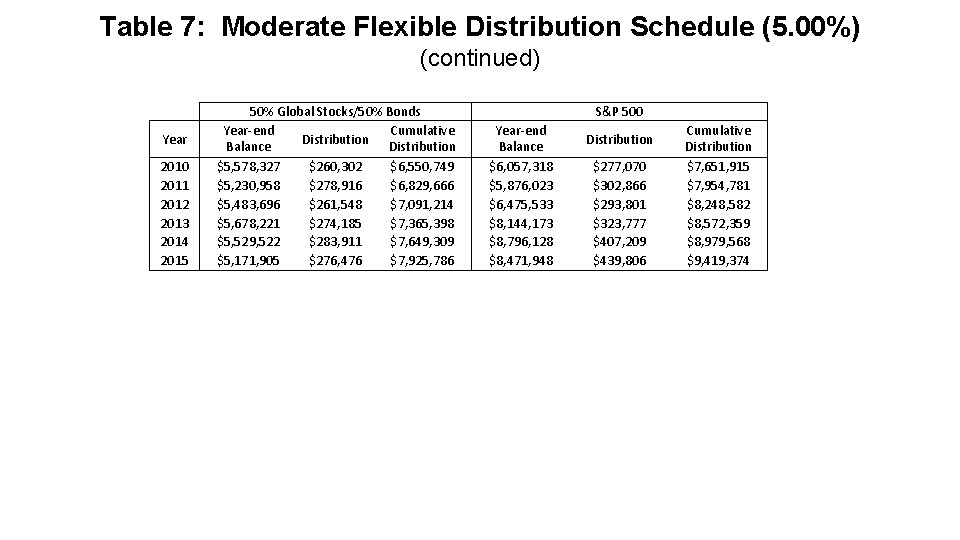
Table 7: Moderate Flexible Distribution Schedule (5. 00%) (continued) Year 2010 2011 2012 2013 2014 2015 50% Global Stocks/50% Bonds Year‐end Cumulative Distribution Balance Distribution $5, 578, 327 $260, 302 $6, 550, 749 $5, 230, 958 $278, 916 $6, 829, 666 $5, 483, 696 $261, 548 $7, 091, 214 $5, 678, 221 $274, 185 $7, 365, 398 $5, 529, 522 $283, 911 $7, 649, 309 $5, 171, 905 $276, 476 $7, 925, 786 S&P 500 Year‐end Balance $6, 057, 318 $5, 876, 023 $6, 475, 533 $8, 144, 173 $8, 796, 128 $8, 471, 948 Distribution $277, 070 $302, 866 $293, 801 $323, 777 $407, 209 $439, 806 Cumulative Distribution $7, 651, 915 $7, 954, 781 $8, 248, 582 $8, 572, 359 $8, 979, 568 $9, 419, 374
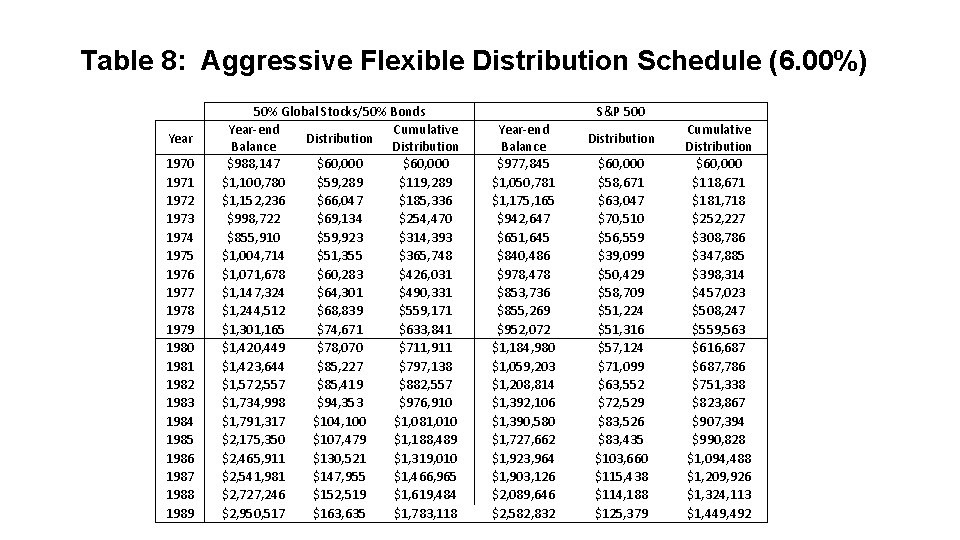
Table 8: Aggressive Flexible Distribution Schedule (6. 00%) Year 1970 1971 1972 1973 1974 1975 1976 1977 1978 1979 1980 1981 1982 1983 1984 1985 1986 1987 1988 1989 50% Global Stocks/50% Bonds Year‐end Cumulative Distribution Balance Distribution $988, 147 $60, 000 $1, 100, 780 $59, 289 $119, 289 $1, 152, 236 $66, 047 $185, 336 $998, 722 $69, 134 $254, 470 $855, 910 $59, 923 $314, 393 $1, 004, 714 $51, 355 $365, 748 $1, 071, 678 $60, 283 $426, 031 $1, 147, 324 $64, 301 $490, 331 $1, 244, 512 $68, 839 $559, 171 $1, 301, 165 $74, 671 $633, 841 $1, 420, 449 $78, 070 $711, 911 $1, 423, 644 $85, 227 $797, 138 $1, 572, 557 $85, 419 $882, 557 $1, 734, 998 $94, 353 $976, 910 $1, 791, 317 $104, 100 $1, 081, 010 $2, 175, 350 $107, 479 $1, 188, 489 $2, 465, 911 $130, 521 $1, 319, 010 $2, 541, 981 $147, 955 $1, 466, 965 $2, 727, 246 $152, 519 $1, 619, 484 $2, 950, 517 $163, 635 $1, 783, 118 S&P 500 Year‐end Balance $977, 845 $1, 050, 781 $1, 175, 165 $942, 647 $651, 645 $840, 486 $978, 478 $853, 736 $855, 269 $952, 072 $1, 184, 980 $1, 059, 203 $1, 208, 814 $1, 392, 106 $1, 390, 580 $1, 727, 662 $1, 923, 964 $1, 903, 126 $2, 089, 646 $2, 582, 832 Distribution $60, 000 $58, 671 $63, 047 $70, 510 $56, 559 $39, 099 $50, 429 $58, 709 $51, 224 $51, 316 $57, 124 $71, 099 $63, 552 $72, 529 $83, 526 $83, 435 $103, 660 $115, 438 $114, 188 $125, 379 Cumulative Distribution $60, 000 $118, 671 $181, 718 $252, 227 $308, 786 $347, 885 $398, 314 $457, 023 $508, 247 $559, 563 $616, 687 $687, 786 $751, 338 $823, 867 $907, 394 $990, 828 $1, 094, 488 $1, 209, 926 $1, 324, 113 $1, 449, 492
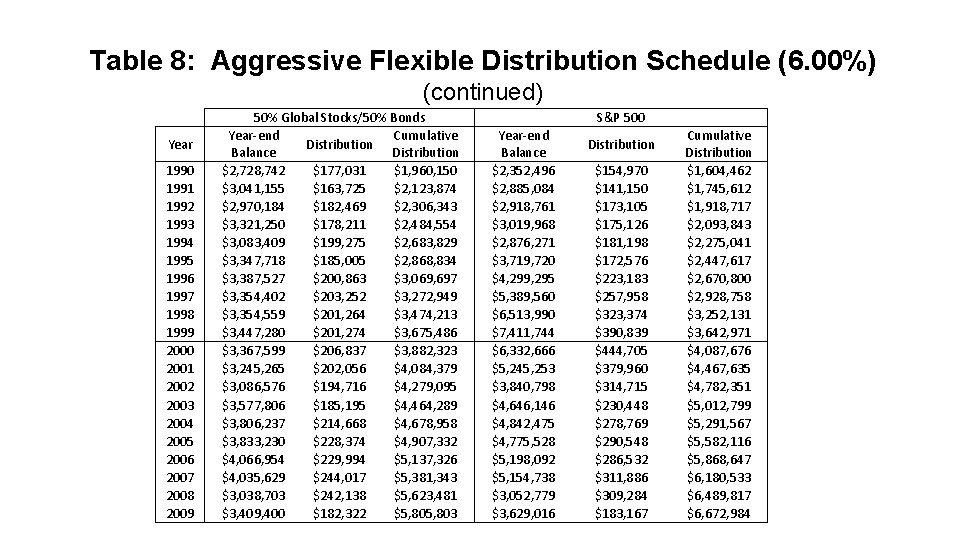
Table 8: Aggressive Flexible Distribution Schedule (6. 00%) (continued) Year 1990 1991 1992 1993 1994 1995 1996 1997 1998 1999 2000 2001 2002 2003 2004 2005 2006 2007 2008 2009 50% Global Stocks/50% Bonds Year‐end Cumulative Distribution Balance Distribution $2, 728, 742 $177, 031 $1, 960, 150 $3, 041, 155 $163, 725 $2, 123, 874 $2, 970, 184 $182, 469 $2, 306, 343 $3, 321, 250 $178, 211 $2, 484, 554 $3, 083, 409 $199, 275 $2, 683, 829 $3, 347, 718 $185, 005 $2, 868, 834 $3, 387, 527 $200, 863 $3, 069, 697 $3, 354, 402 $203, 252 $3, 272, 949 $3, 354, 559 $201, 264 $3, 474, 213 $3, 447, 280 $201, 274 $3, 675, 486 $3, 367, 599 $206, 837 $3, 882, 323 $3, 245, 265 $202, 056 $4, 084, 379 $3, 086, 576 $194, 716 $4, 279, 095 $3, 577, 806 $185, 195 $4, 464, 289 $3, 806, 237 $214, 668 $4, 678, 958 $3, 833, 230 $228, 374 $4, 907, 332 $4, 066, 954 $229, 994 $5, 137, 326 $4, 035, 629 $244, 017 $5, 381, 343 $3, 038, 703 $242, 138 $5, 623, 481 $3, 409, 400 $182, 322 $5, 803 S&P 500 Year‐end Balance $2, 352, 496 $2, 885, 084 $2, 918, 761 $3, 019, 968 $2, 876, 271 $3, 719, 720 $4, 299, 295 $5, 389, 560 $6, 513, 990 $7, 411, 744 $6, 332, 666 $5, 245, 253 $3, 840, 798 $4, 646, 146 $4, 842, 475 $4, 775, 528 $5, 198, 092 $5, 154, 738 $3, 052, 779 $3, 629, 016 Distribution $154, 970 $141, 150 $173, 105 $175, 126 $181, 198 $172, 576 $223, 183 $257, 958 $323, 374 $390, 839 $444, 705 $379, 960 $314, 715 $230, 448 $278, 769 $290, 548 $286, 532 $311, 886 $309, 284 $183, 167 Cumulative Distribution $1, 604, 462 $1, 745, 612 $1, 918, 717 $2, 093, 843 $2, 275, 041 $2, 447, 617 $2, 670, 800 $2, 928, 758 $3, 252, 131 $3, 642, 971 $4, 087, 676 $4, 467, 635 $4, 782, 351 $5, 012, 799 $5, 291, 567 $5, 582, 116 $5, 868, 647 $6, 180, 533 $6, 489, 817 $6, 672, 984
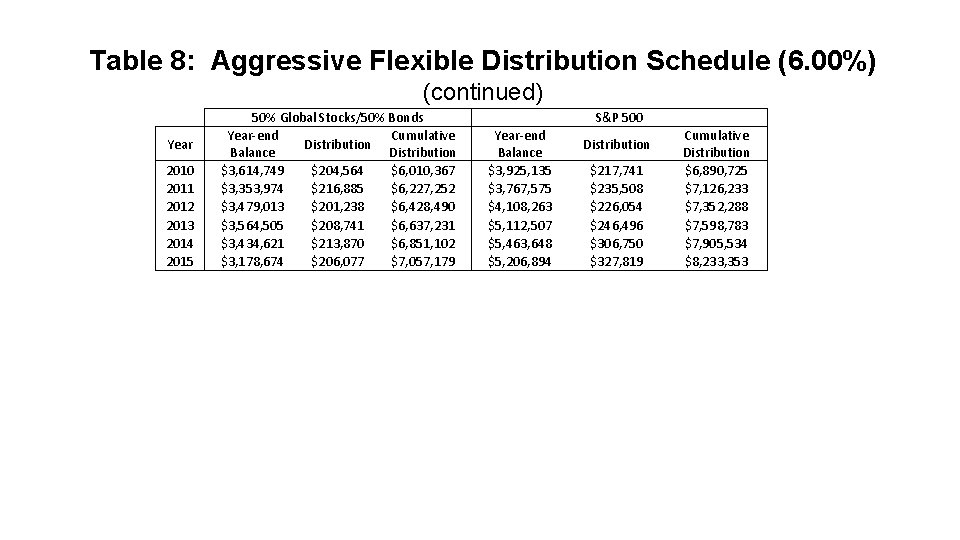
Table 8: Aggressive Flexible Distribution Schedule (6. 00%) (continued) Year 2010 2011 2012 2013 2014 2015 50% Global Stocks/50% Bonds Year‐end Cumulative Distribution Balance Distribution $3, 614, 749 $204, 564 $6, 010, 367 $3, 353, 974 $216, 885 $6, 227, 252 $3, 479, 013 $201, 238 $6, 428, 490 $3, 564, 505 $208, 741 $6, 637, 231 $3, 434, 621 $213, 870 $6, 851, 102 $3, 178, 674 $206, 077 $7, 057, 179 S&P 500 Year‐end Balance $3, 925, 135 $3, 767, 575 $4, 108, 263 $5, 112, 507 $5, 463, 648 $5, 206, 894 Distribution $217, 741 $235, 508 $226, 054 $246, 496 $306, 750 $327, 819 Cumulative Distribution $6, 890, 725 $7, 126, 233 $7, 352, 288 $7, 598, 783 $7, 905, 534 $8, 233, 353
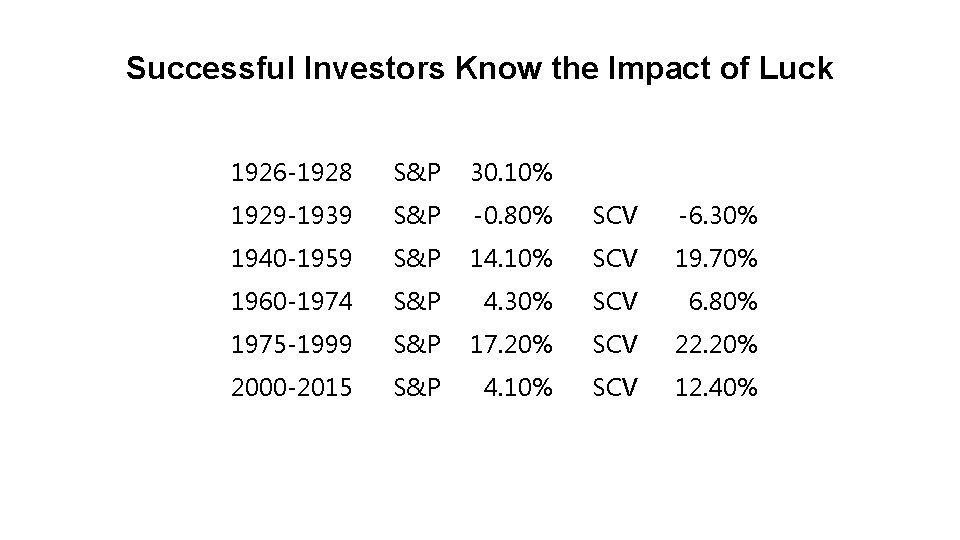
Successful Investors Know the Impact of Luck 1926 -1928 S&P 30. 10% 1929 -1939 S&P -0. 80% SCV -6. 30% 1940 -1959 S&P 14. 10% SCV 19. 70% 1960 -1974 S&P 4. 30% SCV 6. 80% 1975 -1999 S&P 17. 20% SCV 22. 20% 2000 -2015 S&P 4. 10% SCV 12. 40%
Successful Investors Select the Best Sources of Advice • • Select competent and ethical advisor Select competent and ethical firm Select competent and ethical investments Wall Street: $20+ billion bank and brokers (201415) • Main Street: Who can you trust? • University Street: The only trustworthy source
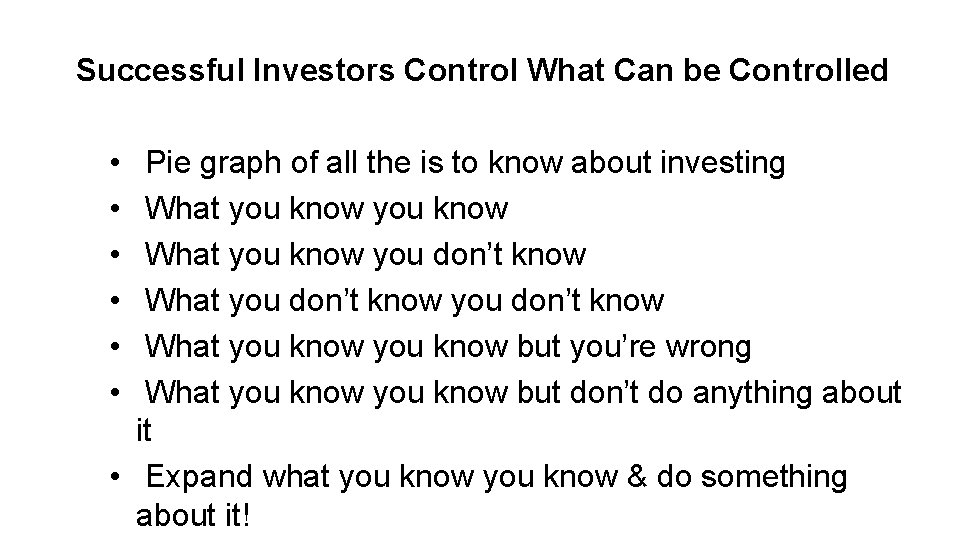
Successful Investors Control What Can be Controlled • • • Pie graph of all the is to know about investing What you know you don’t know What you don’t know What you know but you’re wrong What you know but don’t do anything about it • Expand what you know & do something about it!
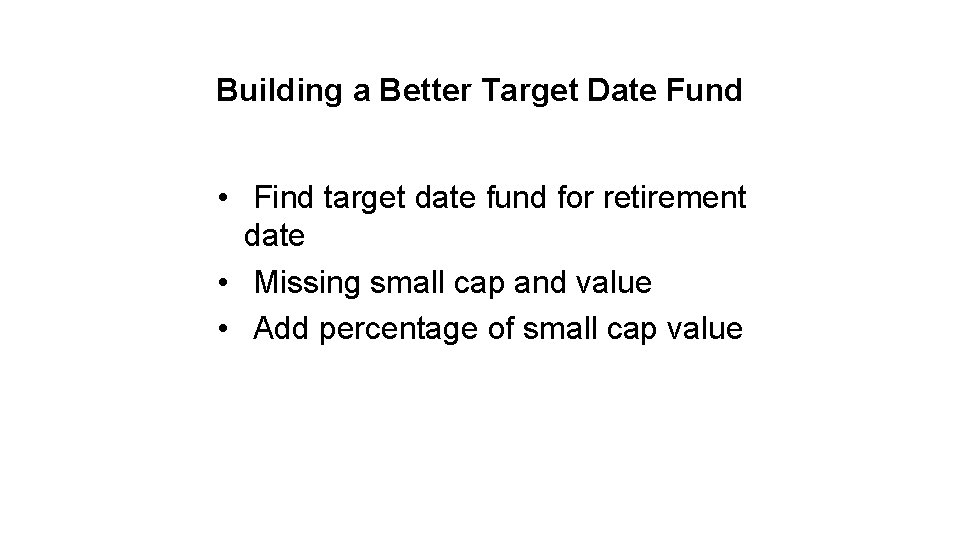
Building a Better Target Date Fund • Find target date fund for retirement date • Missing small cap and value • Add percentage of small cap value
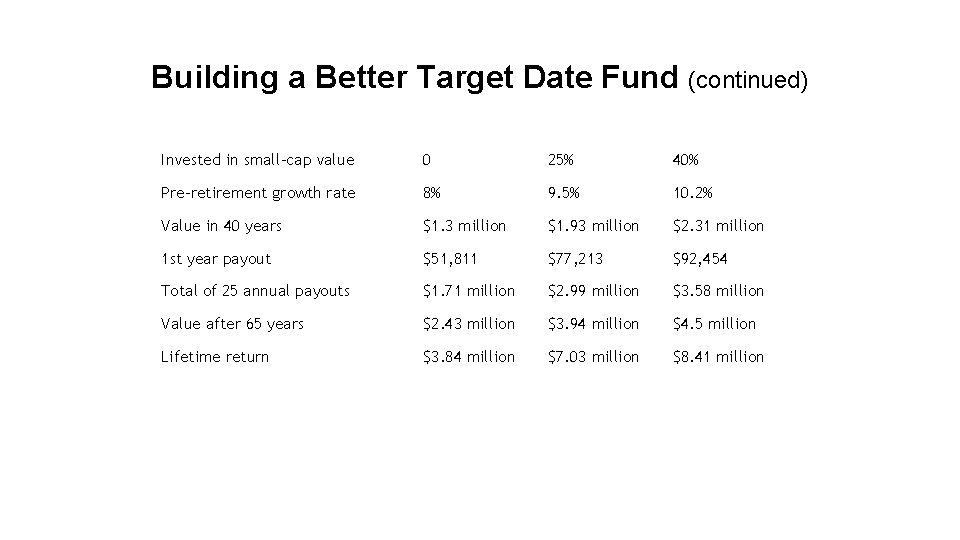
Building a Better Target Date Fund (continued) Invested in small-cap value 0 25% 40% Pre-retirement growth rate 8% 9. 5% 10. 2% Value in 40 years $1. 3 million $1. 93 million $2. 31 million 1 st year payout $51, 811 $77, 213 $92, 454 Total of 25 annual payouts $1. 71 million $2. 99 million $3. 58 million Value after 65 years $2. 43 million $3. 94 million $4. 5 million Lifetime return $3. 84 million $7. 03 million $8. 41 million
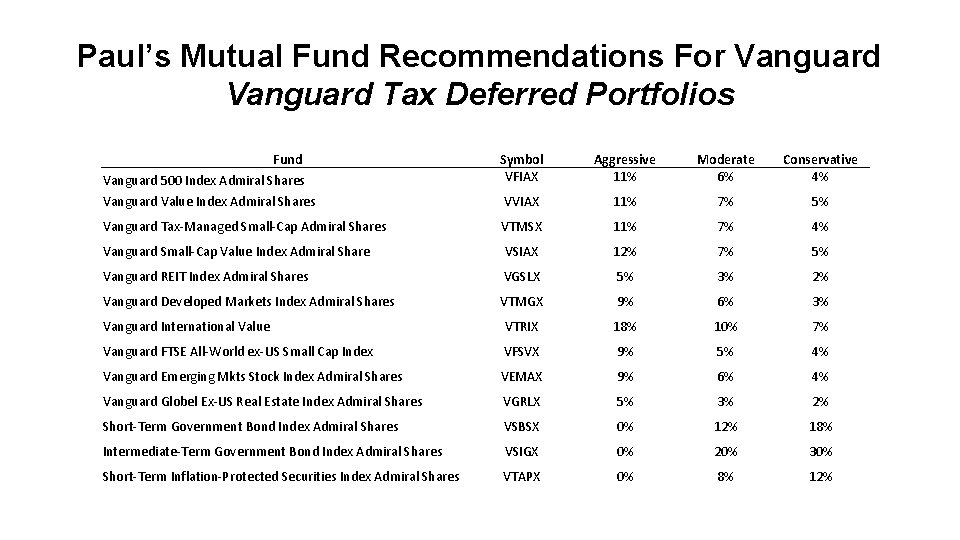
Paul’s Mutual Fund Recommendations For Vanguard Tax Deferred Portfolios Fund Vanguard 500 Index Admiral Shares Symbol VFIAX Aggressive 11% Moderate 6% Conservative 4% Vanguard Value Index Admiral Shares VVIAX 11% 7% 5% Vanguard Tax‐Managed Small‐Cap Admiral Shares VTMSX 11% 7% 4% Vanguard Small‐Cap Value Index Admiral Share VSIAX 12% 7% 5% Vanguard REIT Index Admiral Shares VGSLX 5% 3% 2% Vanguard Developed Markets Index Admiral Shares VTMGX 9% 6% 3% Vanguard International Value VTRIX 18% 10% 7% Vanguard FTSE All‐World ex‐US Small Cap Index VFSVX 9% 5% 4% Vanguard Emerging Mkts Stock Index Admiral Shares VEMAX 9% 6% 4% Vanguard Globel Ex‐US Real Estate Index Admiral Shares VGRLX 5% 3% 2% Short‐Term Government Bond Index Admiral Shares VSBSX 0% 12% 18% Intermediate‐Term Government Bond Index Admiral Shares VSIGX 0% 20% 30% Short‐Term Inflation‐Protected Securities Index Admiral Shares VTAPX 0% 8% 12%
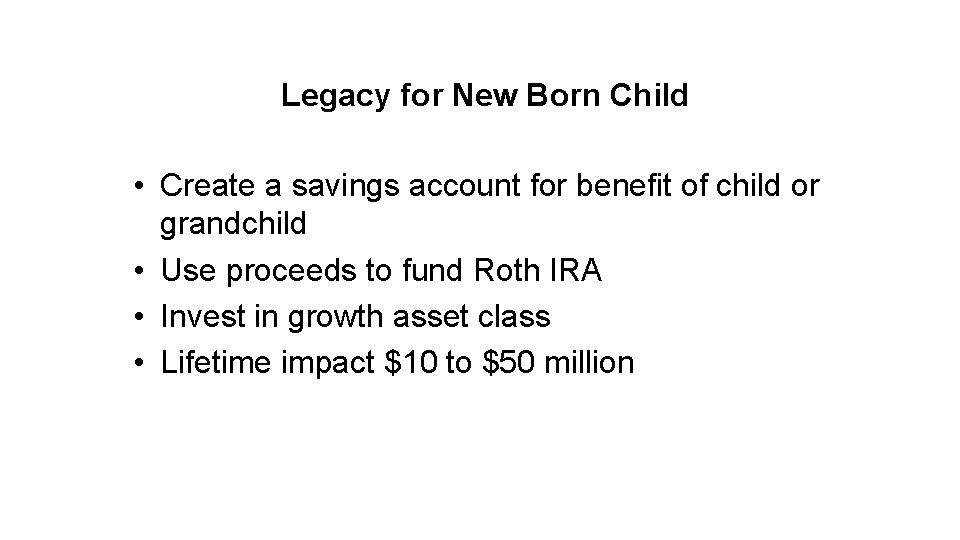
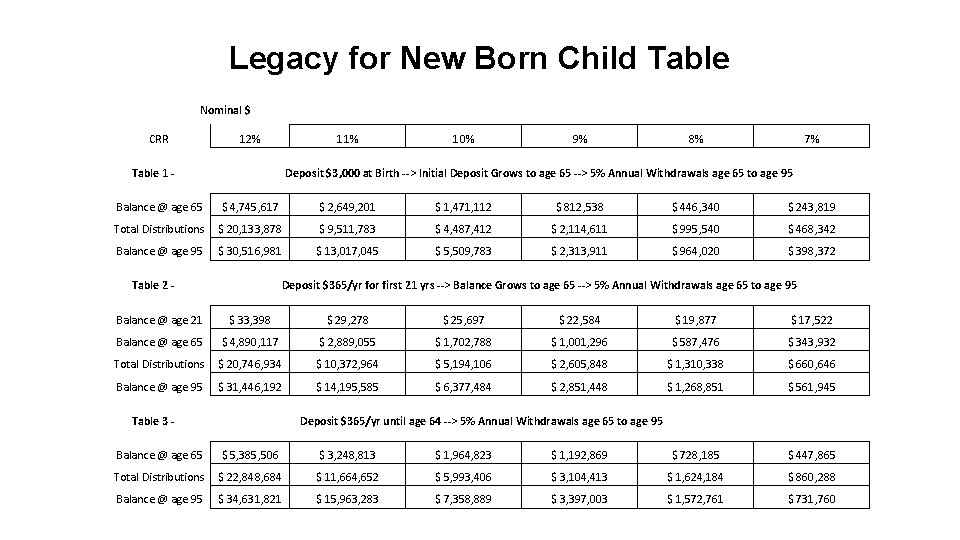
Legacy for New Born Child • Create a savings account for benefit of child or grandchild • Use proceeds to fund Roth IRA • Invest in growth asset class • Lifetime impact $10 to $50 million
Legacy for New Born Child Table Nominal $ CRR 12% Table 1 - 11% 10% 9% 8% 7% Deposit $3, 000 at Birth --> Initial Deposit Grows to age 65 --> 5% Annual Withdrawals age 65 to age 95 Balance @ age 65 $ 4, 745, 617 $ 2, 649, 201 $ 1, 471, 112 $ 812, 538 $ 446, 340 $ 243, 819 Total Distributions $ 20, 133, 878 $ 9, 511, 783 $ 4, 487, 412 $ 2, 114, 611 $ 995, 540 $ 468, 342 Balance @ age 95 $ 30, 516, 981 $ 13, 017, 045 $ 5, 509, 783 $ 2, 313, 911 $ 964, 020 $ 398, 372 Table 2 - Deposit $365/yr for first 21 yrs --> Balance Grows to age 65 --> 5% Annual Withdrawals age 65 to age 95 Balance @ age 21 $ 33, 398 $ 29, 278 $ 25, 697 $ 22, 584 $ 19, 877 $ 17, 522 Balance @ age 65 $ 4, 890, 117 $ 2, 889, 055 $ 1, 702, 788 $ 1, 001, 296 $ 587, 476 $ 343, 932 Total Distributions $ 20, 746, 934 $ 10, 372, 964 $ 5, 194, 106 $ 2, 605, 848 $ 1, 310, 338 $ 660, 646 Balance @ age 95 $ 31, 446, 192 $ 14, 195, 585 $ 6, 377, 484 $ 2, 851, 448 $ 1, 268, 851 $ 561, 945 Table 3 - Deposit $365/yr until age 64 --> 5% Annual Withdrawals age 65 to age 95 Balance @ age 65 $ 5, 385, 506 $ 3, 248, 813 $ 1, 964, 823 $ 1, 192, 869 $ 728, 185 $ 447, 865 Total Distributions $ 22, 848, 684 $ 11, 664, 652 $ 5, 993, 406 $ 3, 104, 413 $ 1, 624, 184 $ 860, 288 Balance @ age 95 $ 34, 631, 821 $ 15, 963, 283 $ 7, 358, 889 $ 3, 397, 003 $ 1, 572, 761 $ 731, 760
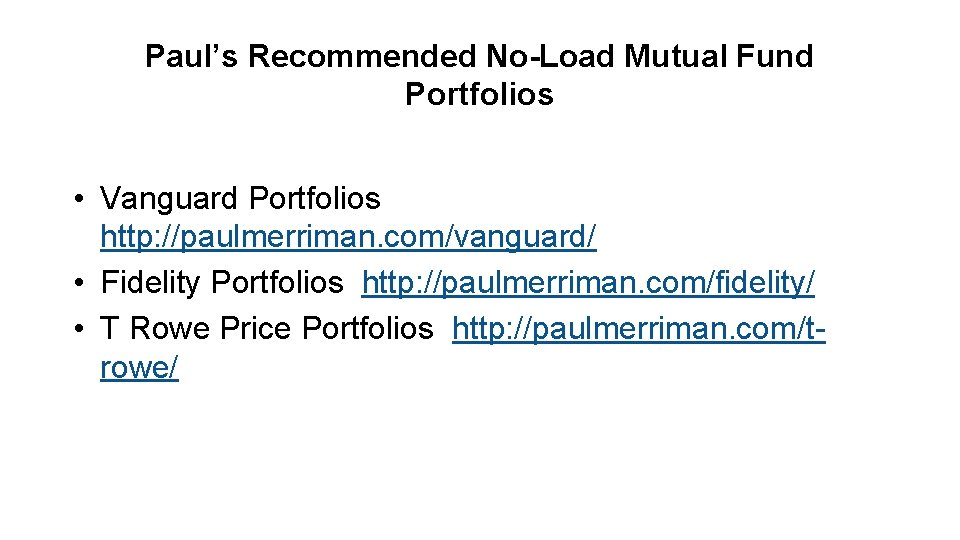
Paul’s Recommended No-Load Mutual Fund Portfolios • Vanguard Portfolios http: //paulmerriman. com/vanguard/ • Fidelity Portfolios http: //paulmerriman. com/fidelity/ • T Rowe Price Portfolios http: //paulmerriman. com/trowe/
Paul’s Recommended Commission-Free ETF Portfolios • Vanguard Portfolios http: //paulmerriman. com/vanguardtax-deferred-etf-portfolios/ • Fidelity Portfolios http: //paulmerriman. com/fidelity-tax -deferred-etf-portfolios/ • Schwab Portfolios http: //paulmerriman. com/schwabtax-deferred-etf-portfolios/ • TD Ameritrade Portfolios http: //paulmerriman. com/tdameritrade-tax-deferred-etf-portfolios/
Paul’s Recommended Reading • “Your Money & Your Brain” by Jason Zweig • “The Little Book of Common Sense Investing” by John Bogle • “Thinking: Fast and Slow” by Daniel Kahneman • “Mutual Funds for Dummies” by Eric Tyson (2016 edition)
Articles, Free Newsletter and Free E-Books from Paul. Merriman. Com The following e-Books are free at paulmerriman. com: • First Time Investor: Grow and Protect Your Money http: //paulmerriman. com/first-time-investors/ • 101 Investment Decisions Guaranteed to Change Your Financial Future http: //paulmerriman. com/101 -investmentdecisions/ • Get Smart or Get Screwed: How to Select the Best and Get the Most Out of Your Financial Advisor http: //paulmerriman. com/getsmart-or-get-screwed/
Articles, Free Newsletter and Free E-Books from Paul. Merriman. Com • The Ultimate Buy and Hold Strategy” article, table and podcast is updated each year: http: //paulmerriman. com/ultimate-buy-holdstrategy-2016/ • “Fine Tuning Your Asset Allocation” article, table and podcast is updated each year: http: //paulmerriman. com/fine-tuning-assetallocations-2016/ • Retirement Distribution articles, tables and podcasts are updated each year: http: //paulmerriman. com/retirement-distributions-2016/
Quotes to Make You a Successful Investor • “To be a success you only have to do a very few things right in your life, as long as you don’t do too many things wrong. ” Warren Buffet • "It's amazing how difficult it is for a man to understand something if he's paid a small fortune not to understand it. ” John Bogle • “We have two classes of forecasters: Those who don’t know – and those who don’t know they don’t know. ” John Kenneth Galbraith, Economist
Questions • Contact: Paul Merriman @ paul@paulmerriman. com • Paul’s free e-Books