Fifth Grade Indiana Math Standards 5 6 1


- Slides: 8
Fifth Grade Indiana Math Standards 5. 6. 1 Explain which types of displays are appropriate for various sets of data. Example: conduct a survey to find the favorite movies of the students in your class. Decide whether to use a bar, line or picture graph to display the data. Explain your decision.
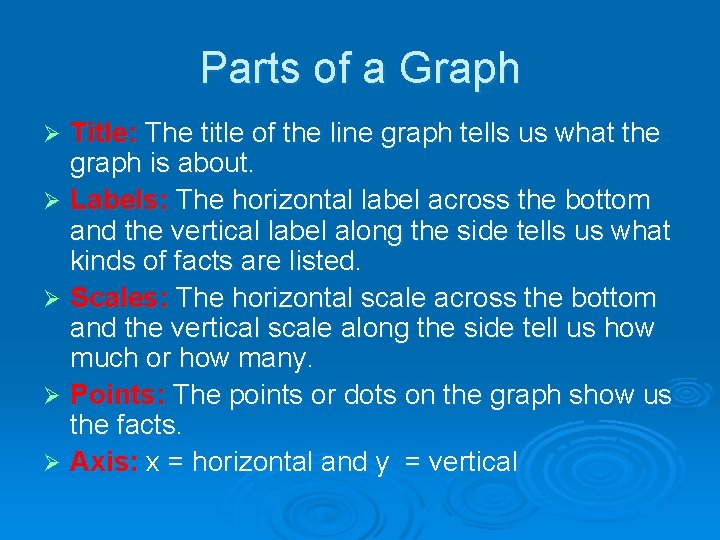
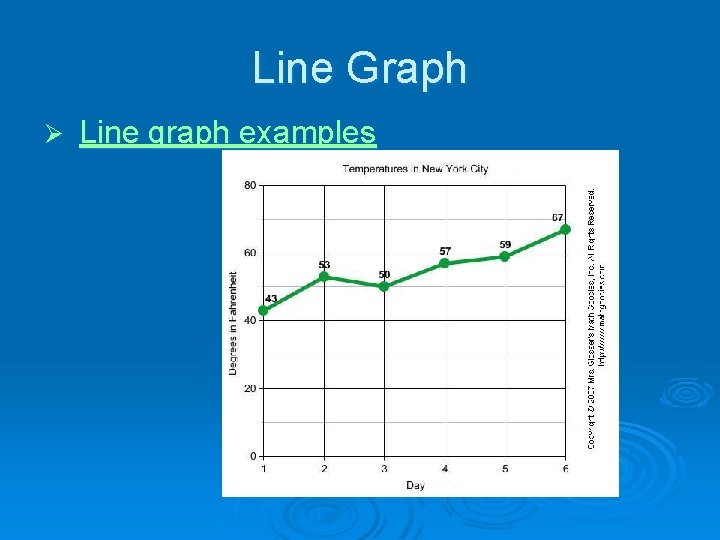
Parts of a Graph Title: The title of the line graph tells us what the graph is about. Ø Labels: The horizontal label across the bottom and the vertical label along the side tells us what kinds of facts are listed. Ø Scales: The horizontal scale across the bottom and the vertical scale along the side tell us how much or how many. Ø Points: The points or dots on the graph show us the facts. Ø Axis: x = horizontal and y = vertical Ø
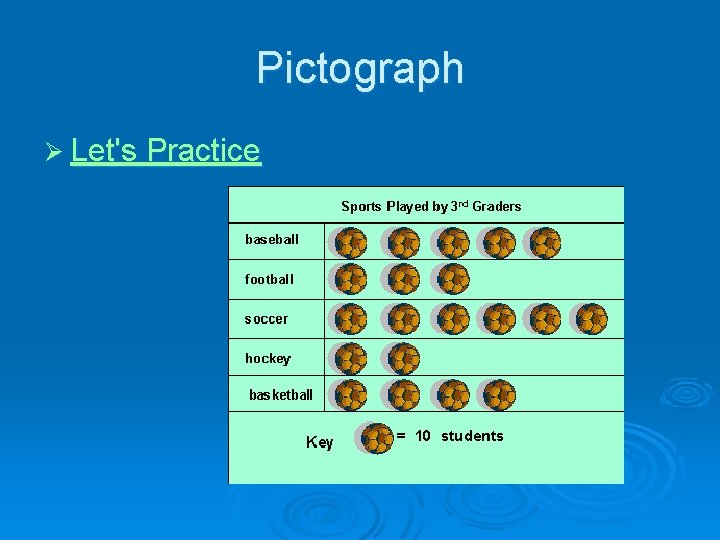
Pictograph Ø Let's Practice
Line Graph Ø Line graph examples
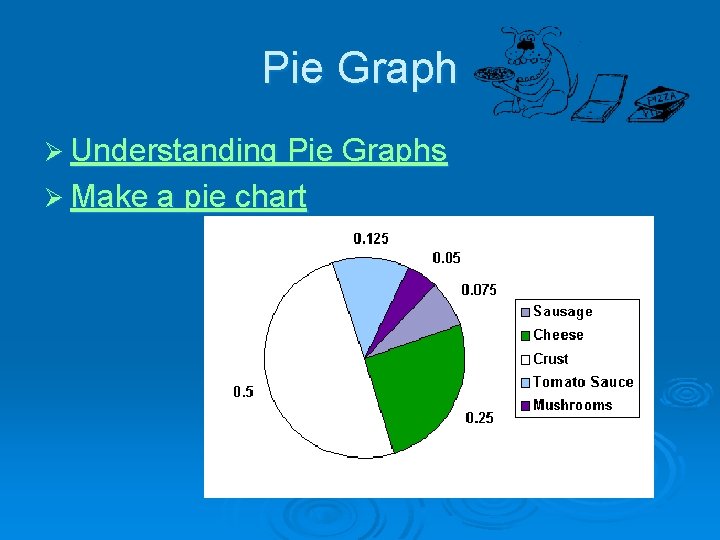
Pie Graph Ø Understanding Pie Graphs Ø Make a pie chart
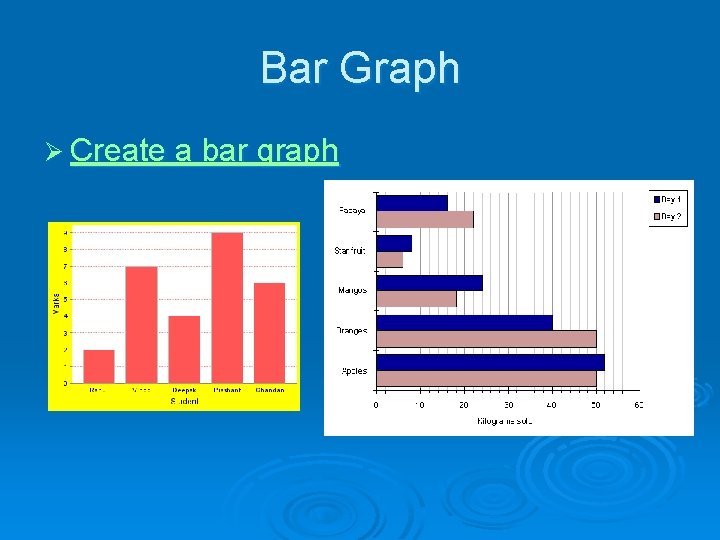
Bar Graph Ø Create a bar graph
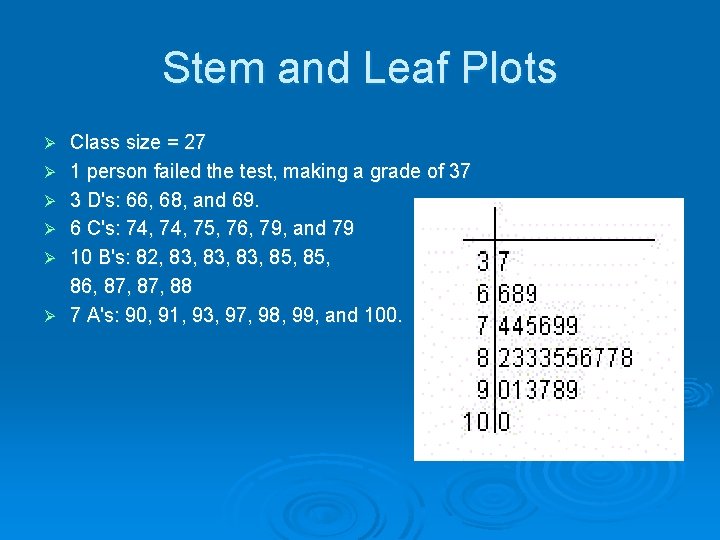
Stem and Leaf Plots Ø Ø Ø Class size = 27 1 person failed the test, making a grade of 37 3 D's: 66, 68, and 69. 6 C's: 74, 75, 76, 79, and 79 10 B's: 82, 83, 83, 85, 86, 87, 88 7 A's: 90, 91, 93, 97, 98, 99, and 100.
Kids USA Surveys Ø Kids USA surveys