Example 2 5 1 Estimate the average drawdown





- Slides: 10
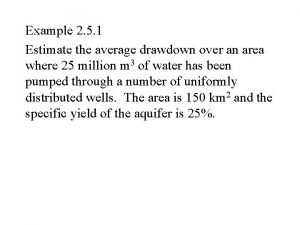
Example 2. 5. 1 Estimate the average drawdown over an area where 25 million m 3 of water has been pumped through a number of uniformly distributed wells. The area is 150 km 2 and the specific yield of the aquifer is 25%.
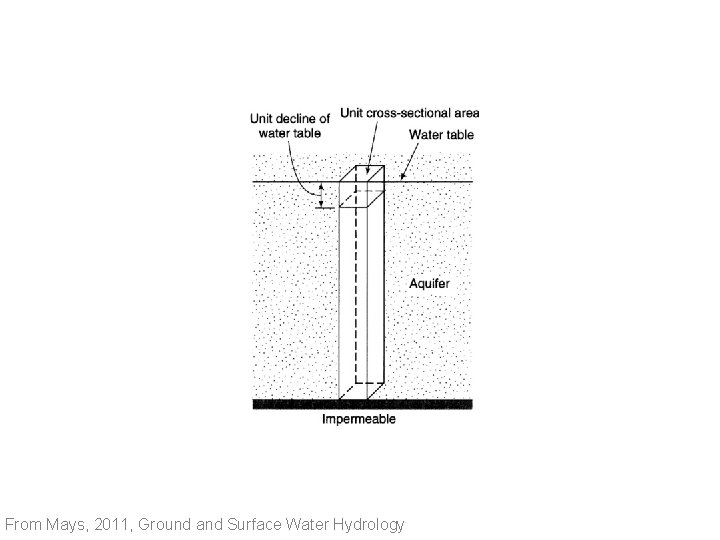
From Mays, 2011, Ground and Surface Water Hydrology
Estimate the average drawdown over an area where 25 million m 3 of water has been pumped through a number of uniformly distributed wells. The area is 150 km 2 and the specific yield of the aquifer is 25%. Now suppose that for this same aquifer there is 0. 1 m of infiltration from rainfall. How much would the aquifer rise A. 0. 1 m, B. 0. 2 m, C. 0. 3 D. 0. 4 m, E. 0. 5 m
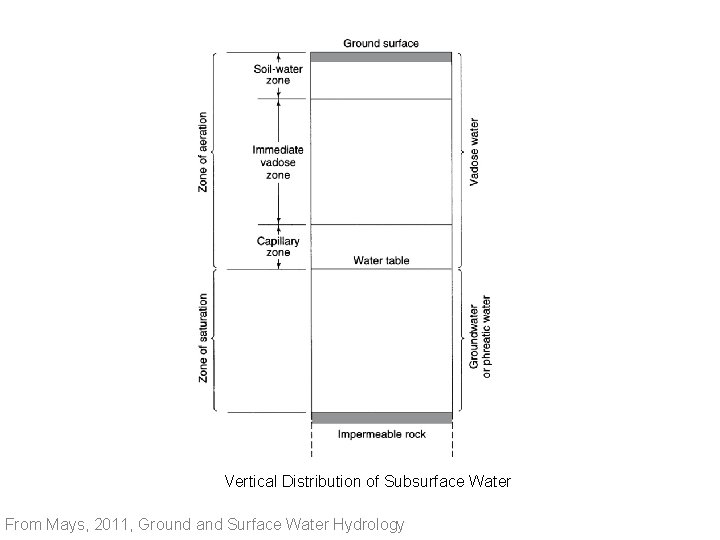
Vertical Distribution of Subsurface Water From Mays, 2011, Ground and Surface Water Hydrology
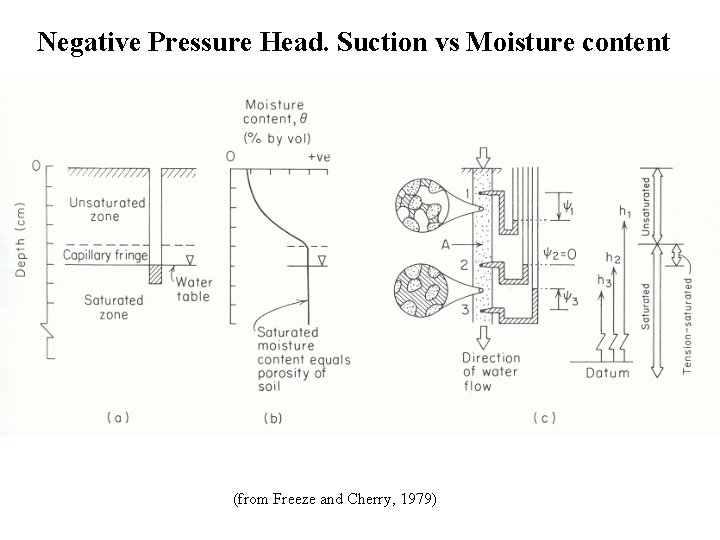
Rise of water above water table – due to capillary effects Water in capillaries is at negative pressure, i. e. under suction or tension From Mays, 2011, Ground and Surface Water Hydrology
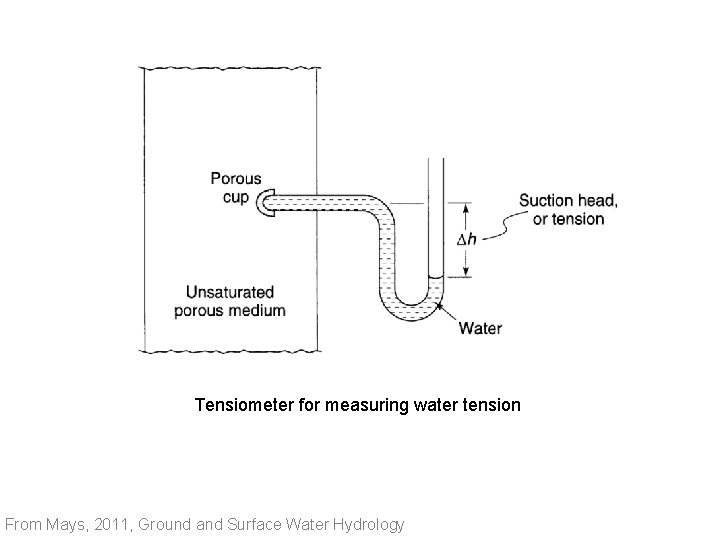
Tensiometer for measuring water tension From Mays, 2011, Ground and Surface Water Hydrology
Negative Pressure Head. Suction vs Moisture content (from Freeze and Cherry, 1979)
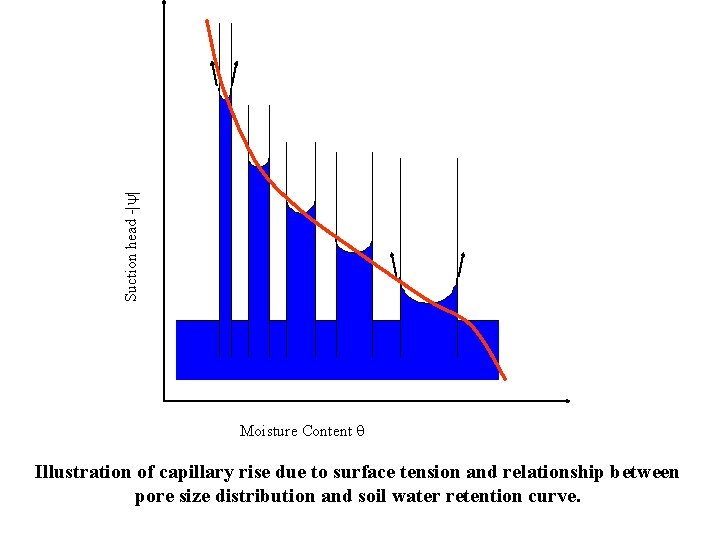
Suction head -| | Moisture Content Illustration of capillary rise due to surface tension and relationship between pore size distribution and soil water retention curve.
Storage Coefficient for (a) confined and (b) unconfined aquifers From Mays, 2011, Ground and Surface Water Hydrology
Example 2. 8. 2 Determine the volume of water released by lowering the piezometric surface of a confined aquifer by 5 m over an area of 1 km 2. The aquifer is 35 m thick and has a storage coefficient of 8. 3 x 10 -3. What is the specific storage of this aquifer If the aquifer was 50 m thick, what would the storage coefficient and volume of water be