Epitaxy Greek root epi placed or resting upon
- Slides: 60
Epitaxy • Greek root: epi = “placed or resting upon” + taxis = “arrangement” • A single crystal substrate acts as a template for the film growth • The film has the same or related crystal structure as the substrate • The film is called an epilayer
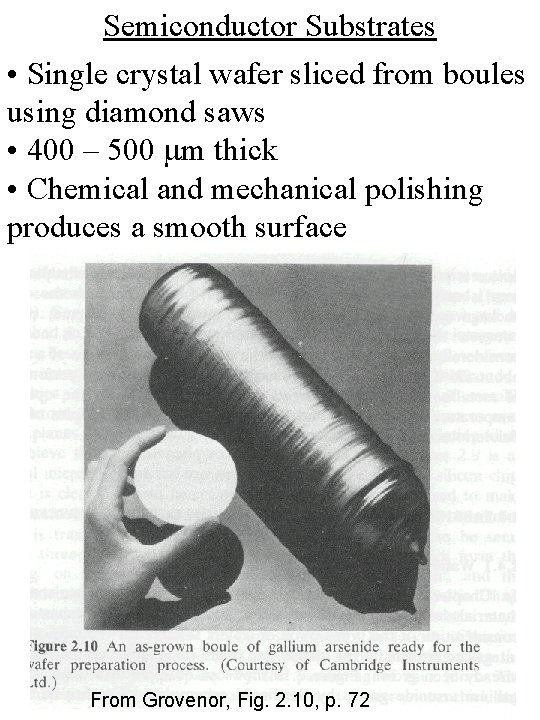
Semiconductor Substrates • Single crystal wafer sliced from boules using diamond saws • 400 – 500 mm thick • Chemical and mechanical polishing produces a smooth surface From Grovenor, Fig. 2. 10, p. 72
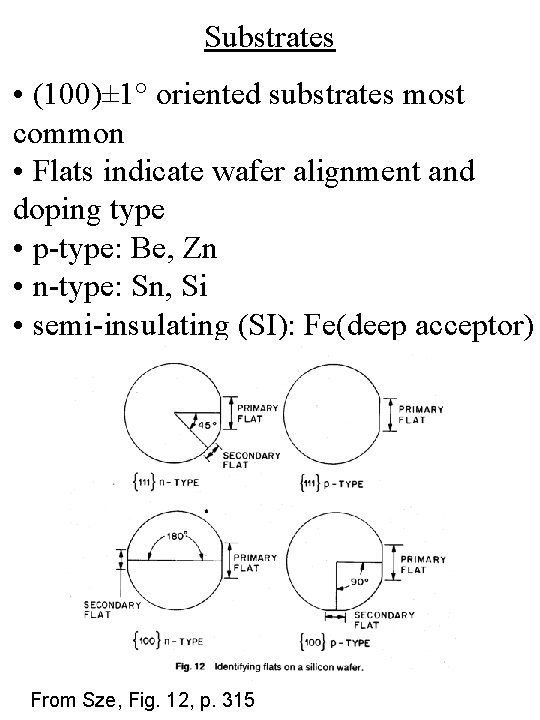
Substrates • (100)± 1° oriented substrates most common • Flats indicate wafer alignment and doping type • p-type: Be, Zn • n-type: Sn, Si • semi-insulating (SI): Fe(deep acceptor) From Sze, Fig. 12, p. 315
Substrates • Substrate Preparation • Thermal outgassing • Oxide desorption (thermal, sputtering, ECR plasma, atomic hydrogen)
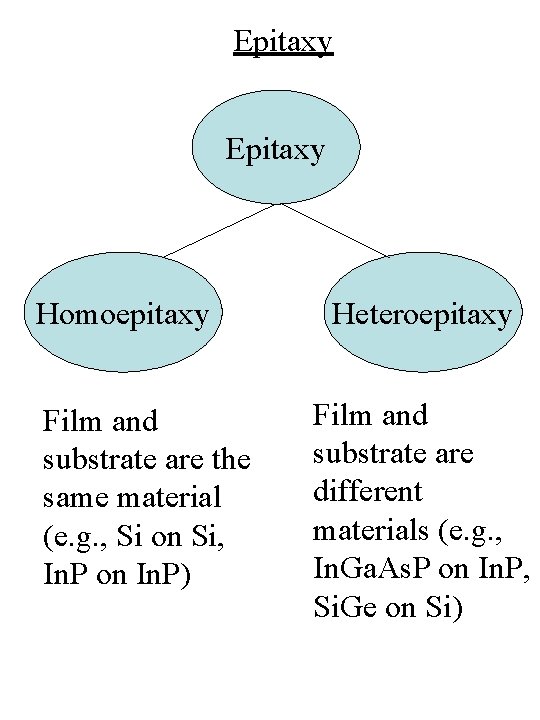
Epitaxy Homoepitaxy Film and substrate are the same material (e. g. , Si on Si, In. P on In. P) Heteroepitaxy Film and substrate are different materials (e. g. , In. Ga. As. P on In. P, Si. Ge on Si)
Epitaxy • Why homoepitaxy ? • The film can be made more free of defects, purer than the substrate and can be doped independently of the substrate • Why heteroepitaxy ? • Ability to control bandgap • Heterostructures can be created to confine electrons and light (e. g. , quantum wells)
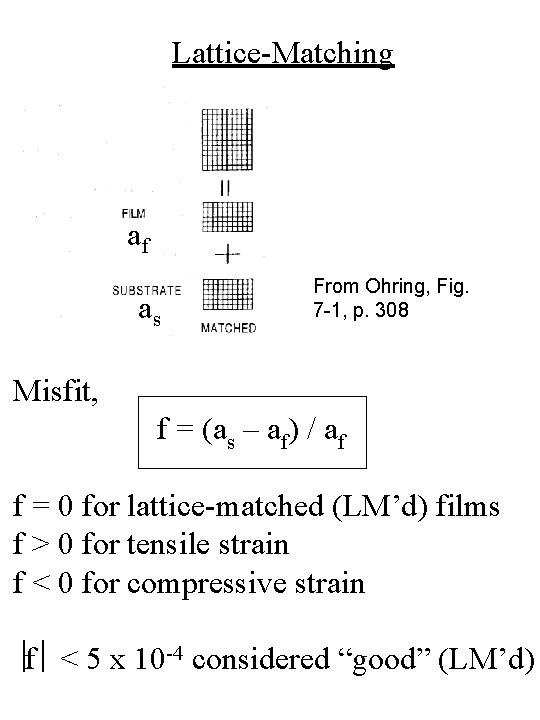
Lattice-Matching af as From Ohring, Fig. 7 -1, p. 308 Misfit, f = (as – af) / af f = 0 for lattice-matched (LM’d) films f > 0 for tensile strain f < 0 for compressive strain f < 5 x 10 -4 considered “good” (LM’d)
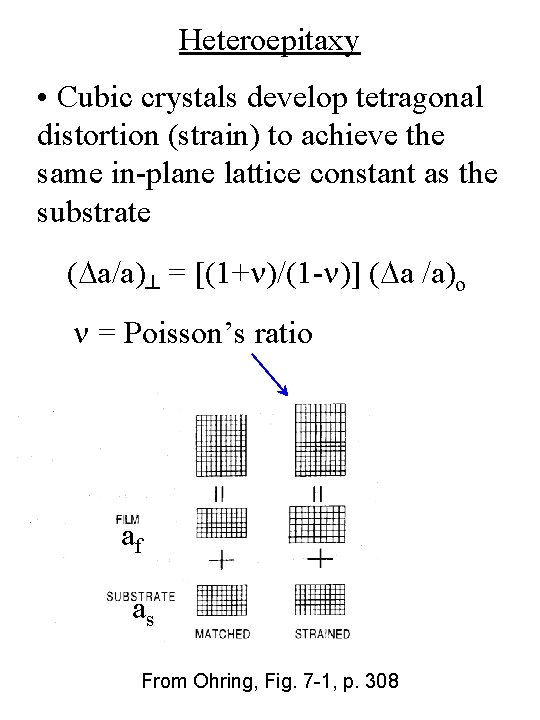
Heteroepitaxy • Cubic crystals develop tetragonal distortion (strain) to achieve the same in-plane lattice constant as the substrate (Da/a)┴ = [(1+n)/(1 -n)] (Da /a)o n = Poisson’s ratio af as From Ohring, Fig. 7 -1, p. 308
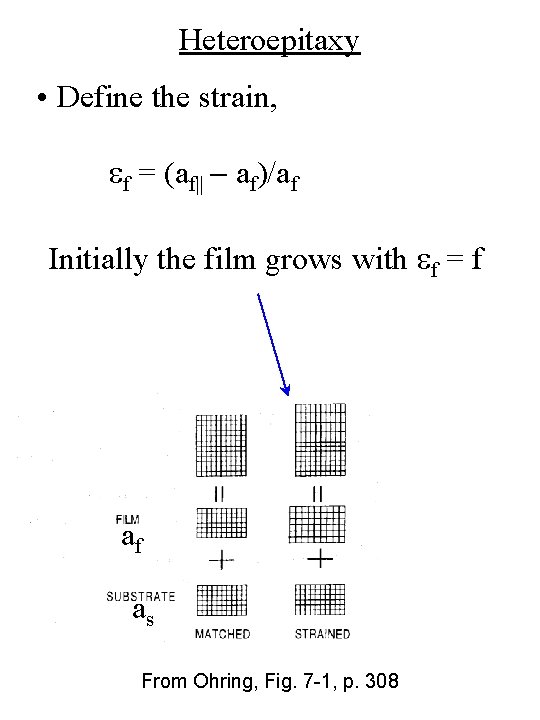
Heteroepitaxy • Define the strain, ef = (af|| - af)/af Initially the film grows with ef = f af as From Ohring, Fig. 7 -1, p. 308
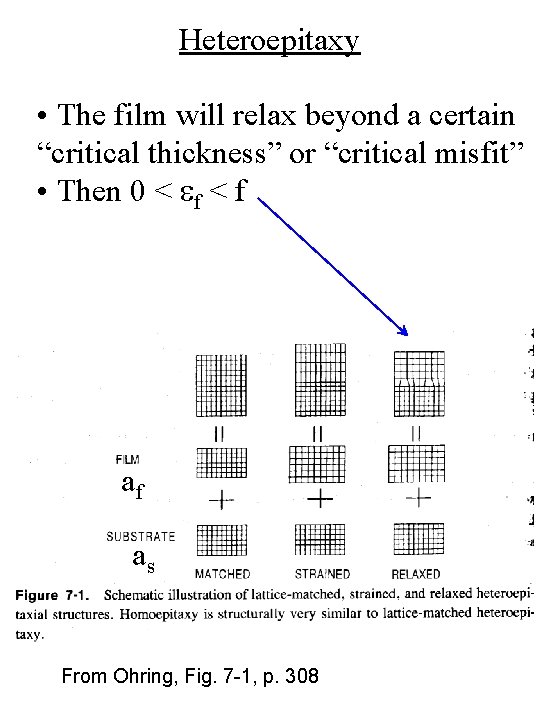
Heteroepitaxy • The film will relax beyond a certain “critical thickness” or “critical misfit” • Then 0 < ef < f af as From Ohring, Fig. 7 -1, p. 308
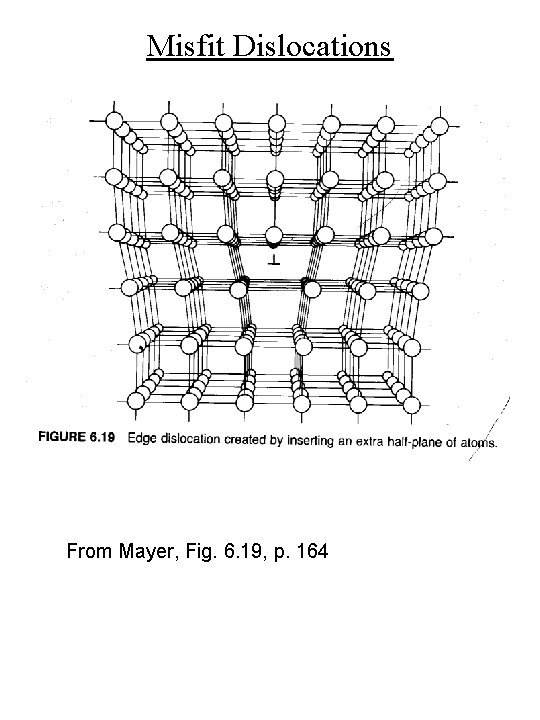
Misfit Dislocations From Mayer, Fig. 6. 19, p. 164
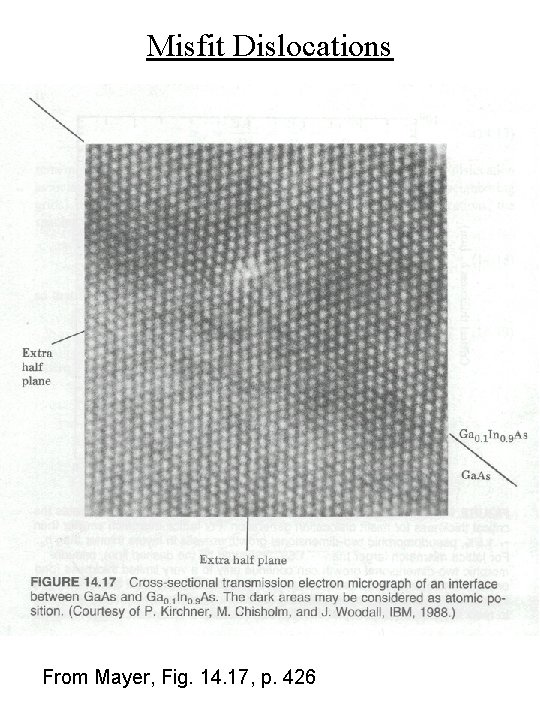
Misfit Dislocations From Mayer, Fig. 14. 17, p. 426
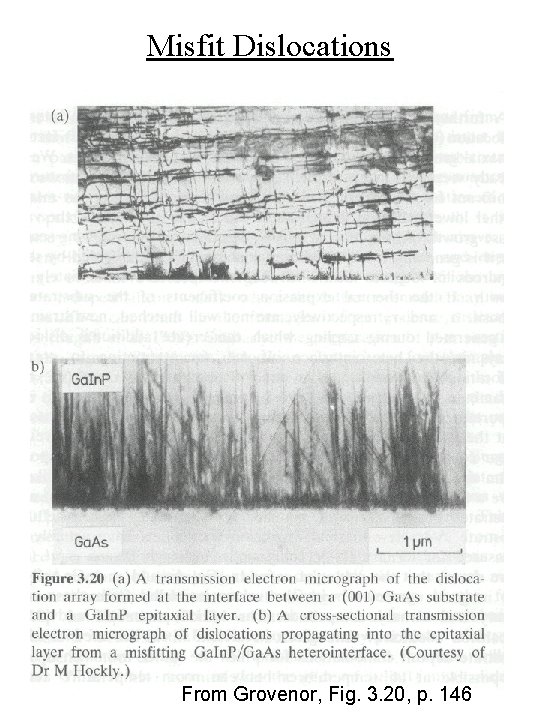
Misfit Dislocations From Grovenor, Fig. 3. 20, p. 146
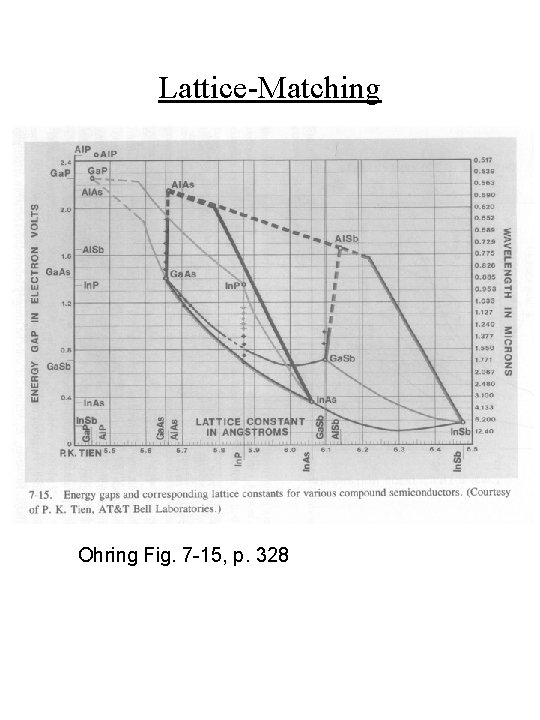
Lattice-Matching Ohring Fig. 7 -15, p. 328
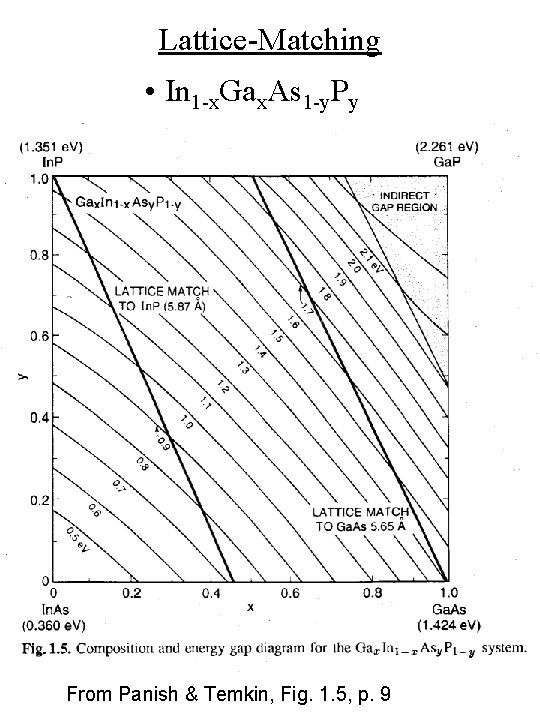
Lattice-Matching • In 1 -x. Gax. As 1 -y. Py From Panish & Temkin, Fig. 1. 5, p. 9
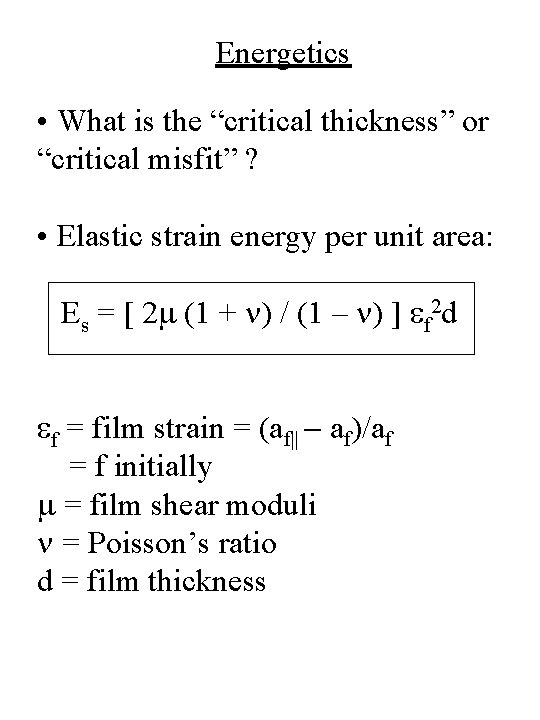
Energetics • What is the “critical thickness” or “critical misfit” ? • Elastic strain energy per unit area: Es = [ 2 m (1 + n) / (1 – n) ] ef 2 d ef = film strain = (af|| - af)/af = f initially m = film shear moduli n = Poisson’s ratio d = film thickness
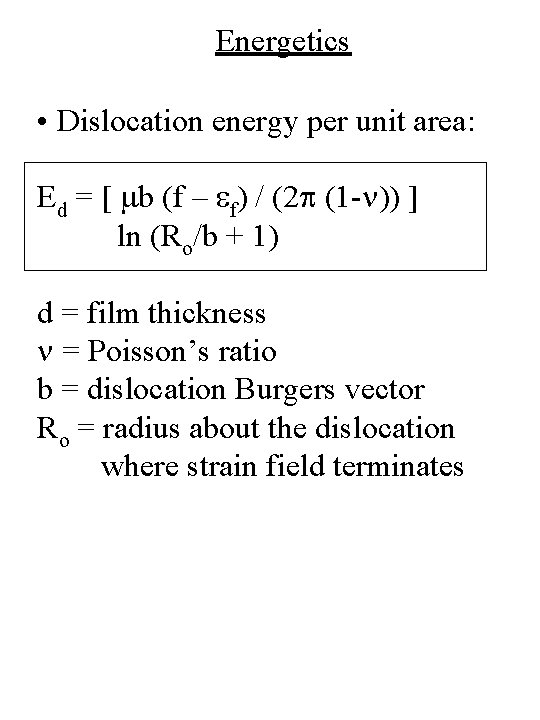
Energetics • Dislocation energy per unit area: Ed = [ mb (f – ef) / (2 p (1 -n)) ] ln (Ro/b + 1) d = film thickness n = Poisson’s ratio b = dislocation Burgers vector Ro = radius about the dislocation where strain field terminates
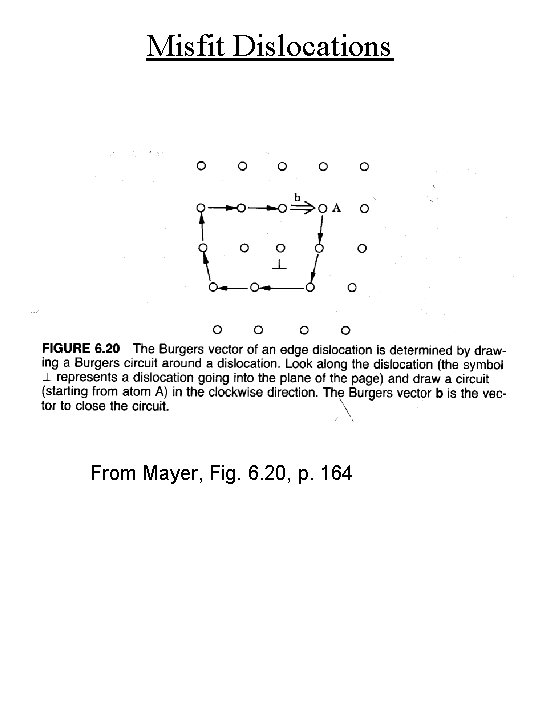
Misfit Dislocations From Mayer, Fig. 6. 20, p. 164
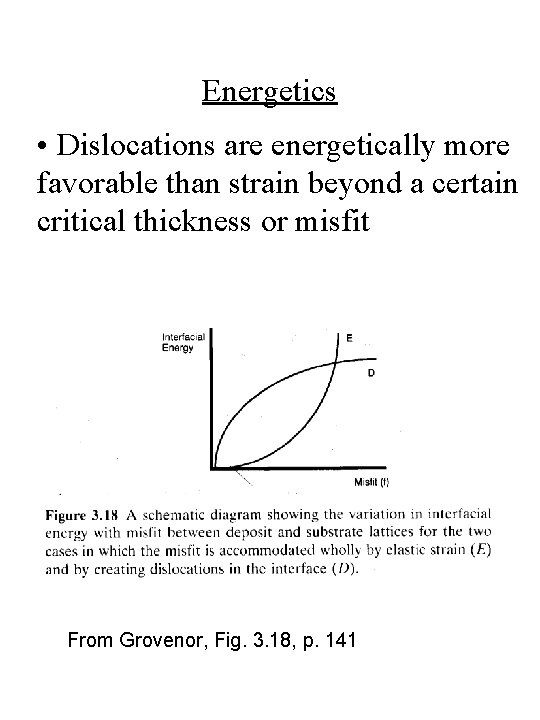
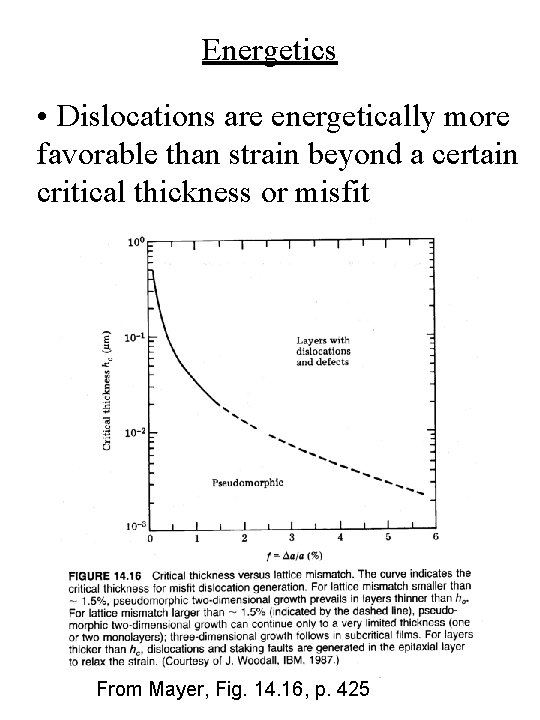
Energetics • Dislocations are energetically more favorable than strain beyond a certain critical thickness or misfit From Grovenor, Fig. 3. 18, p. 141
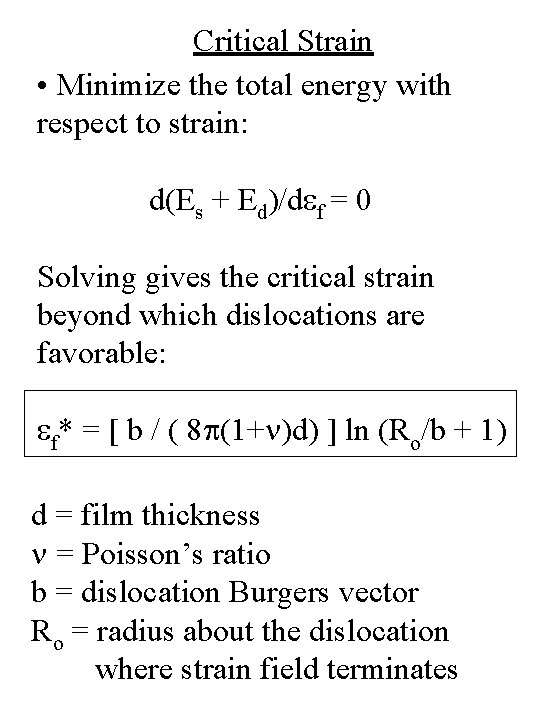
Critical Strain • Minimize the total energy with respect to strain: d(Es + Ed)/def = 0 Solving gives the critical strain beyond which dislocations are favorable: ef* = [ b / ( 8 p(1+n)d) ] ln (Ro/b + 1) d = film thickness n = Poisson’s ratio b = dislocation Burgers vector Ro = radius about the dislocation where strain field terminates
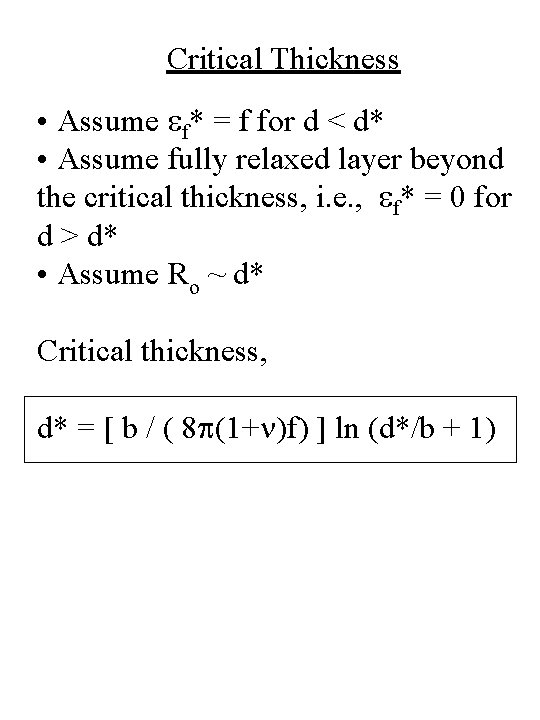
Critical Thickness • Assume ef* = f for d < d* • Assume fully relaxed layer beyond the critical thickness, i. e. , ef* = 0 for d > d* • Assume Ro ~ d* Critical thickness, d* = [ b / ( 8 p(1+n)f) ] ln (d*/b + 1)
Energetics • Dislocations are energetically more favorable than strain beyond a certain critical thickness or misfit From Mayer, Fig. 14. 16, p. 425
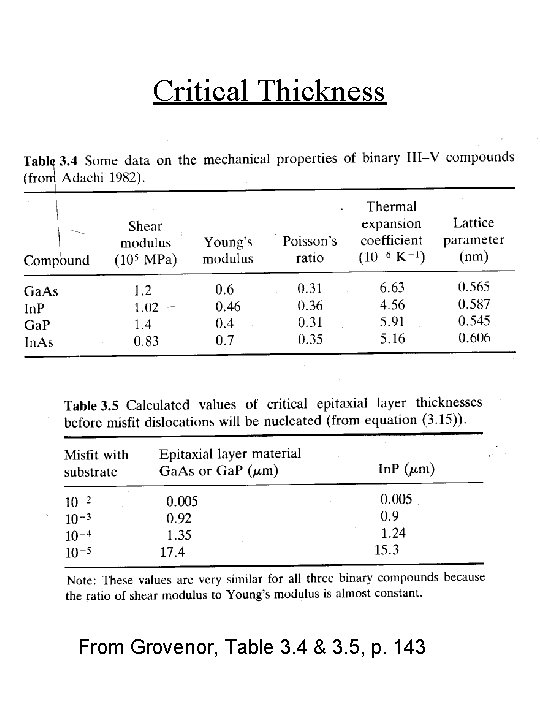
Critical Thickness From Grovenor, Table 3. 4 & 3. 5, p. 143
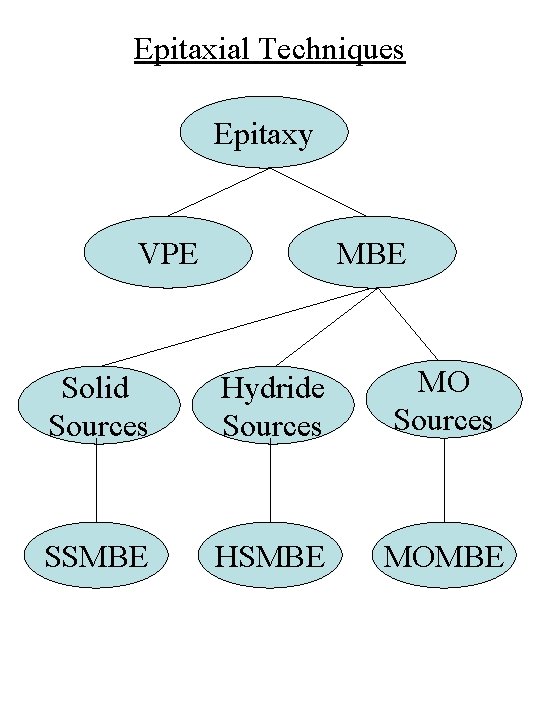
Epitaxial Techniques Epitaxy VPE MBE Solid Sources Hydride Sources MO Sources SSMBE HSMBE MOMBE
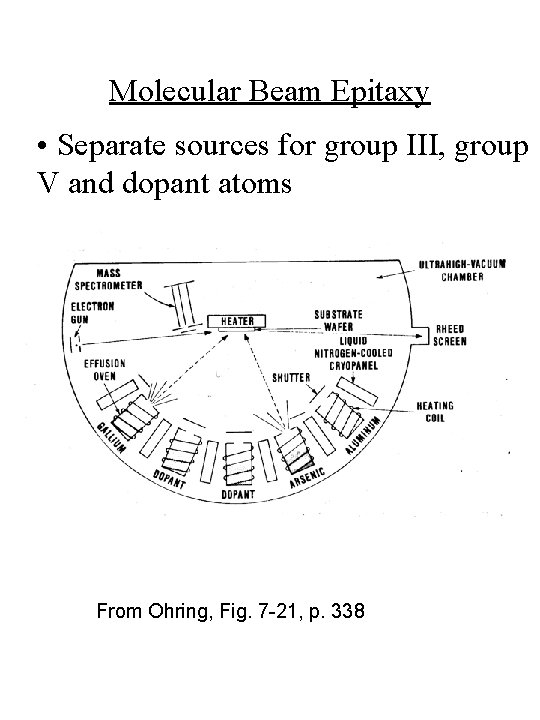
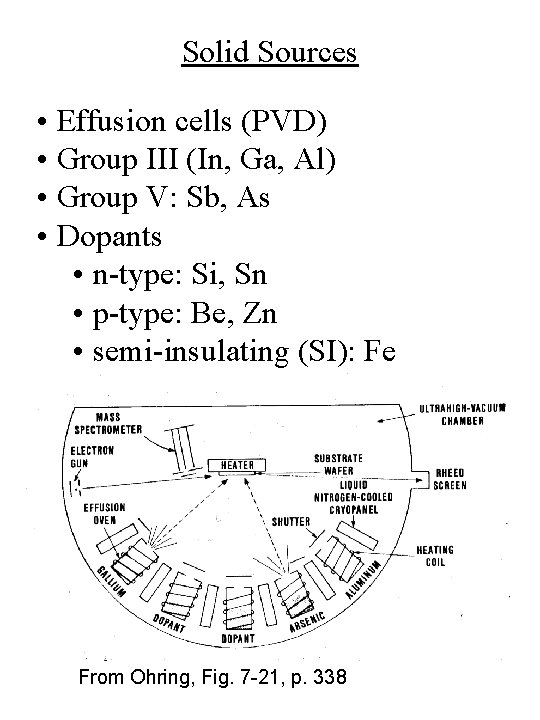
Molecular Beam Epitaxy • Separate sources for group III, group V and dopant atoms From Ohring, Fig. 7 -21, p. 338
Molecular Beam Epitaxy • UHV conditions required for sample purity • Cryopanels (hollow wall filled with liquid nitrogen) used to prevent water vapor & volatile contaminants from impinging on sample; cryopanels act as a fast pump • Mean free path of atoms or molecules in the beams > sourcesubstrate distance • Molecular flow = source atoms experience no collisions during their travel time
MBE History • Developed by A. Y. Cho, J. R. Arthur at Bell labs • Late 60’s to early 70’s • First MBE-grown material was Ga. As • Motivation was Ga. As/Al. Ga. As & In. Ga. As. P lasers for telecommunications
Why MBE ? • Ability to produce thin layers (quantum wells) • Ability to produce abrupt interfaces • Ability to produce abrupt compositional changes (heterostructures) • Ability to produce abrupt doping profiles (concentration and type of dopant)
Solid Sources • Effusion cells (PVD) • Group III (In, Ga, Al) • Group V: Sb, As • Dopants • n-type: Si, Sn • p-type: Be, Zn • semi-insulating (SI): Fe From Ohring, Fig. 7 -21, p. 338
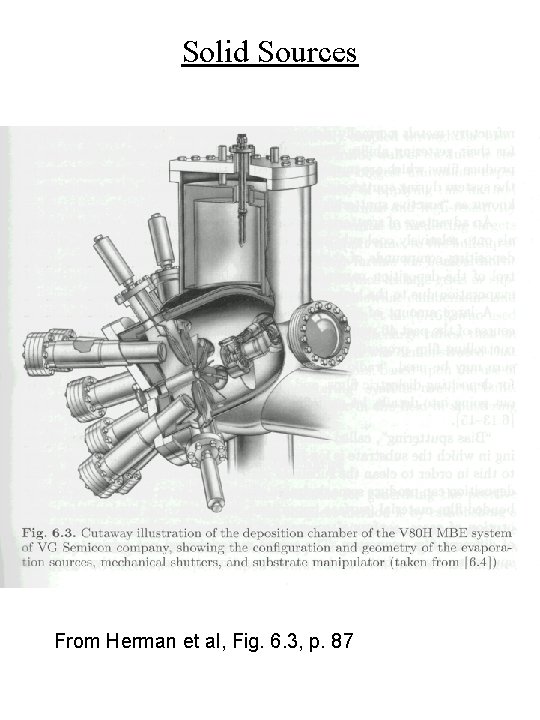
Solid Sources From Herman et al, Fig. 6. 3, p. 87
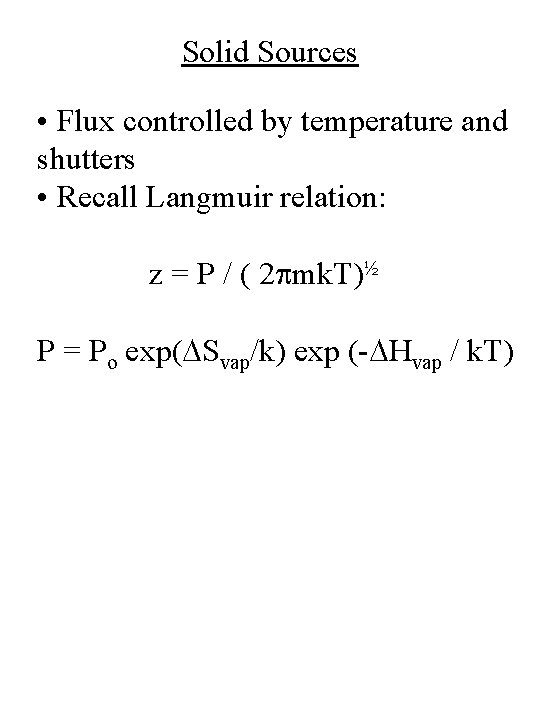
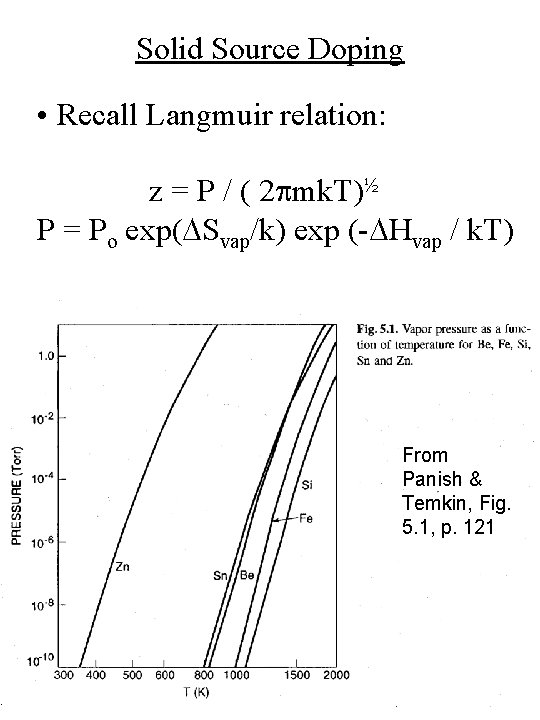
Solid Sources • Flux controlled by temperature and shutters • Recall Langmuir relation: z = P / ( 2 pmk. T)½ P = Po exp(DSvap/k) exp (-DHvap / k. T)
Solid Sources • To achieve |f | < 10 -3 in In. Ga. As, need Dx < 1% DTIn, Ga < ± 0. 5 °C • Solid sources determine uniformity of growth (thickness and composition) • Substrate rotation required
Substrate Holder • Provides sample rotation (magnetic coupling) • Provides a heater to achieve desired substrate temperature; temperature uniformity is important for composition uniformity across the sample • Sample is held mechanically (clips) or with In solder
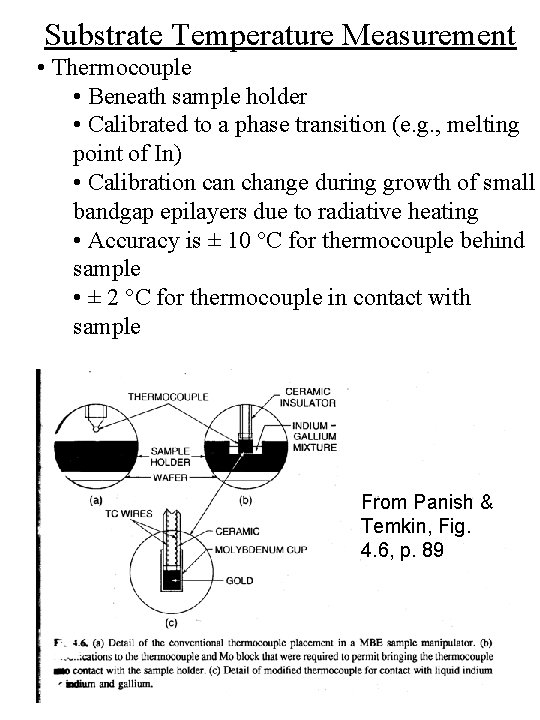
Substrate Temperature Measurement • Thermocouple • Beneath sample holder • Calibrated to a phase transition (e. g. , melting point of In) • Calibration can change during growth of small bandgap epilayers due to radiative heating • Accuracy is ± 10 °C for thermocouple behind sample • ± 2 °C for thermocouple in contact with sample From Panish & Temkin, Fig. 4. 6, p. 89
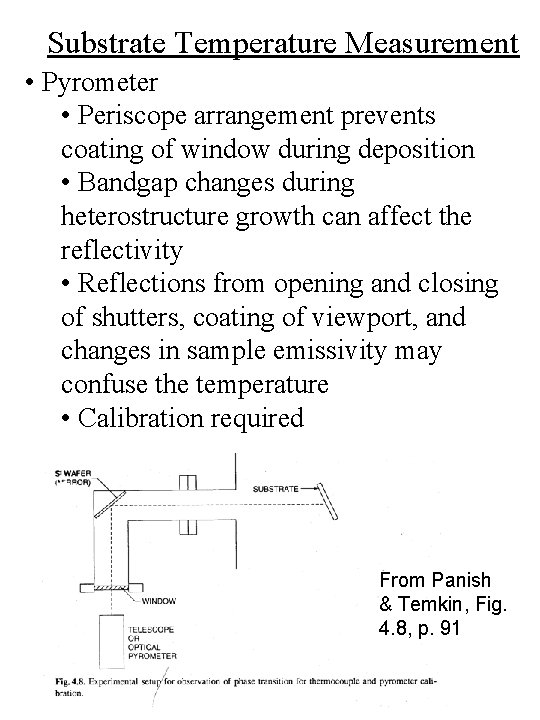
Substrate Temperature Measurement • Pyrometer • Periscope arrangement prevents coating of window during deposition • Bandgap changes during heterostructure growth can affect the reflectivity • Reflections from opening and closing of shutters, coating of viewport, and changes in sample emissivity may confuse the temperature • Calibration required From Panish & Temkin, Fig. 4. 8, p. 91
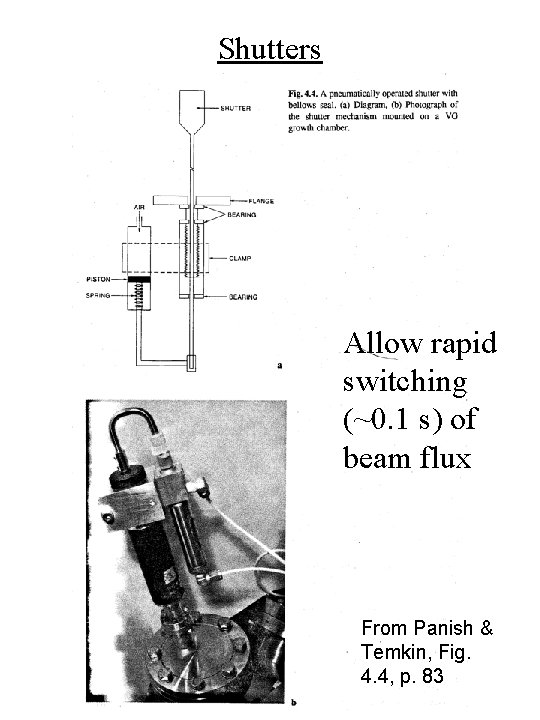
Shutters Allow rapid switching (~0. 1 s) of beam flux From Panish & Temkin, Fig. 4. 4, p. 83
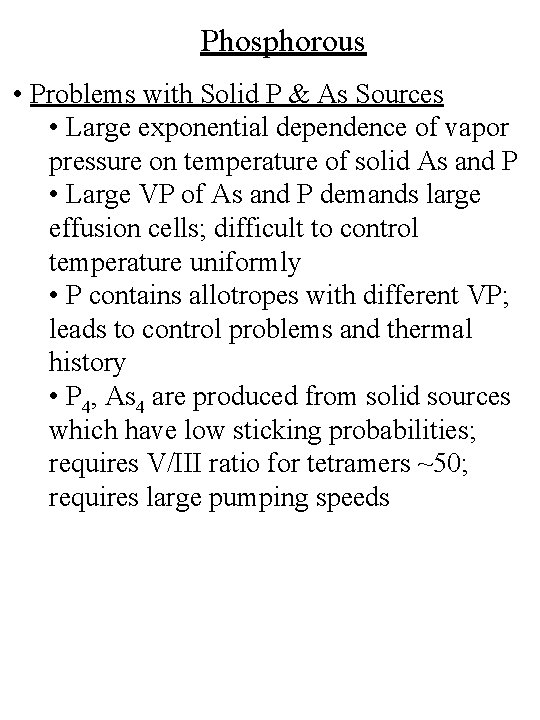
Phosphorous • Problems with Solid P & As Sources • Large exponential dependence of vapor pressure on temperature of solid As and P • Large VP of As and P demands large effusion cells; difficult to control temperature uniformly • P contains allotropes with different VP; leads to control problems and thermal history • P 4, As 4 are produced from solid sources which have low sticking probabilities; requires V/III ratio for tetramers ~50; requires large pumping speeds
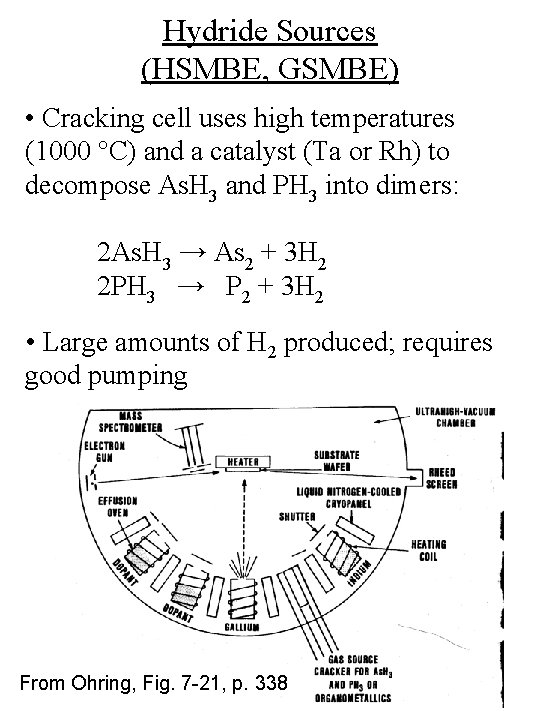
Hydride Sources (HSMBE, GSMBE) • Cracking cell uses high temperatures (1000 °C) and a catalyst (Ta or Rh) to decompose As. H 3 and PH 3 into dimers: 2 As. H 3 → As 2 + 3 H 2 2 PH 3 → P 2 + 3 H 2 • Large amounts of H 2 produced; requires good pumping From Ohring, Fig. 7 -21, p. 338
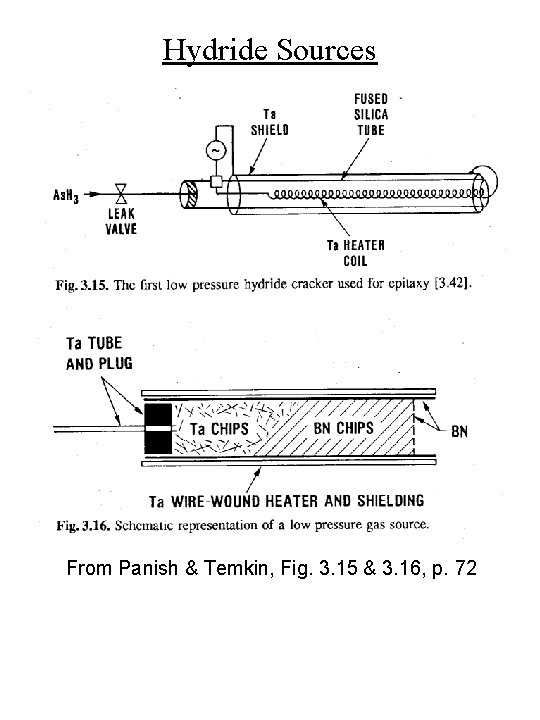
Hydride Sources From Panish & Temkin, Fig. 3. 15 & 3. 16, p. 72
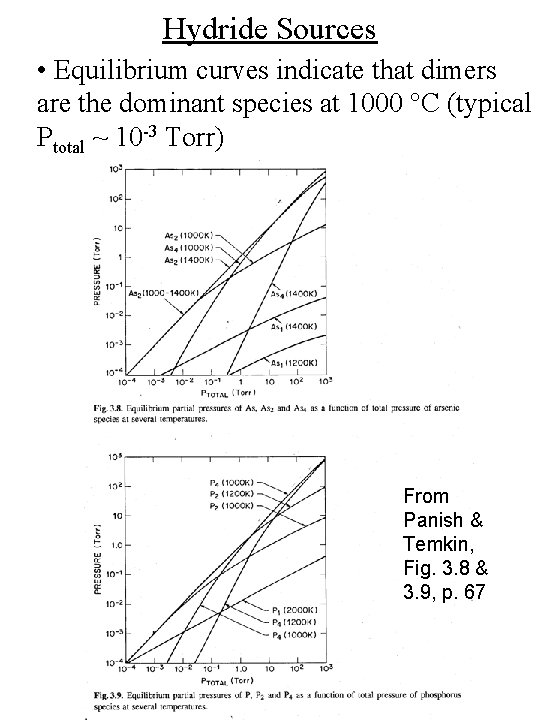
Hydride Sources • Equilibrium curves indicate that dimers are the dominant species at 1000 °C (typical Ptotal ~ 10 -3 Torr) From Panish & Temkin, Fig. 3. 8 & 3. 9, p. 67
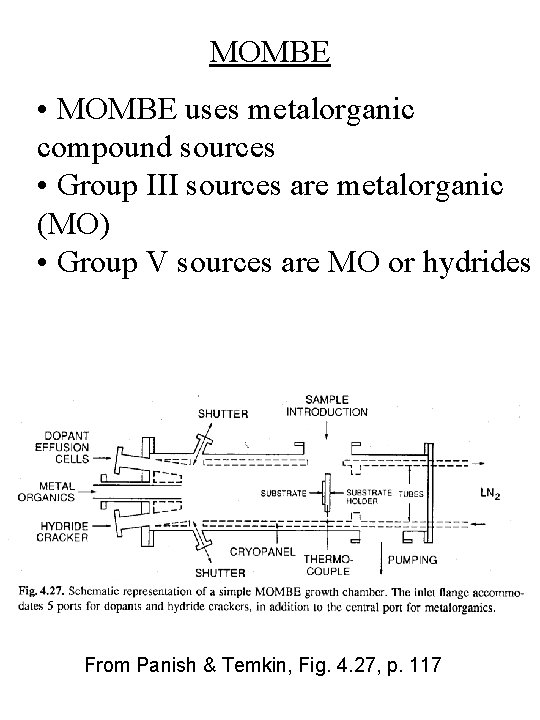
MOMBE • MOMBE uses metalorganic compound sources • Group III sources are metalorganic (MO) • Group V sources are MO or hydrides From Panish & Temkin, Fig. 4. 27, p. 117
MOMBE • Advantages compared to MBE: • Fewer hot sources (no group III effusion cells) • Infinite source supply • Single (mixed) group III beam for improved compositional uniformity • Advantages compared to MOVPE: • No boundary layer problems for scale-up • Beam nature for abrupt interfaces • UHV permits in situ characterization
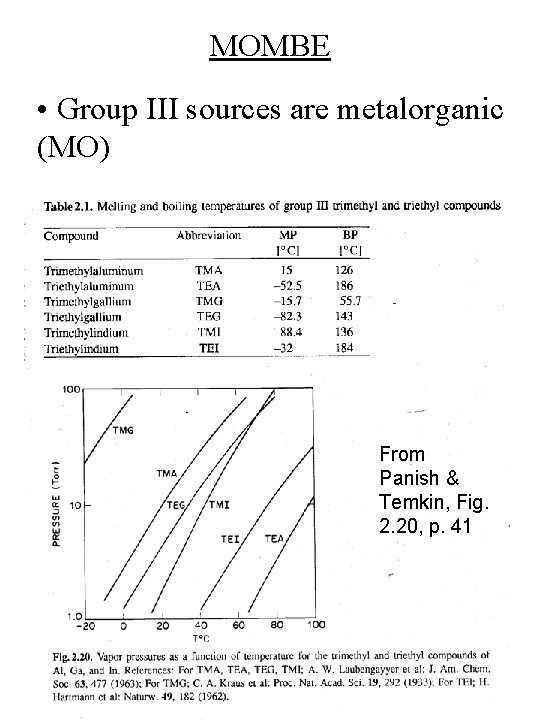
MOMBE • Group III sources are metalorganic (MO) From Panish & Temkin, Fig. 2. 20, p. 41
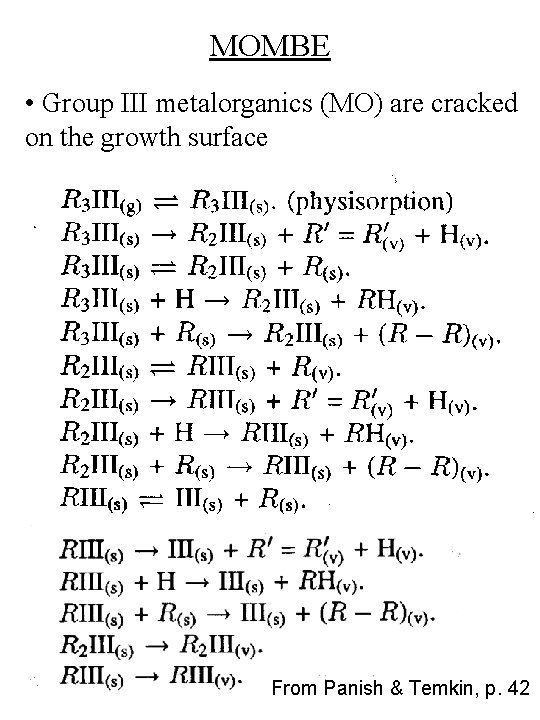
MOMBE • Group III metalorganics (MO) are cracked on the growth surface From Panish & Temkin, p. 42
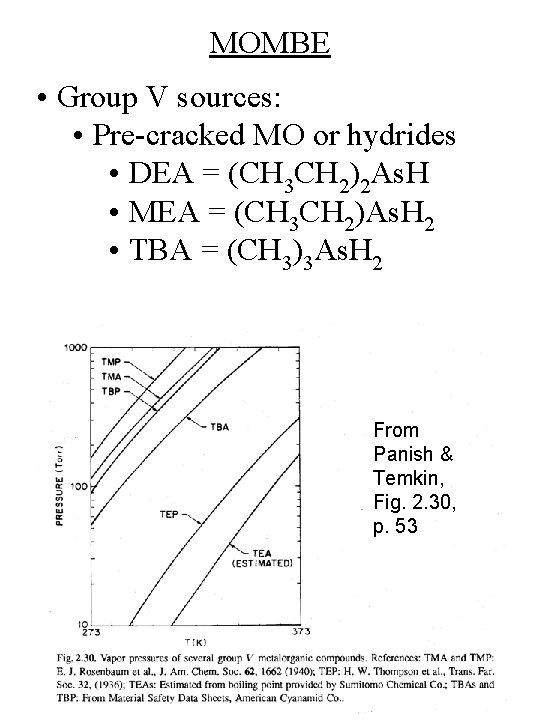
MOMBE • Group V sources: • Pre-cracked MO or hydrides • DEA = (CH 3 CH 2)2 As. H • MEA = (CH 3 CH 2)As. H 2 • TBA = (CH 3)3 As. H 2 From Panish & Temkin, Fig. 2. 30, p. 53
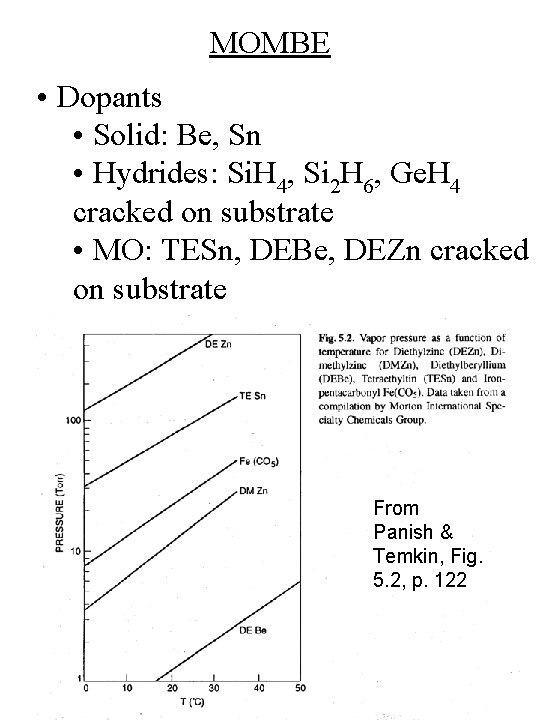
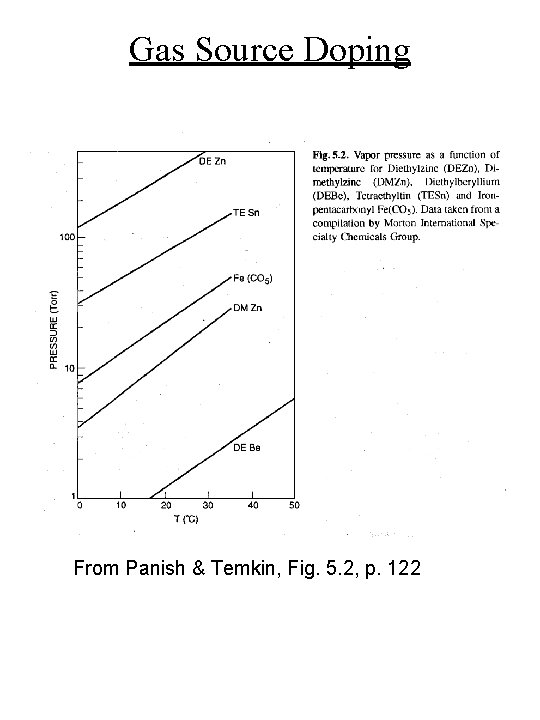
MOMBE • Dopants • Solid: Be, Sn • Hydrides: Si. H 4, Si 2 H 6, Ge. H 4 cracked on substrate • MO: TESn, DEBe, DEZn cracked on substrate From Panish & Temkin, Fig. 5. 2, p. 122
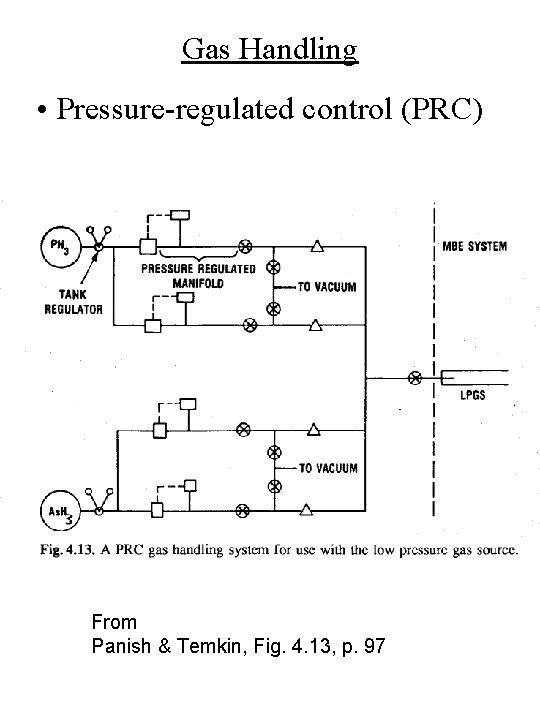
Gas Handling • Pressure-regulated control (PRC) From Panish & Temkin, Fig. 4. 13, p. 97
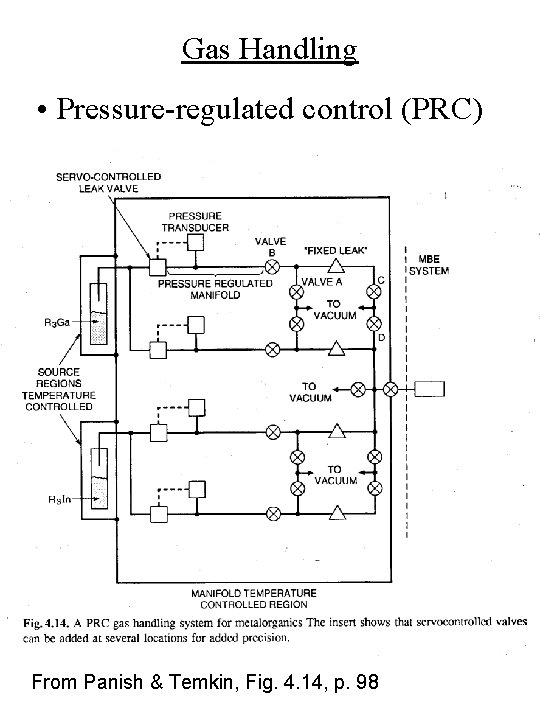
Gas Handling • Pressure-regulated control (PRC) From Panish & Temkin, Fig. 4. 14, p. 98
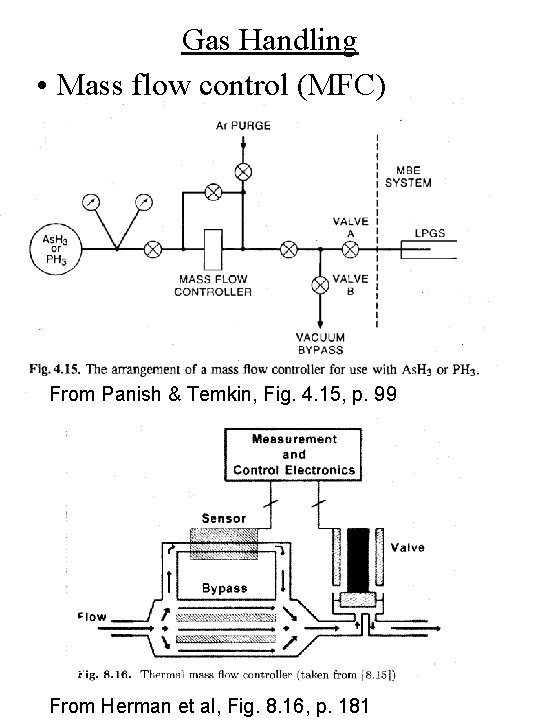
Gas Handling • Mass flow control (MFC) From Panish & Temkin, Fig. 4. 15, p. 99 From Herman et al, Fig. 8. 16, p. 181
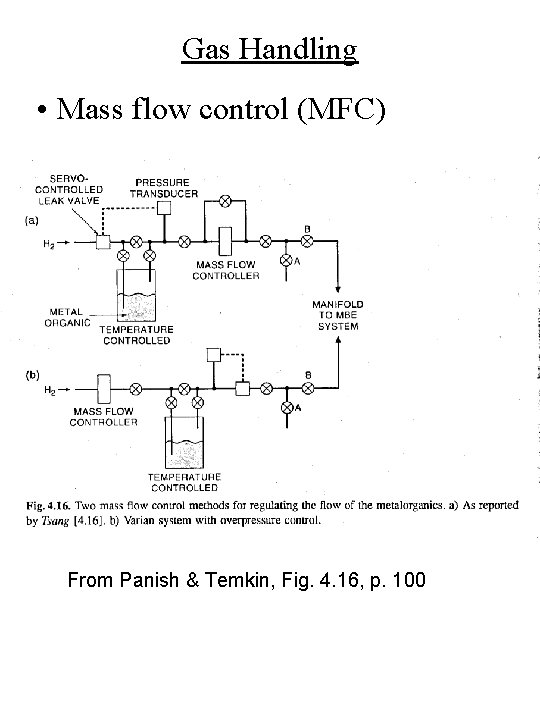
Gas Handling • Mass flow control (MFC) From Panish & Temkin, Fig. 4. 16, p. 100
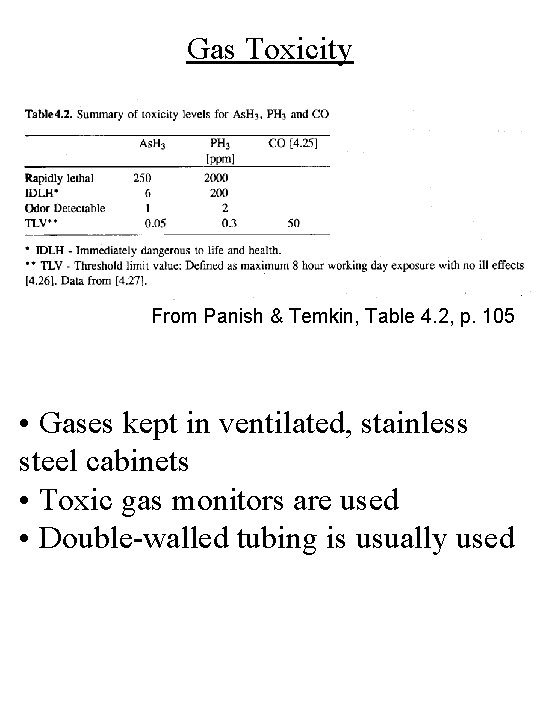
Gas Toxicity From Panish & Temkin, Table 4. 2, p. 105 • Gases kept in ventilated, stainless steel cabinets • Toxic gas monitors are used • Double-walled tubing is usually used
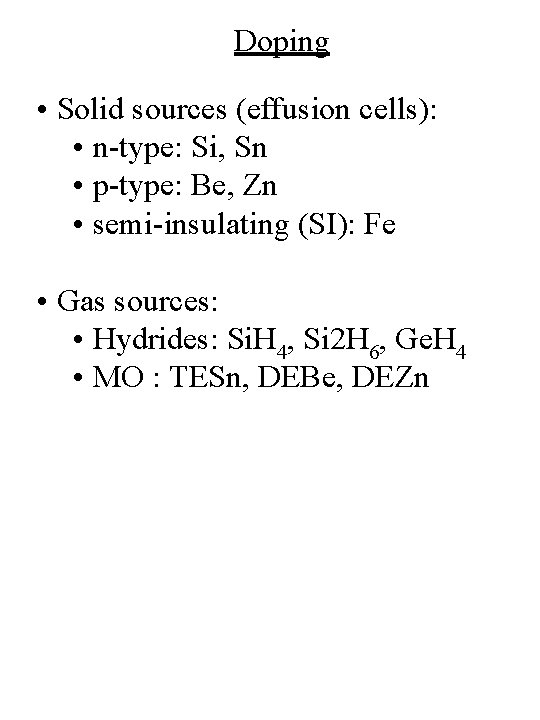
Doping • Solid sources (effusion cells): • n-type: Si, Sn • p-type: Be, Zn • semi-insulating (SI): Fe • Gas sources: • Hydrides: Si. H 4, Si 2 H 6, Ge. H 4 • MO : TESn, DEBe, DEZn
Solid Source Doping • Recall Langmuir relation: z = P / ( 2 pmk. T)½ P = Po exp(DSvap/k) exp (-DHvap / k. T) From Panish & Temkin, Fig. 5. 1, p. 121
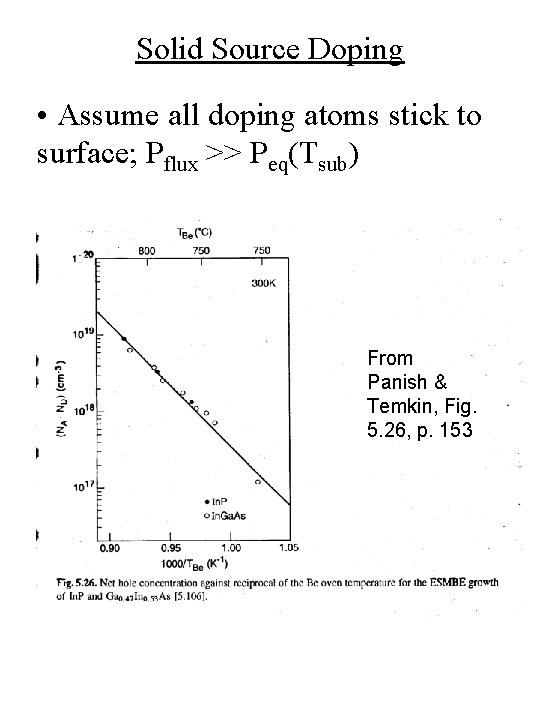
Solid Source Doping • Assume all doping atoms stick to surface; Pflux >> Peq(Tsub) From Panish & Temkin, Fig. 5. 26, p. 153
Gas Source Doping From Panish & Temkin, Fig. 5. 2, p. 122
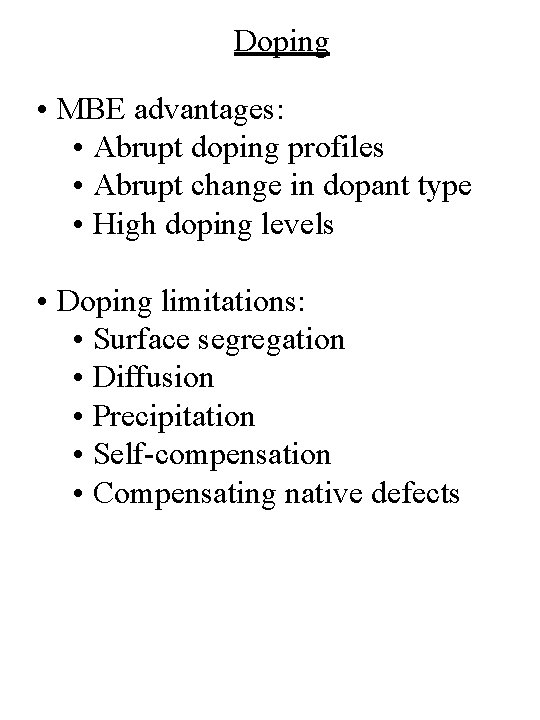
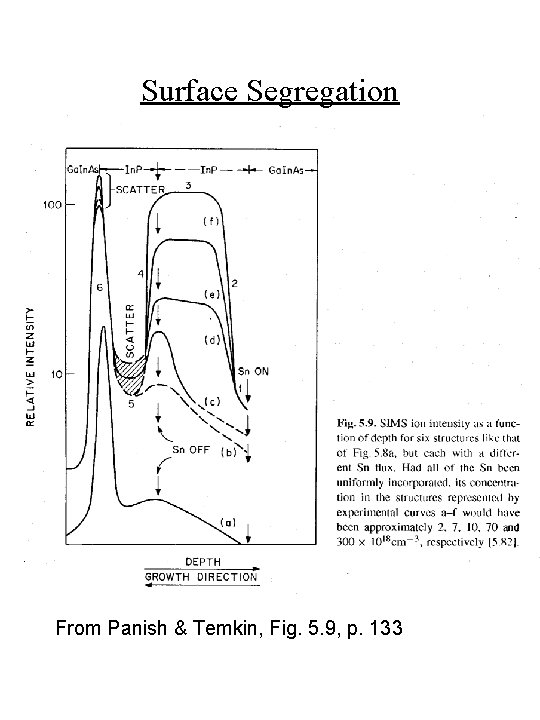
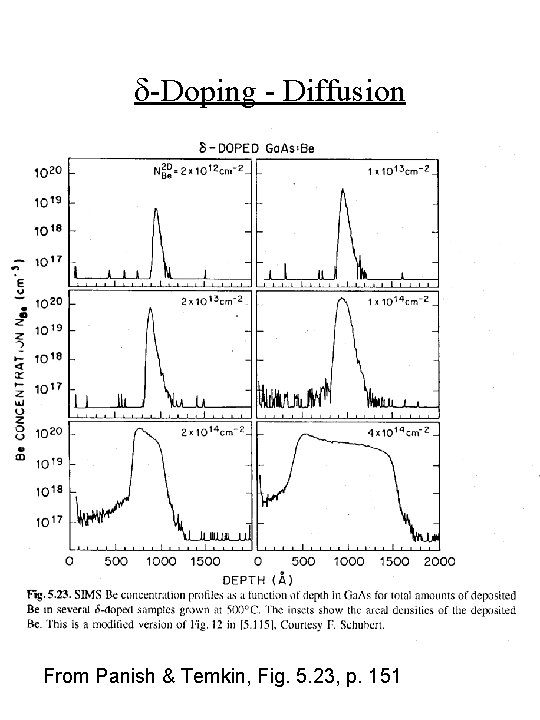
Doping • MBE advantages: • Abrupt doping profiles • Abrupt change in dopant type • High doping levels • Doping limitations: • Surface segregation • Diffusion • Precipitation • Self-compensation • Compensating native defects
Surface Segregation From Panish & Temkin, Fig. 5. 9, p. 133
d-Doping - Diffusion From Panish & Temkin, Fig. 5. 23, p. 151
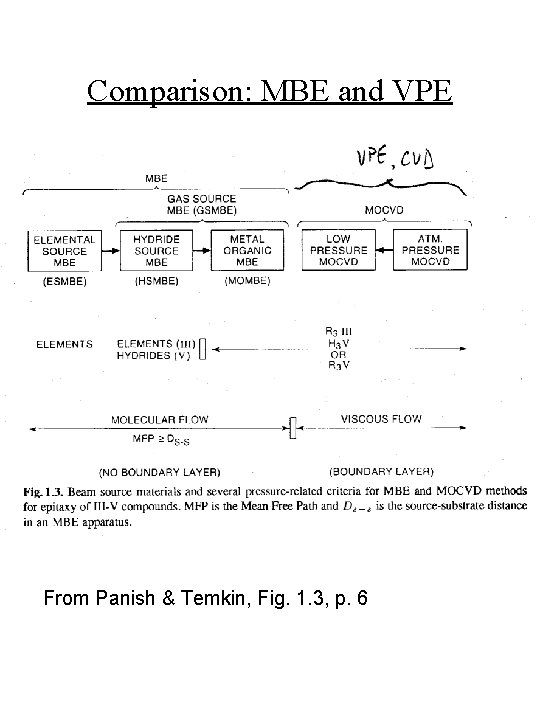
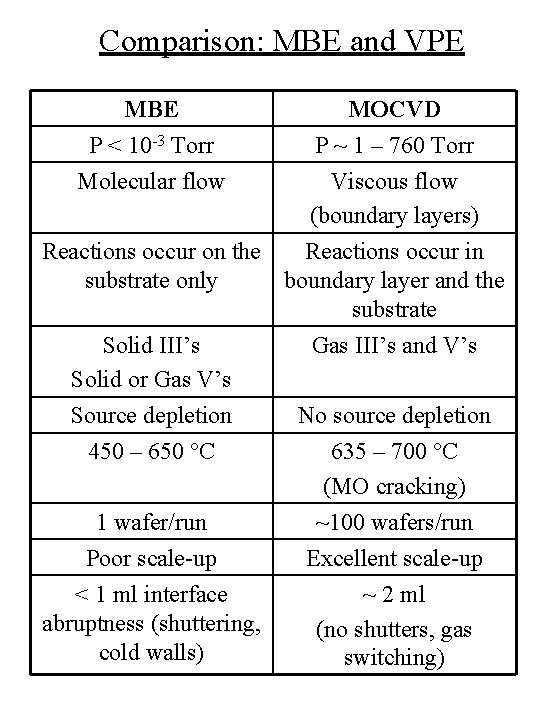
Comparison: MBE and VPE From Panish & Temkin, Fig. 1. 3, p. 6
Comparison: MBE and VPE MBE P < 10 -3 Torr Molecular flow MOCVD P ~ 1 – 760 Torr Viscous flow (boundary layers) Reactions occur on the Reactions occur in substrate only boundary layer and the substrate Solid III’s Solid or Gas V’s Source depletion 450 – 650 °C 1 wafer/run Poor scale-up < 1 ml interface abruptness (shuttering, cold walls) Gas III’s and V’s No source depletion 635 – 700 °C (MO cracking) ~100 wafers/run Excellent scale-up ~ 2 ml (no shutters, gas switching)