ENVIRONMENTAL SOCIAL GOVERNANCE ESG RELEVANCE SCORES Integration and



- Slides: 20
ENVIRONMENTAL SOCIAL GOVERNANCE (ESG) RELEVANCE SCORES Integration and Transparency in Ratings Michael Rinaldi Senior Director – USPF NC GFOA July 2019
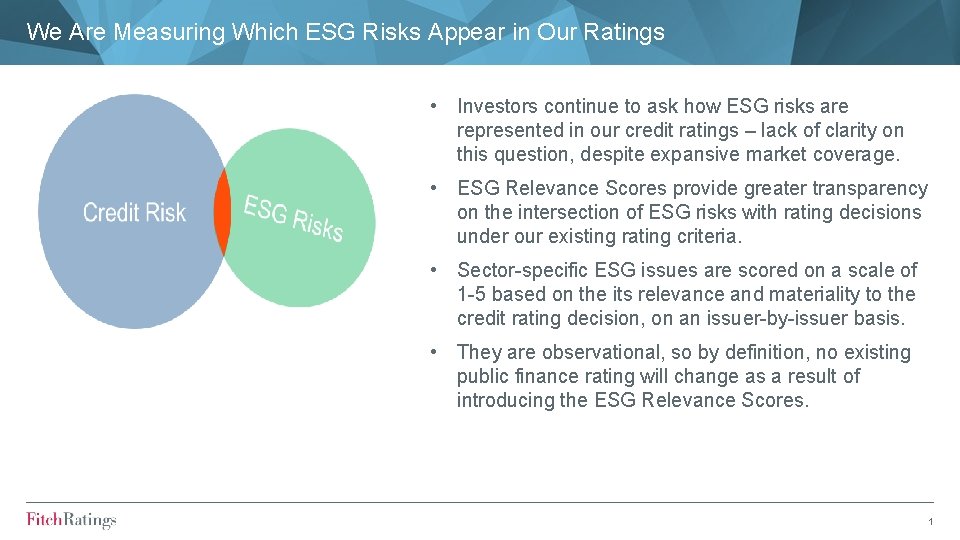
We Are Measuring Which ESG Risks Appear in Our Ratings • Investors continue to ask how ESG risks are represented in our credit ratings – lack of clarity on this question, despite expansive market coverage. • ESG Relevance Scores provide greater transparency on the intersection of ESG risks with rating decisions under our existing rating criteria. • Sector-specific ESG issues are scored on a scale of 1 -5 based on the its relevance and materiality to the credit rating decision, on an issuer-by-issuer basis. • They are observational, so by definition, no existing public finance rating will change as a result of introducing the ESG Relevance Scores. 1
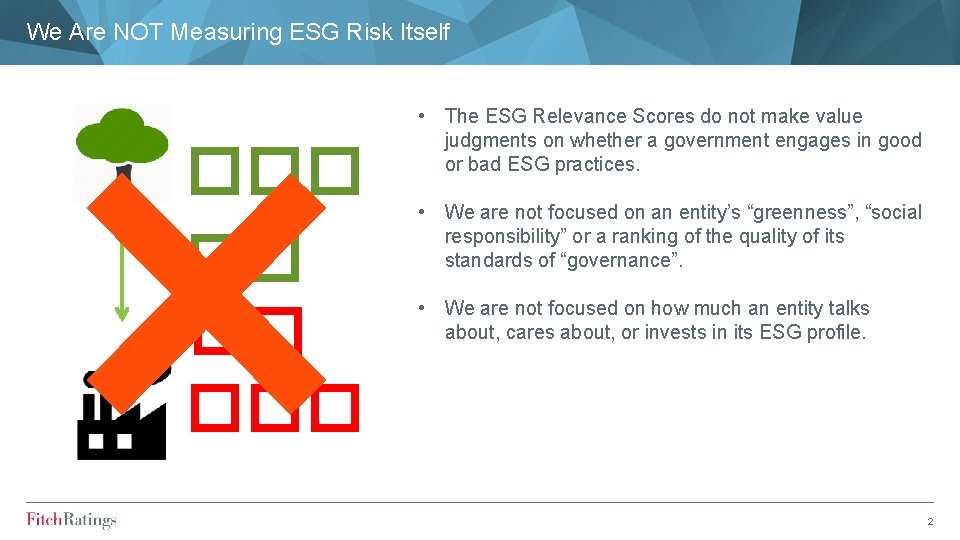
We Are NOT Measuring ESG Risk Itself ��� ��� • The ESG Relevance Scores do not make value judgments on whether a government engages in good or bad ESG practices. • We are not focused on an entity’s “greenness”, “social responsibility” or a ranking of the quality of its standards of “governance”. • We are not focused on how much an entity talks about, cares about, or invests in its ESG profile. 2
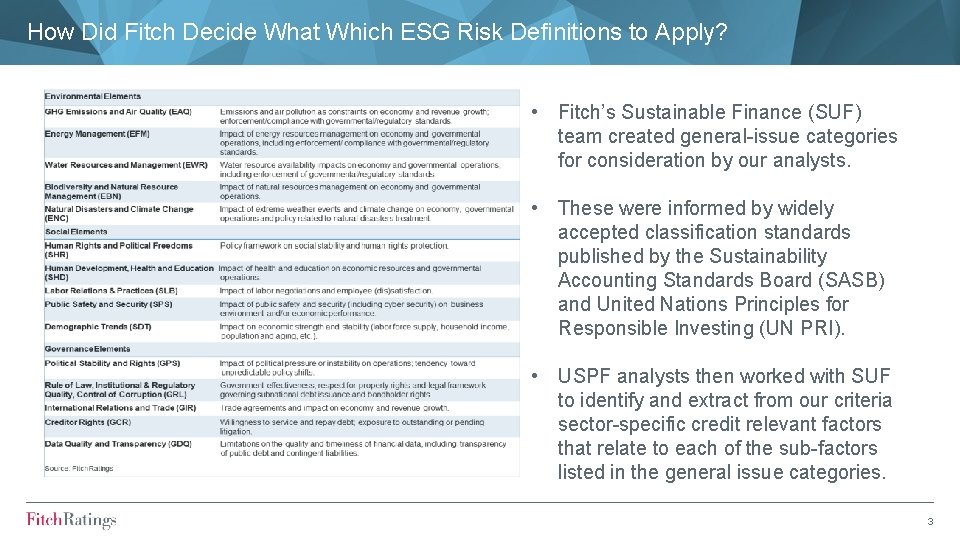
How Did Fitch Decide What Which ESG Risk Definitions to Apply? • Fitch’s Sustainable Finance (SUF) team created general-issue categories for consideration by our analysts. • These were informed by widely accepted classification standards published by the Sustainability Accounting Standards Board (SASB) and United Nations Principles for Responsible Investing (UN PRI). • USPF analysts then worked with SUF to identify and extract from our criteria sector-specific credit relevant factors that relate to each of the sub-factors listed in the general issue categories. 3
ESG A Limited USPF Credit-Rating Driver • ESG risks generally have a low level of direct impact on USPF credit ratings. • Fitch’s initial round of ESG Relevance Scoring for more than 2, 000 USPF issuers shows that 5% of ratings featured at least one elevated ESG Relevance Score (‘ 4’ or ‘ 5’). • For state and local governments, elevated ESG scores were largely concentrated within the social and governance risk elements and mostly related to below-standard features that work asymmetrically and negatively affect ratings. • Environmental factors were observed to have a relatively low influence in USPF ratings, which is mainly due to the U. S. federal government’s financial support to areas affected by hurricanes, floods, wildfires and other high-cost weather events. A shift in federal policy with respect to disaster recovery assistance would likely have downside implications for ratings in areas impacted by extreme weather events. 4
Fitch Ratings’ credit ratings rely on factual information received from issuers and other sources. Fitch Ratings cannot ensure that all such information will be accurate and complete. Further, ratings are inherently forward-looking, embody assumptions and predictions that by their nature cannot be verified as facts, and can be affected by future events or conditions that were not anticipated at the time a rating was issued or affirmed. The information in this presentation is provided “as is” without any representation or warranty. A Fitch Ratings credit rating is an opinion as to the creditworthiness of a security and does not address the risk of loss due to risks other than credit risk, unless such risk is specifically mentioned. A Fitch Ratings report is not a substitute for information provided to investors by the issuer and its agents in connection with a sale of securities. Ratings may be changed or withdrawn at any time for any reason in the sole discretion of Fitch Ratings. The agency does not provide investment advice of any sort. Ratings are not a recommendation to buy, sell, or hold any security. ALL FITCH CREDIT RATINGS ARE SUBJECT TO CERTAIN LIMITATIONS AND DISCLAIMERS. PLEASE READ THESE LIMITATIONS AND DISCLAIMERS AND THE TERMS OF USE OF SUCH RATINGS AT WWW. FITCHRATINGS. COM. 5
fitchratings. com @fitchratings Hong Kong New York London 19/F Man Yee Building 68 Des Voeux Road Central Hong Kong 33 Whitehall Street New York NY 10004 30 North Colonnade Canary Wharf London, E 14 5 GN
Integrating Environmental, Social & Governance "ESG" in Municipal Bond Investment Strategies NCGFOA July 23, 2019 See important disclosures on the last page of this presentation Breckinridge Capital Advisors | 7
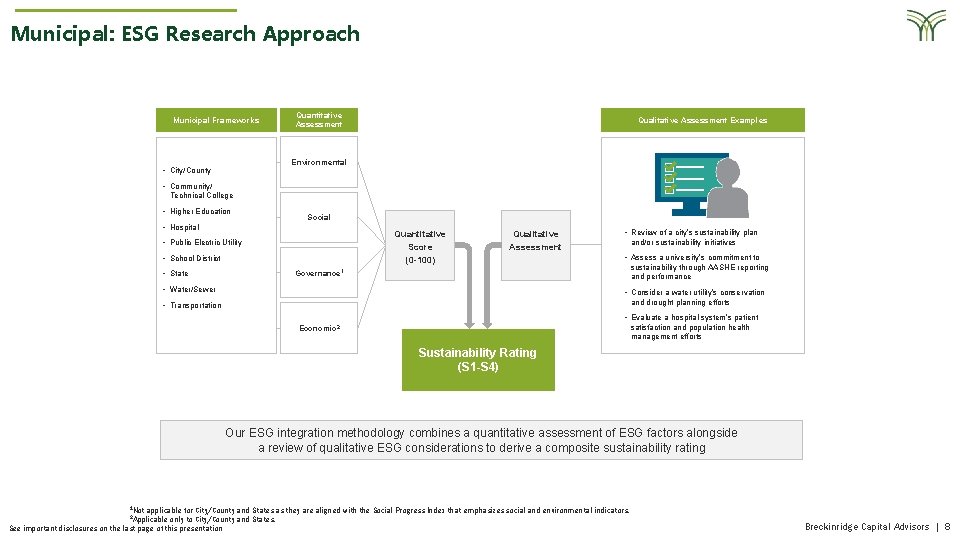
Municipal: ESG Research Approach Municipal Frameworks Quantitative Assessment Qualitative Assessment Examples Environmental • City/County • Community/ Technical College • Higher Education • Hospital Social Quantitative Score (0 -100) • Public Electric Utility • School District • State Qualitative Assessment • Review of a city’s sustainability plan and/or sustainability initiatives • Assess a university’s commitment to sustainability through AASHE reporting and performance Governance 1 • Water/Sewer • Consider a water utility’s conservation and drought planning efforts • Transportation • Evaluate a hospital system’s patient satisfaction and population health management efforts Economic 2 Sustainability Rating (S 1 -S 4) Our ESG integration methodology combines a quantitative assessment of ESG factors alongside a review of qualitative ESG considerations to derive a composite sustainability rating 1 Not applicable for City/County and States as they are aligned with the Social Progress Index that emphasizes social and environmental indicators. Applicable only to City/County and States. See important disclosures on the last page of this presentation 2 Breckinridge Capital Advisors | 8
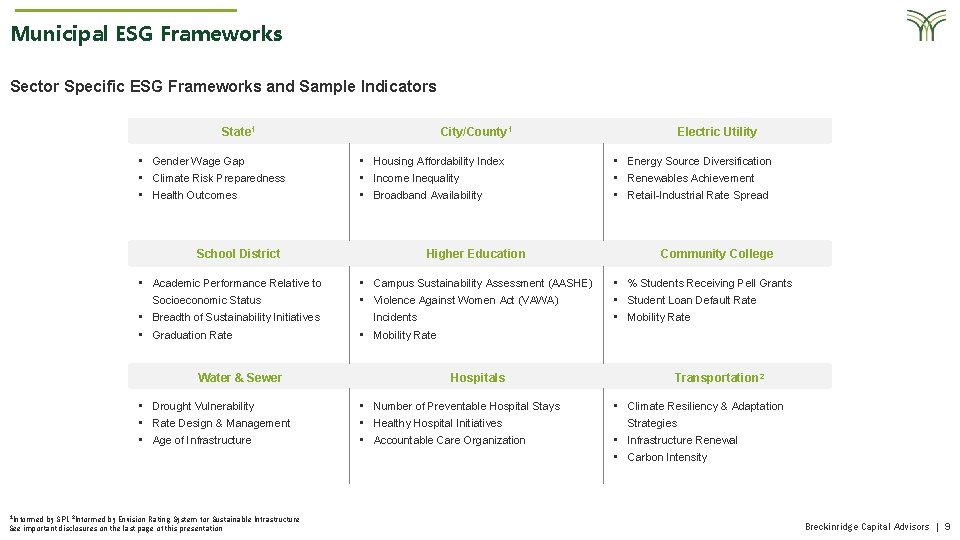
Municipal ESG Frameworks Sector Specific ESG Frameworks and Sample Indicators State 1 • Gender Wage Gap • Climate Risk Preparedness • Health Outcomes School District • Academic Performance Relative to Socioeconomic Status • Breadth of Sustainability Initiatives • Graduation Rate Water & Sewer • Drought Vulnerability • Rate Design & Management • Age of Infrastructure 1 Informed by SPI. 2 Informed by Envision Rating System for Sustainable Infrastructure See important disclosures on the last page of this presentation City/County 1 • Housing Affordability Index • Income Inequality • Broadband Availability Higher Education • Campus Sustainability Assessment (AASHE) • Violence Against Women Act (VAWA) Incidents • Mobility Rate Hospitals • Number of Preventable Hospital Stays • Healthy Hospital Initiatives • Accountable Care Organization Electric Utility • Energy Source Diversification • Renewables Achievement • Retail-Industrial Rate Spread Community College • % Students Receiving Pell Grants • Student Loan Default Rate • Mobility Rate Transportation 2 • Climate Resiliency & Adaptation Strategies • Infrastructure Renewal • Carbon Intensity Breckinridge Capital Advisors | 9
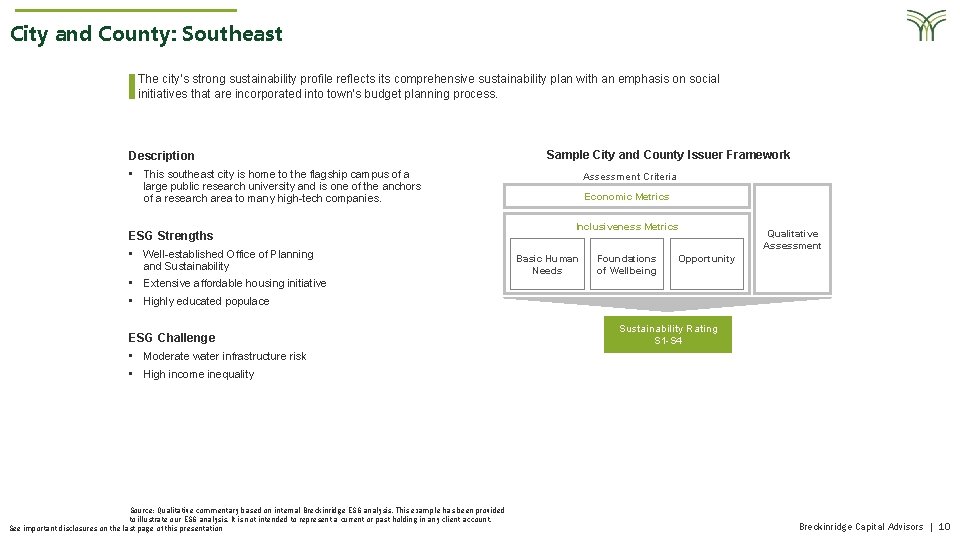
City and County: Southeast The city’s strong sustainability profile reflects its comprehensive sustainability plan with an emphasis on social initiatives that are incorporated into town’s budget planning process. Description Sample City and County Issuer Framework • This southeast city is home to the flagship campus of a large public research university and is one of the anchors of a research area to many high-tech companies. ESG Strengths • Well-established Office of Planning and Sustainability Assessment Criteria Economic Metrics Inclusiveness Metrics Basic Human Needs Foundations of Wellbeing Qualitative Assessment Opportunity • Extensive affordable housing initiative • Highly educated populace ESG Challenge Sustainability Rating S 1 -S 4 • Moderate water infrastructure risk • High income inequality Source: Qualitative commentary based on internal Breckinridge ESG analysis. This example has been provided to illustrate our ESG analysis. It is not intended to represent a current or past holding in any client account. See important disclosures on the last page of this presentation Breckinridge Capital Advisors | 10
Disclaimer This presentation has been prepared for investment professional use only. It is not is intended for general public use. This presentation contains the opinions and views of Breckinridge Capital Advisors, Inc. All information is current as of the date(s) indicated and is subject to change without notice. Nothing contained herein should be construed or relied upon as tax, legal or financial advice. All investments involve risks, including the loss of principal. Not all securities or issuers mentioned represent bonds held in any client portfolio. Some securities have been provided for illustrative purposes only, and should not be construed as investment recommendations. Any ESG analysis and engagement examples are intended to illustrate a part of Breckinridge’s research process. Breckinridge’s sustainability rating is based on third party objective data and Breckinridge credit analysts’ subjective internal analysis. A high sustainability rating does not mean a bond will provide positive returns. Any projections, estimates, targets or other forward-looking statements are based on Breckinridge’s research, analysis, and assumptions. There can be no assurances that such projections will occur and the actual results may differ materially. Other events that were not taken into account in formulating such projections could occur and may significantly affect the outcome, returns or performance of any account. Past performance is not indicative of future results. Performance results for Breckinridge’s investment strategies include the reinvestment of interest and any other earnings, but they may not reflect the impact that any material market or economic factors would have had on the accounts during the time period. Performance results do not reflect any brokerage or trading costs a client would have paid. Due to differences in client restrictions, objectives, cash flows and other such factors, individual client account performance may differ substantially from the performance presented. Information from companies not affiliated with Breckinridge (“third party content”) is believed to be reliable but its accuracy or completeness cannot be guaranteed. Investment professionals should conduct independent versification of third party content prior to use. Index Results Index results are shown for illustrative purposes and do not represent the performance of any specific investment. Indices are unmanaged and investors cannot directly invest in them. They do not reflect any management, custody, transaction or other expenses, and generally assume reinvestment of dividends, income and capital gains. Performance of indices may be more or less volatile than any investment strategy. Each of the Bloomberg Barclays indices has a variety of duration-based components against which we bench our strategies. The Bloomberg Barclays Municipal Bond Index is considered representative of the broad market for investment grade, tax-exempt bonds with a maturity of at least one year. The Bloomberg Barclays U. S. Government/Credit Index measures the performance of investment grade, U. S. -dollar denominated government and corporate bonds with maturities of at least one year. The S&P 500 Index is a common measure of the broad U. S. equity market and is composed of the top 500 publicly traded U. S. companies. (Source: S&P Dow Jones) The MSCI ACWI Ex-US Index measures the performance of large and mid cap non-U. S. equities across multiple developed and emerging countries. (Source: MSCI) The S&P Core. Logic Case-Shiller 20 -City Composite City Home Price SA Index measures the value of residential real estate in 20 major U. S. metropolitan areas. (Source: S&P Dow Jones) BLOOMBERG® is a trademark and service mark of Bloomberg Finance L. P. and its affiliates (collectively “Bloomberg”). BARCLAYS® is a trademark and service mark of Barclays Bank Plc (collectively with its affiliates, “Barclays”), used under license. Bloomberg or Bloomberg’s licensors, including Barclays, own all proprietary rights in the Bloomberg Barclays Indices. Neither Bloomberg nor Barclays approves or endorses this material, or guarantees the accuracy or completeness of any information herein, or makes any warranty, express or implied, as to the results to be obtained therefrom and, to the maximum extent allowed by law, neither shall have any liability or responsibility for injury or damages arising in connection therewith. See important disclosures on the last page of this presentation Breckinridge Capital Advisors | 11
What is Raleigh’s Office of Sustainability Mission of the Office • Work collaboratively to prioritize economic, social, and environmental efforts at an individual, organizational, and community-wide level. • Test new technologies and encourage new ways of thinking to positively impact the environment, our local economy, and all who live, work, and play in Raleigh. Current Projects Examples • Climate Energy Action Plan Community Climate Action • Resilience & Equity • Innovation & Smart Cities, Electric Vehicles • Environmental Stewardship, Food Insecurity
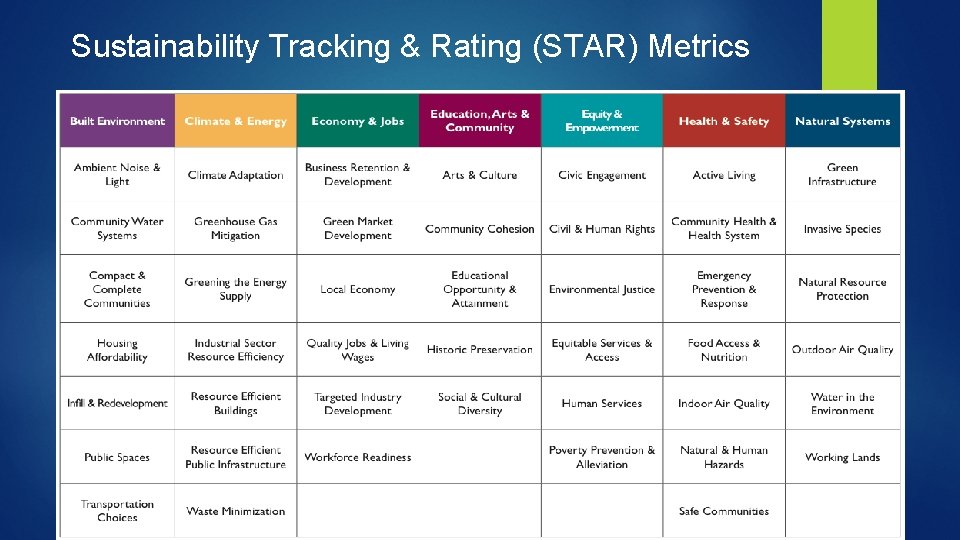
Sustainability Tracking & Rating (STAR) Metrics
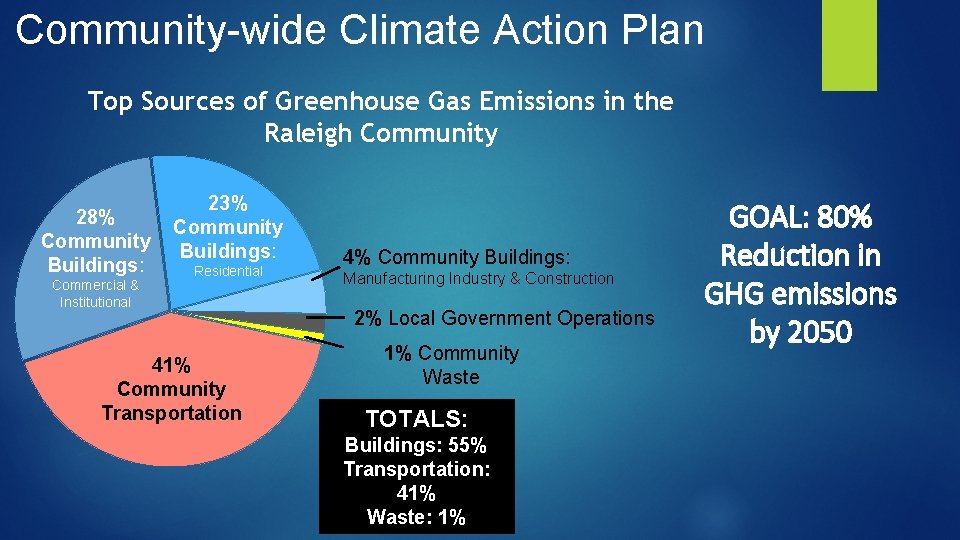
Community-wide Climate Action Plan Top Sources of Greenhouse Gas Emissions in the Raleigh Community 23% 28% Community Buildings: Residential Commercial & Institutional 41% Community Transportation 4% Community Buildings: Manufacturing Industry & Construction 2% Local Government Operations 1% Community Waste TOTALS: Buildings: 55% Transportation: 41% Waste: 1% GOAL: 80% Reduction in GHG emissions by 2050
Equality vs. Equity
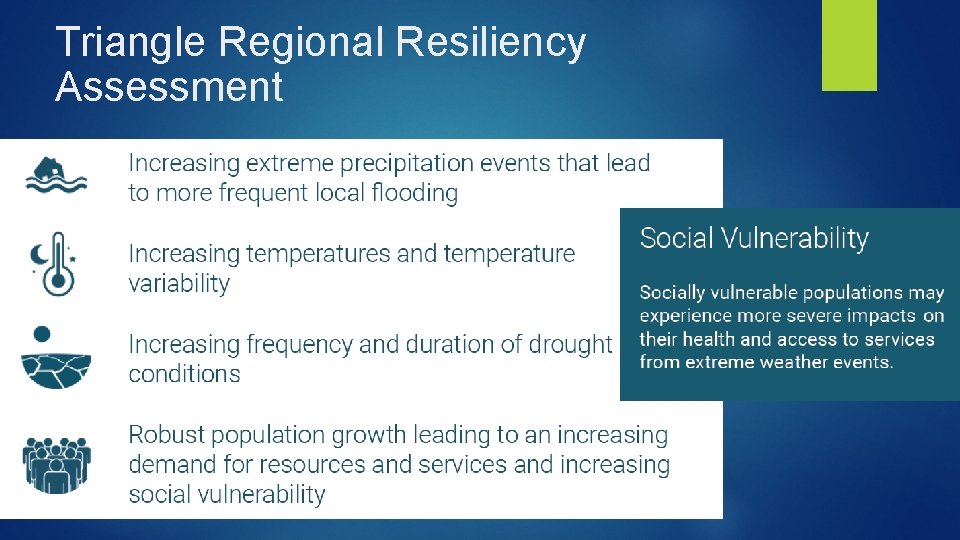
Triangle Regional Resiliency Assessment
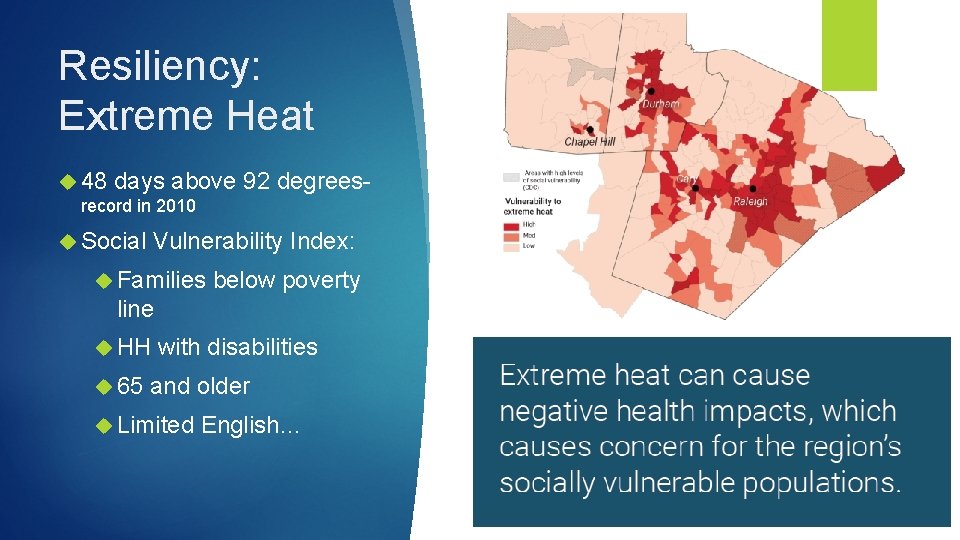
Resiliency: Extreme Heat 48 days above 92 degrees- record in 2010 Social Vulnerability Index: Families below poverty line HH with disabilities 65 and older Limited English…
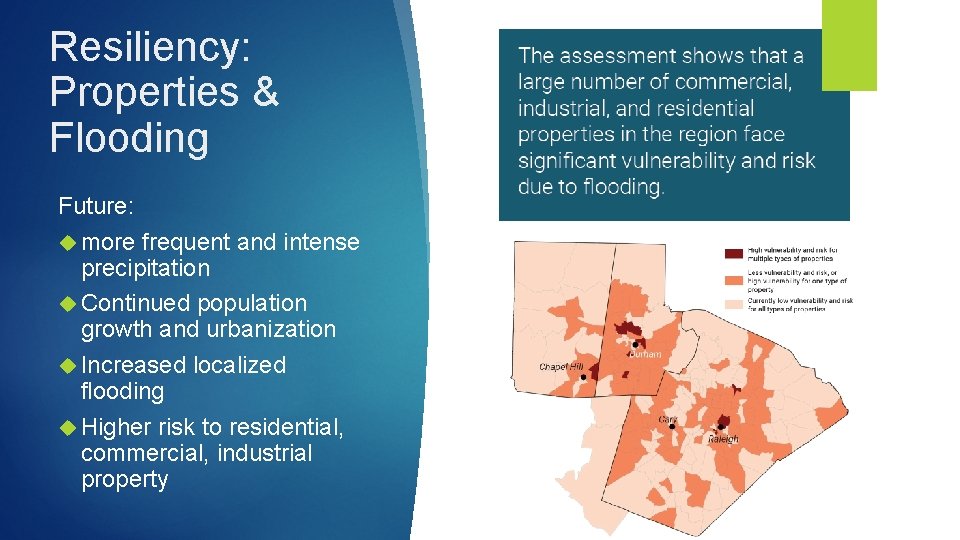
Resiliency: Properties & Flooding Future: more frequent and intense precipitation Continued population growth and urbanization Increased localized flooding Higher risk to residential, commercial, industrial property
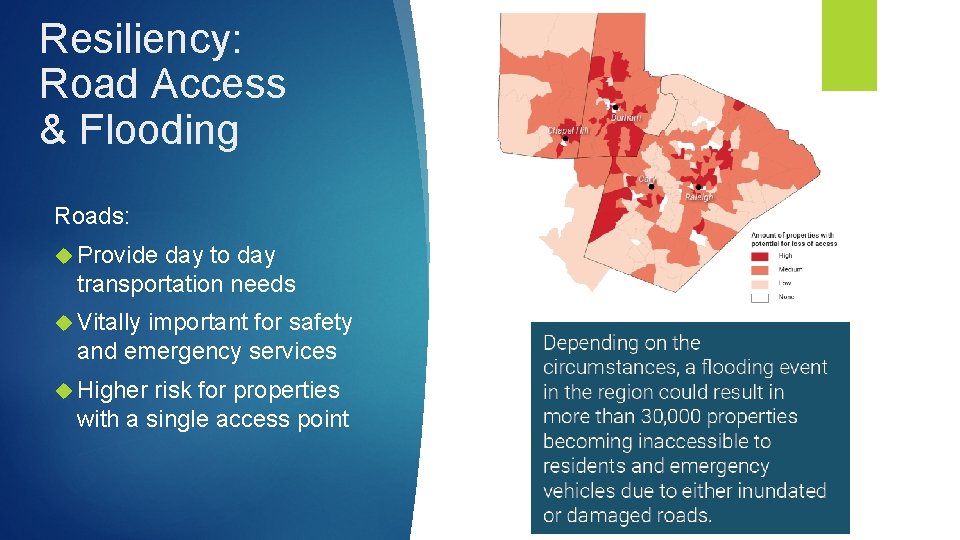
Resiliency: Road Access & Flooding Roads: Provide day to day transportation needs Vitally important for safety and emergency services Higher risk for properties with a single access point